Held Karp Algorithm implemented in Python
Dependencies
pip install memory-profiler seaborn matplotlib pandas numpy
Quick Overview
- Find the main entrypoint here: https://github.com/VIEWVIEWVIEW/held-karp/blob/main/tsp.py#L144
- First you need to read a file with coordinates, you can find a brief description below. You can use
get_cities()for that, like so:
list_of_cities = get_list_of_cities('your-file.txt')- Afterwards you need to generate a 2d distance matrix. You can use
get_distance_table()for that, like so:
dist = get_distance_table(list_of_cities)- Finally, just pass the distance matrix to the tsp algorithm, which returns a tuple with the optimal path length as an integer, and the optimal path itself as a list:
length_of_optimal_path, optimal_path = tsp(dist)Format of source files with coordinates
Use the following space seperated data format:
numeric-id x y
1 512 512
2 1337 1337
3 456 456
4 789 789
5 987 654
6 123 321
7 876 543
Any lines which do not follow this format are ignored.
list_of_cities
In case you want to write your own data importer, make sure you return it in the following fashion:
class City(TypedDict):
    """City object with ID and coordinates"""
    id: int
    x: float
    y: float


def custom_list_of_cities_importer():
    """
    :return: []: City
    """
    list_of_cities = []

    for i in range(10):
      city = City(id=i, x=i * 2, y=i / 2)
      list_of_cities.append(city)

    return list_of_cities
Performance
Time
Time complexity grows exponentially:
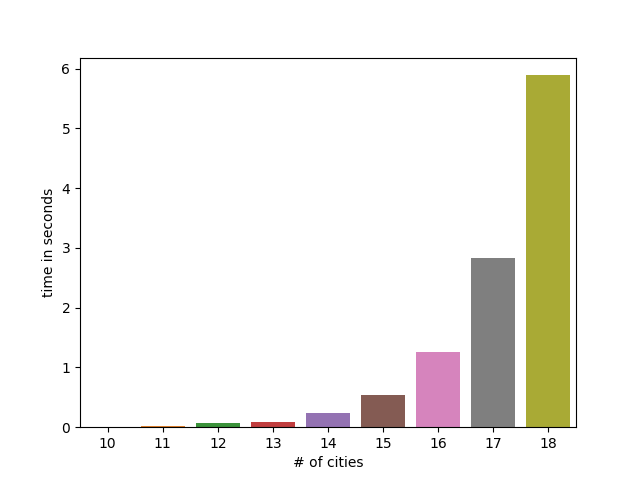

You can find the benchmark script to create these charts in main.py.
It runs with the following number of cities by default: [10, 11, 12, 13, 14, 15, 16, 17, 18, 19, 20, 21, 22]
In case you only want to run with a specific amount of cities, just run main like so: python main.py --amount-of-cities 15
Memory
For memory profiling we used memory-profiler.
If you want to create a memory profile, just use the memory-profiler mrun feature:
mprof run --include-children main.py --amount-of-cities 15
It will sample the memory usage of the python process into a new file mprofile_<timestamp>.dat. Afterwards you can plot it using mplot mprofile_<timestamp>.dat. Don't forget to install matplotlib.
12 Cities

18 Cities

20 Cities
