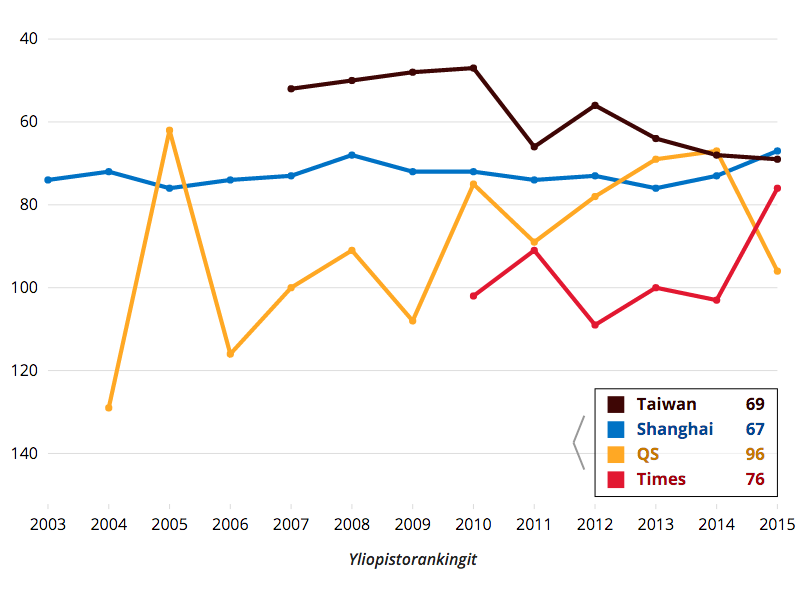
Line Chart
A line chart made with d3.js.
Installation
After downloading the repository, run bower install to install dependencies. (Note: For more information on installing and using bower, see bower.io)
To customize, alter the parameters in app.js. Serve the directory over HTTP and view in your browser to see an example of the application in action.
This program is licensed under GPL V2. See LICENSE for more details.