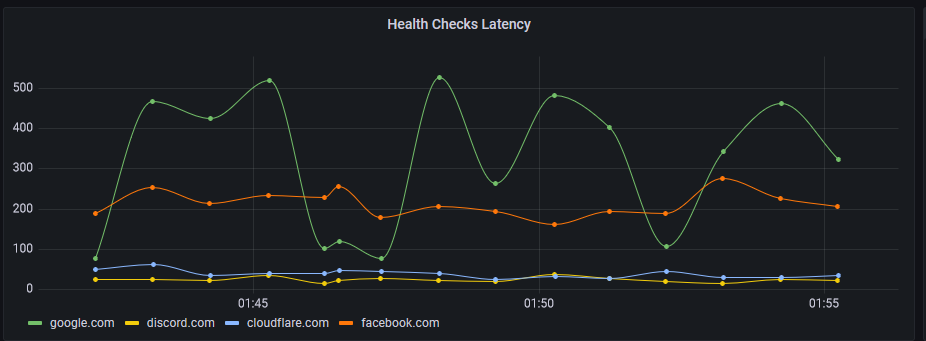
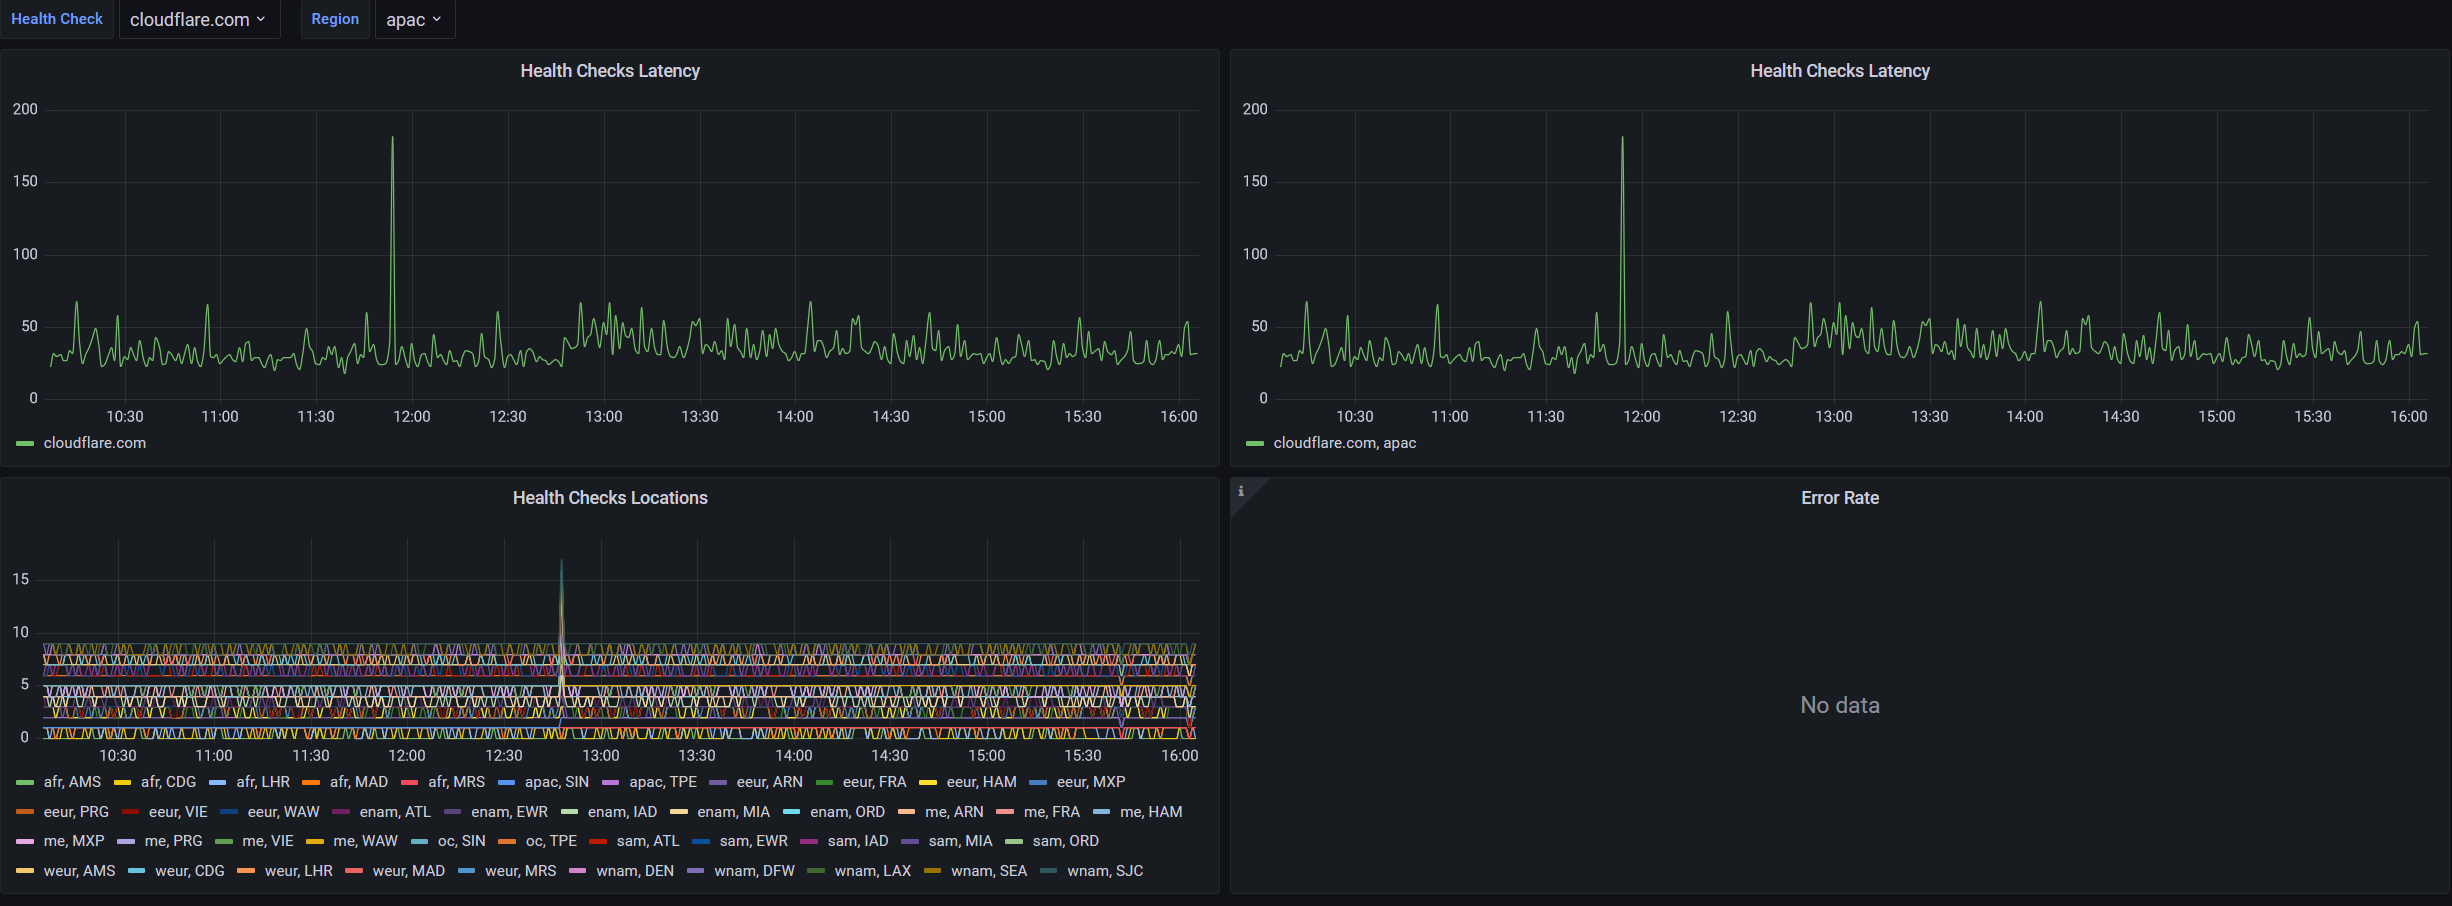
A fun example of a health checking service using Cloudflare's SQLite Database, D1, with Cloudflare Analytics Engine (AE). This uses CRON Workers to execute Durable Objects in specific regions (locationHints) to do health checks on websites, checking for various conditions including response code, and response body, and writing to Analytics Engine for visualization in Grafana.
Enable D1, Analytics Engine, and Durable Objects on your account. This will required Workers Paid.
wrangler d1 create worker-health-checks
Then, change the wrangler.toml to your database_id. Wrangler will print the entire block for you, you can just replace the existing one.
Leave the AE Sections alone, you don't need to create anything first for that.
wrangler d1 execute worker-health-checks --file=init.sql
(Google rate limits CF Workers, so we're just accepting it as valid for the demo)
wrangler d1 execute worker-health-checks --command="Insert Into health_checks (`Name`, `Target`, `Type`) values ('facebook.com', 'https://facebook.com', 'http')"
wrangler d1 execute worker-health-checks --command="Insert Into health_checks (`Name`, `Target`, `Type`) values ('discord.com', 'https://discord.com', 'http')"
wrangler d1 execute worker-health-checks --command="Insert Into health_checks (`Name`, `Target`, `Type`, `ExpectedCodes`) values ('google.com', 'https://google.com', 'http', '200, 429')"
wrangler d1 execute worker-health-checks --command="Insert Into health_checks (`Name`, `Target`, `Type`) values ('cloudflare.com', 'https://cloudflare.com', 'http')"
wrangler d1 execute worker-health-checks --command="Insert Into health_checks (`Name`, `Target`, `Type`, `Method`, `ExpectedCodes`, `ExpectedBodyContains`, `CustomHeaders`) values ('Free Errors Test', 'https://free-500.tylerobrien.dev', 'http', 'GET', '200', 'This page has returned a 500.', 'User-Agent: Cookie;Custom:Header')"
Fields:
Name = Friendly name for Grafana
Target = URL
Type = Currently, only http (not used)
Method = HTTP Method, default GET
ExpectedCode = Accepted HTTP Codes, defaults to 200, 201, 202, 203, 204, 205, 206, 207, 208, 226, 300, 301, 302, 303, 304, 305, 306, 307, 308
ExpectedBodyContains = Case-sensitive, the worker will download the entire response as text and check if it includes this.
CustomHeaders = Custom Request Headers.
wrangler d1 execute worker-health-checks --command='Delete from health_checks where 1=1'
In this repo is a default Grafana dashboard for this. Set up AE following this guide: https://developers.cloudflare.com/analytics/analytics-engine/grafana/
Then you should be able to import the WorkerHealthChecks.json dashboard. This dashboard uses & works with sampling.
Once you wrangler publish the project, the cron should automatically run it once per minute. Keep in mind there are sub-request limits, https://developers.cloudflare.com/workers/platform/limits/, 50/requests for bundled. This also currently is no timeout function or property, although they may be one in the future using AbortSignal.
Note that when you publish a new cron, it can take ~5-10 minutes for Cloudflare to start scheduling it. Patience is a virtue!

