Trupti2502 / Stock-Analysis

This project is basically for collecting enormous data and analyzing it. It includes live streaming of data from FOREX trading API and Electric Vehicle stocks API. The data is fetched and processed using Kafka Streaming and Spark streaming.Throughout this project stocks of Forex data and Electric Vehicle parts making companies data were analyzed and business use case is implemented. The analyzed data is then visualized by plotting different graphs using python libraries.

Geek Repo:Geek Repo

Github PK Tool:Github PK Tool

STOCK DATA STREAMING AND ANALYSIS

DESCRIPTION

  • This project is basically for collecting enormous data and analysing it.
  • It includes live streaming of data from FOREX ( Foreign Exchange ) trading API and Electric Vehicle stocks API.
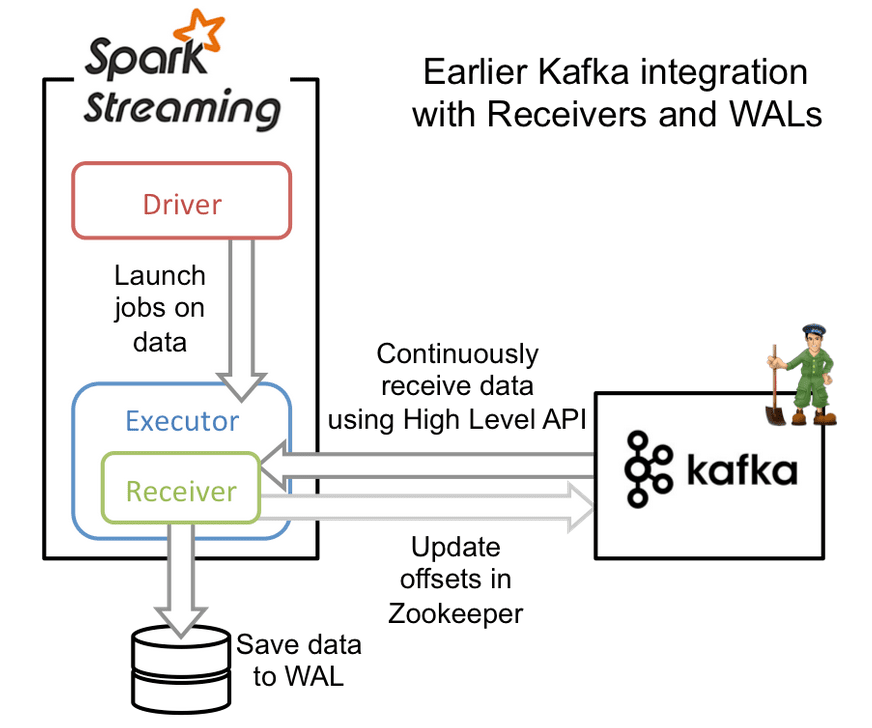
  • The data is fetched and processed using Kafka Streaming and Spark streaming.
  • Throughout this project stocks of Forex data and Electric Vehicle parts making companies data were analyzed and business use case is implemented.
  • The analyzed data is then visualized by plotting different graphs using python libraries.

STREAMING TOOLS

  • Websocket,
  • Requests library,
  • Pandas datareader library,
  • Netcat,
  • API : Tiingo API,Alpha Vantage API.
  • data visualization tool: matplotlib,Seaborn

TECHNOLOGIES USED:

  • Spark
  • Kafka
  • Pyspark

Project Flow

alt text

ROLES AND RESPONSIBILITIES

  • DATA STREAMING AND SPARK submit job- Rajib’s team
  • Use cases- Eshwar’s team
  • Visualization- Karan’s team
  • EV stock use case-Kareem's team
  • Deployment-Trupti’s Team

This project uses the following license: MIT License
About

This project is basically for collecting enormous data and analyzing it. It includes live streaming of data from FOREX trading API and Electric Vehicle stocks API. The data is fetched and processed using Kafka Streaming and Spark streaming.Throughout this project stocks of Forex data and Electric Vehicle parts making companies data were analyzed and business use case is implemented. The analyzed data is then visualized by plotting different graphs using python libraries.

License:MIT License


Languages

Language:Jupyter Notebook 96.9%Language:Python 3.1%