


G-Code wrapper to generate G-Code for 2D plotter art. Add paths, points, lines, circles, and more and get G-Code instructions to send to your 2D Plotter or converted 3D Printer.
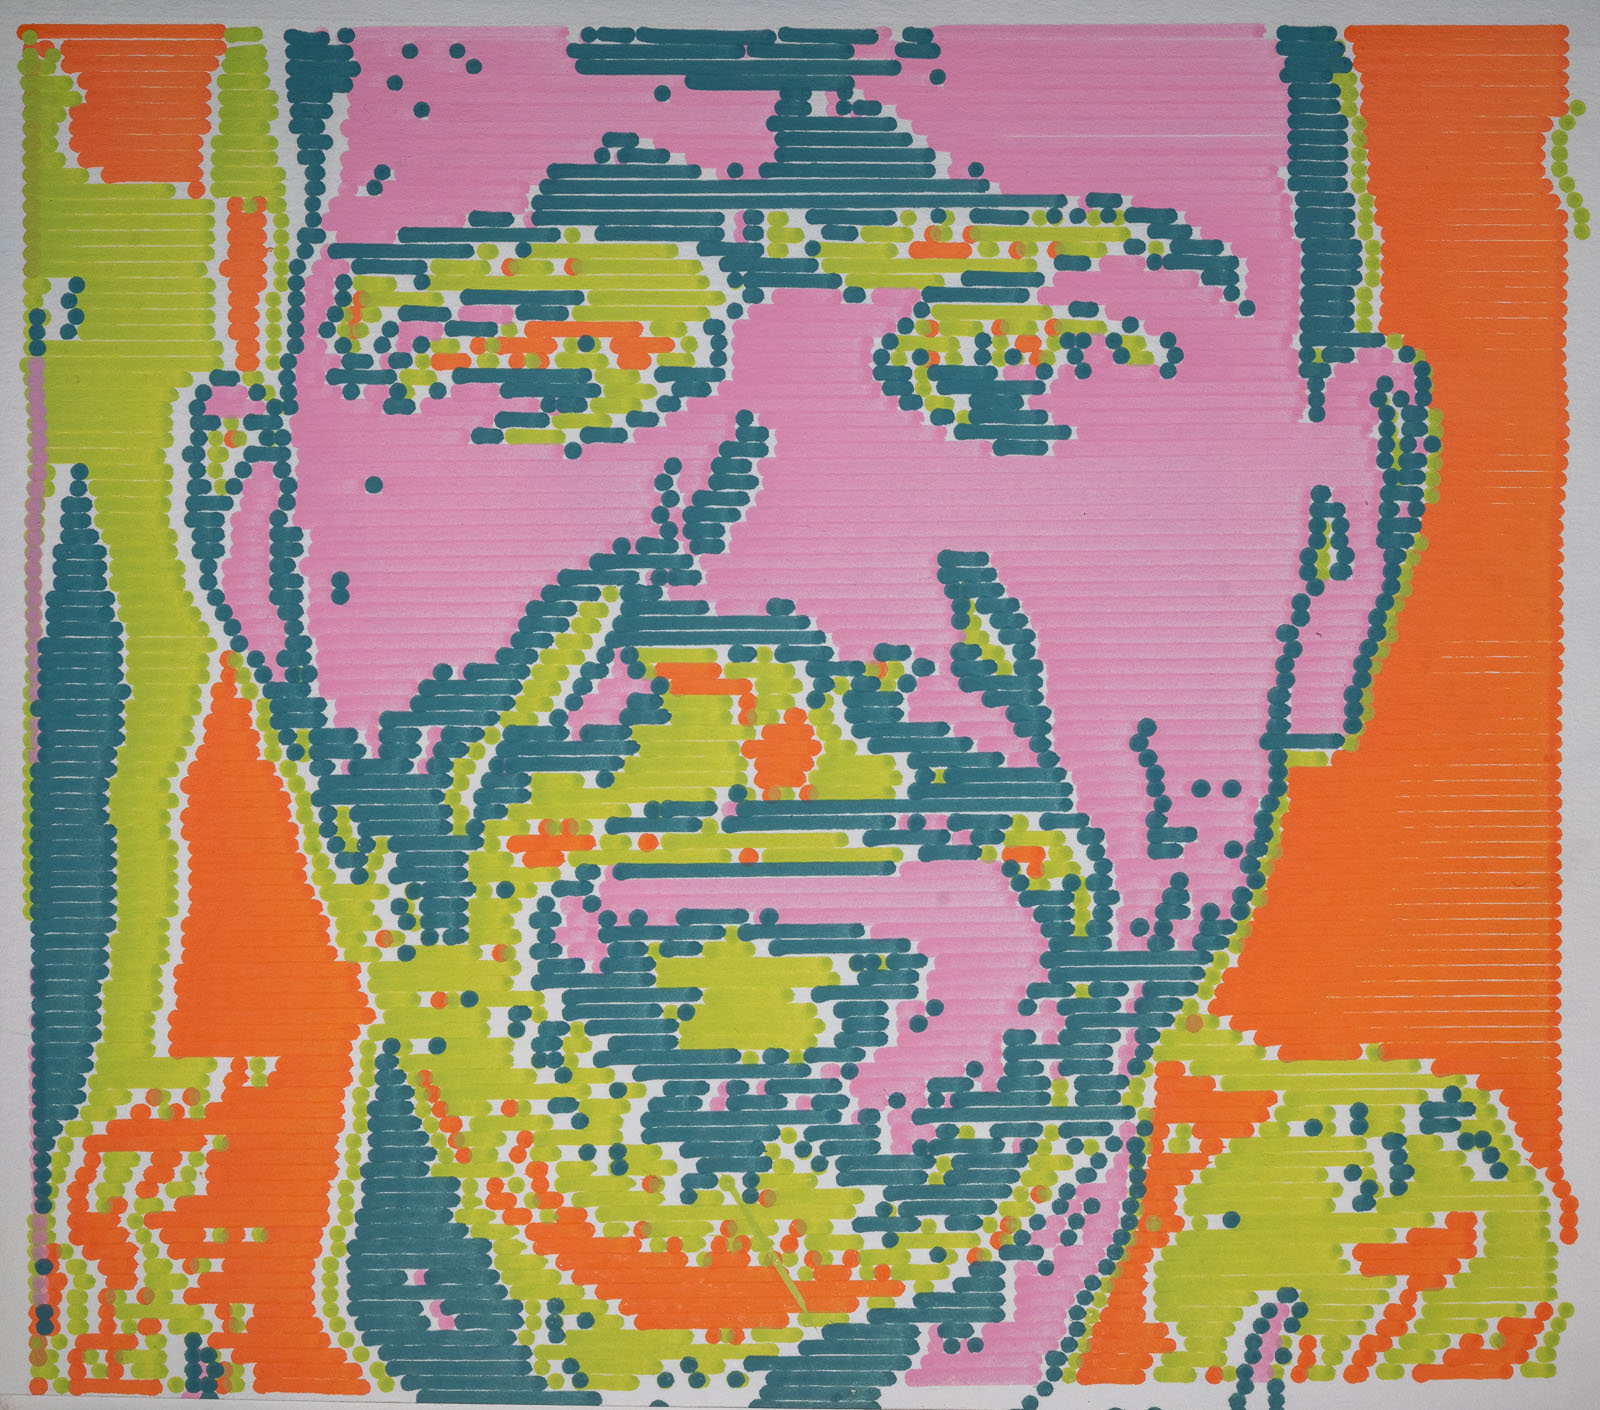
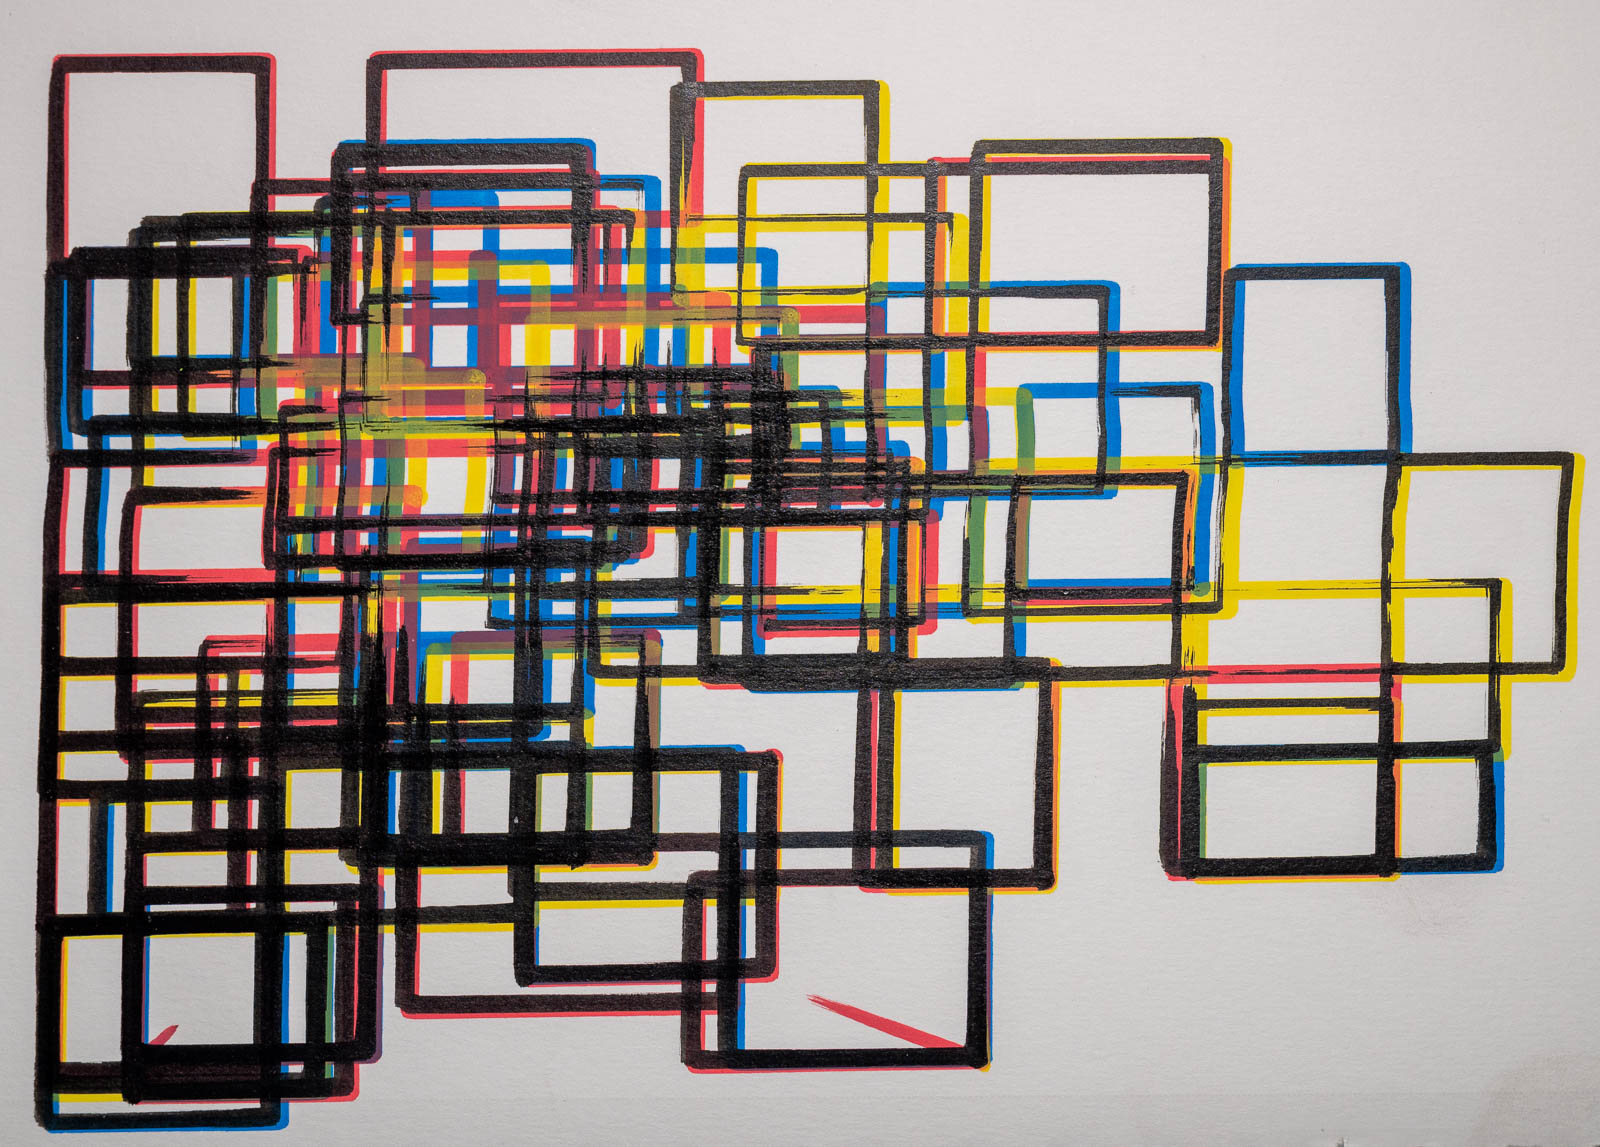
Here are a few examples of what's been made with this library.
For full documentation, check out the website.
Below is a quick start example to get you up and running.
from gcode2dplotterart import Plotter2D # Change to `Plotter3D` if using a converted 3D printer.

plotter = Plotter2D(
    # Specify plotter dimensions
    x_min=0,
    x_max=200,
    y_min=0,
    y_max=200,
    feed_rate=10000,

    # Specify outputs
    title="Plotter2D Quickstart",
    output_directory="./output",

    # How to handle attempting to plot points outside plotter dimensions
    handle_out_of_bounds="Warning",
)

# Setup a layer per plotting instrument used
black_pen_layer = "black_pen_layer"
blue_marker_layer = "blue_marker_layer"
green_marker_layer = "green_marker_layer"

# Create the layers
plotter.add_layer(black_pen_layer, color="black", line_width=1.0)
plotter.add_layer(blue_marker_layer, color="blue", line_width=4.0)
plotter.add_layer(green_marker_layer, color="#027F00", line_width=4.0)

# Add some dots, lines, shapes, and paths.
plotter.layers[black_pen_layer].add_rectangle(
    x_start=10, y_start=15, x_end=40, y_end=50
)
plotter.layers[black_pen_layer].add_point(x=30, y=40)
plotter.layers[blue_marker_layer].add_circle(x_center=10, y_center=30, radius=10)
plotter.layers[blue_marker_layer].add_rectangle(x_start=50, y_start=50, x_end=75, y_end=75)
plotter.layers[green_marker_layer].add_path([(10, 10), (20, 25), (30, 15), (1, 100)])
plotter.layers[green_marker_layer].add_line(x_start=70, y_start=80, x_end=70, y_end=15)

# Generate a graphical preview to get a rough idea of what will be plotted.
plotter.preview()

# Output creation to G-Code files to be used in plotting.
plotter.save()Join the Discord Channel.
Check out the latest changes here.