Picasso JS
TODO:
- Replace
d3-voronoiwithd3-delaunay
Background
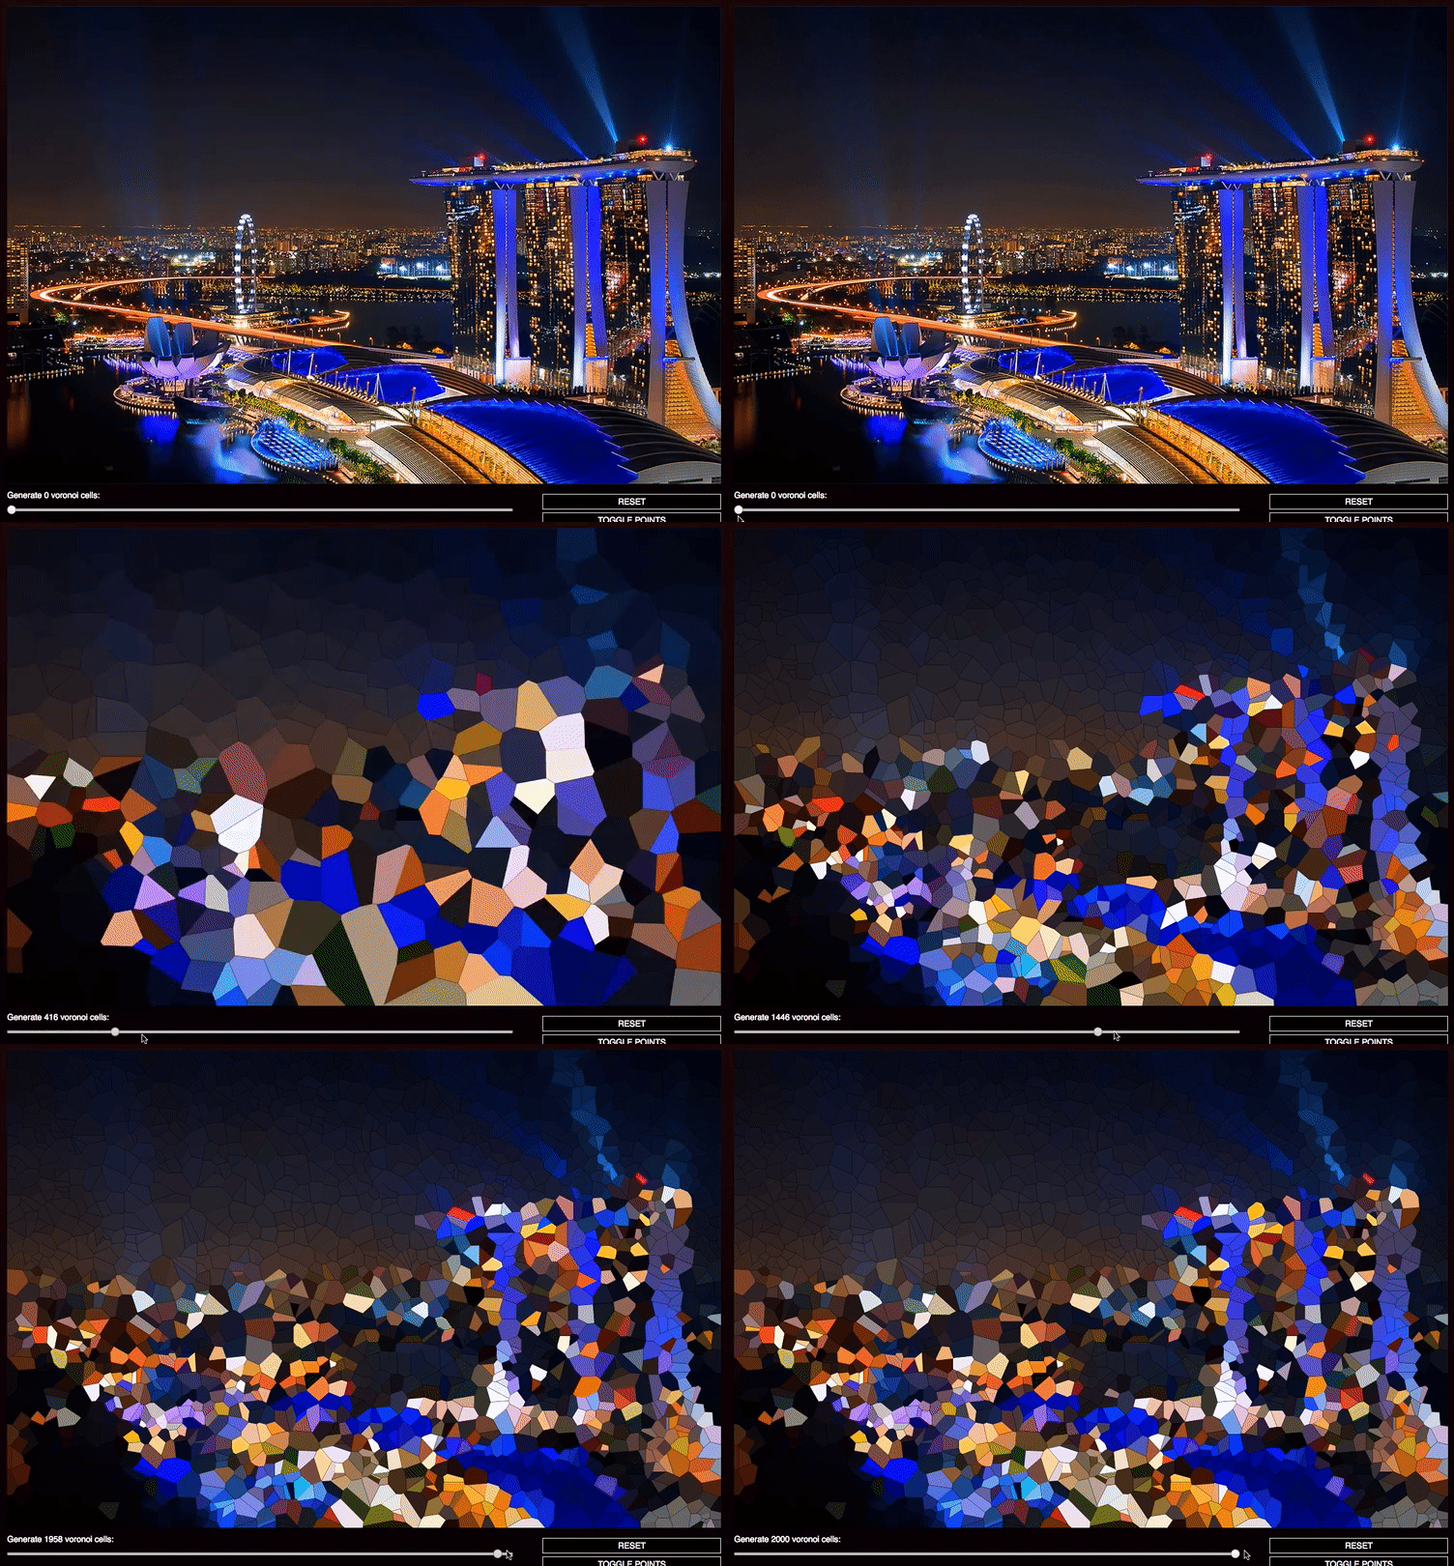
A Voronoi Diagram is a figure in which cells are created around a number of seed points such that all points within the cell are closest to its seed point.
PicassoJS uses D3.js, Canvas, and JavaScript to create a Voronoi Diagram in which polygons are colored based on the underlying image.
How it works
Performance
Because Canvas' getImageData() method only extracts RGBA data for rectangles with sides parallel to the X and Y axis, collecting pixel colors for each voronoi cell is inefficient. The solution is to store image data when the photo is initially loaded and querying the cached RGBA data when rendering each cell.
replaceImage(img, ctx) {
  this.clearCanvas(ctx);
  const newImage = new Image();
  newImage.src = img;

  newImage.onload = (e) => {
    this.image = newImage;
    this.renderImage(ctx);
    this.calculateColorMap(ctx);
  }
}
Using 'Accurate' rendering settings, each voronoi cell's fill color is calculated by taking the average color of each pixel contained within the polygon. This essentially iterates through every pixel in the 700px x 600px canvas (over 420,000 calculations), leading to less-than-ideal runtimes.
//this is repeated for R, G, and B values to find the average color within the cell
sumColorsBoundedByPolygon(polygon, bounds, polyColors) {
  let boundedColorsSum = 0;
  let boundedCount = 0;
  polyColors.forEach((colorRow, rowIdxY) => {
    colorRow.forEach((colorEl, elIdxX) => {
      if (d3poly.polygonContains(polygon, [bounds.xmin + elIdxX, bounds.ymin + rowIdxY])) {
        boundedColorsSum += colorEl;
        boundedCount++;
      }
    });
  });
  return Math.floor(boundedColorsSum/boundedCount);
}
Using 'Quick' rendering settings, the cell's fill color is determined by the single pixel at the center of each Voronoi. This is extremely fast, with only (n = voronoi cell count) calculations. Performance can be compared on the live demo.
quickColors(polygon, ctx) {
  let bounds = this.squareBounds(polygon);
  let yCenter = Math.round((bounds.ymin + bounds.ymax)/2);
  let xCenter = Math.round((bounds.xmin + bounds.xmax)/2);

  let quickReds = this.colorMap.reds[yCenter][xCenter];
  // ... greens and blues are also calculated here...

  return d3.rgb(quickReds, quickGreens, quickBlues);
}
Tech
-
jQuery - takes care of the user interface and interactions
-
HTML5 Canvas - used for drawing lines, shading polygons.
Imagelibrary is used to place images on the canvas and extract meaningful color data -
D3.js - data manipulation library to perform Voronoi cell calculations
