
ImpactViz - Open Impact Visualizer enables the display of open metrics on article pages
Open scientometric indicators enable a comprehensible evaluation of science. The tool "ImpactViz - Open Impact Visualizer" (Github), developed in the project ROSI (Reference Implementation for Open Scientometric Indicators), enables the adaptable presentation of open scientometric information from scientific publications.
ImpactViz aims to visualize the impact of publications. Users can retrieve information by entering the persistent identifier of a publication (doi). Data is only retrieved from open data sources, that supply an open interface.

- recognition of articles with persisten identifier (doi)
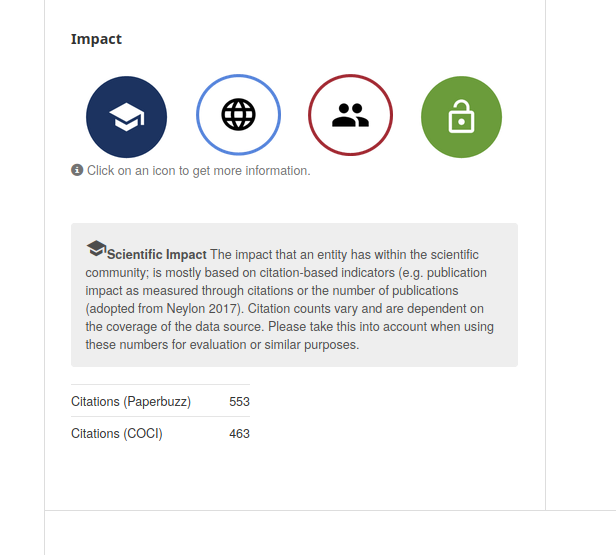
- display overview of the impact in the four concepts: scientific impact, societal impact, community impact, openness
- display all indicators in detailed view at single tabs (for each concept)
- display timelines based on data from PaperBuzz (using paperbuzzviz)
- display list of available indicators
- addition of new indicators (password protected)
- selection between existing customization in a dropdown
- addition of new customizations: selection of the indicators, that will be displayed
ImpactViz has the follwing settings that can be passed via JavaScript (see example below):
- customizeFile - string
- indicatorsFile - string
- entitiesPath - string
- imgPath - string
- title - boolean

The tool bases on existing JavaScript libraries for some of the core functionalities:
- jQuery - basic javascript library
- alpacajs - js form generator library
- paperbuzzviz - js library to vizualize PaperBuzz metrics
- chartjs - js library to vizualize charts
Data sources are accessed via APIs and data is retrieved in json format. All internal data is also stored in json format. The lists of all available indicators and all customizations are being managed reusing a previously implemented registry application.
Current and future developments can be traced in the ROSI prototype project
Contact us at rosi.project(at)tib.eu to get involved.
This project is licensed under the MIT License
- clone this repo (with submodules)
- run npm install
You can easily include ImpactViz in your own tool. You need to
- add the needed libraries to your header. (You can use the included libraries or you can get the code via CDN. See the example.html for the second approach.)
  <!-- dependencies (jquery, handlebars and bootstrap) -->
  <script type="text/javascript" src="lib/jquery-3.5.1.min.js"></script>
  <script type="text/javascript" src="lib/handlebars.min.js"></script>
  <link type="text/css" href="lib/bootstrap.min.css" rel="stylesheet"/>
  <script type="text/javascript" src="lib/bootstrap.min.js"></script>

  <!-- alpaca -->
  <link type="text/css" href="lib/alpaca.min.css" rel="stylesheet"/>
  <script type="text/javascript" src="lib/alpaca.min.js"></script>

  <!-- google icons -->
  <link href="lib/googleIcons.css" rel="stylesheet">

  <!-- paperbuzzviz and d3js-->
  <script type="text/javascript" src="lib/d3.v4.min.js"></script> <!-- TODO get via npm or git submodule -->
  <script type="text/javascript" src="lib/paperbuzzviz/example/d3-tip.js"></script>
  <script type="text/javascript" src="lib/paperbuzzviz/paperbuzzviz.js"></script>
  <link rel="stylesheet" type="text/css" href="lib/paperbuzzviz/assets/css/paperbuzzviz.css" />
- add a div the the html structure of your page:
  <!-- overview -->
  <div id="impactviz-overview"></div>
  <!-- details -->
  <div id="impactviz-details"></div>
- and activate the script in JavaScript:
    <script type="text/javascript">
      var identifier = "10.1038/520429a"; // get the identifier somewhere
      impact = new ImpactViz(identifier);
      impact.initViz();
    </script>
See also example.html.
- OJS (work in progress) https://github.com/lilients/openImpact/
- VIVO (work in progress)