The framework is meant to help quants developing and testing innovative algorithmic trading strategies in the financial trading sector in a completely open-source environment.
- JRE 11: Java runtime version 11 is needed for using the library.
- JDK 11: The Java JDK 11 must be installed.

Data Flow
The user can access the map requiring to create a dataset. This latter contains a set of time series relevant for a specific analysis. The dataset can be built either directly requiring the data through the APIs of some data providers or through an intermediate database (How to set up the database). The database proves particularly useful when the same data requests are repeated over time. Indeed, the external data providers usually charge the user based on the number of requests in a certain amount of time. Using the intermediate database requires a further step, namely, download the necessary data into the database before making them available to the dataset builder.
List<String> stocksList = new ArrayList<>();

stocksList.add("AMZN");
stocksList.add("AAPL");
stocksList.add("FB");

UpdateFromAlphaVantageStocksEOD upf = new UpdateFromAlphaVantageStocksEOD(5, 500, 5);
upf.run(stocksList, "NASDAQ_EOD");
The code above is just an example of how to update the database with the end of day (EOD) data of Amazon, Apple, and Facebook using the external data provider AlphaVantage. For more information go to Dataset Tutorial
Controller.run();

SimpleDateFormat sdf = new SimpleDateFormat("yyyy-MM-dd HH:mm:ss");
Instant startInstant = (sdf.parse("2020-01-01 00:00:00")).toInstant();
Instant endInstant = null;

List<TimeSeriesRequestIdI> listQueries = new ArrayList<>();
listQueries.add(new TimeSeriesRequestIdInfluxdb.Builder(new TimeSeriesIdImpl.Builder("AMZN")
   .startInstant(startInstant)
   .endInstant(endInstant)
   .interval("1d")
   .build())
  .build());


 DatasetI dts = Controller.getDatasetFactory().create(listQueries);
Another example, in this case, a new query for the database is built and a new dataset containing the output of the query is created. For more information go to Dataset Tutorial

Triple SMA
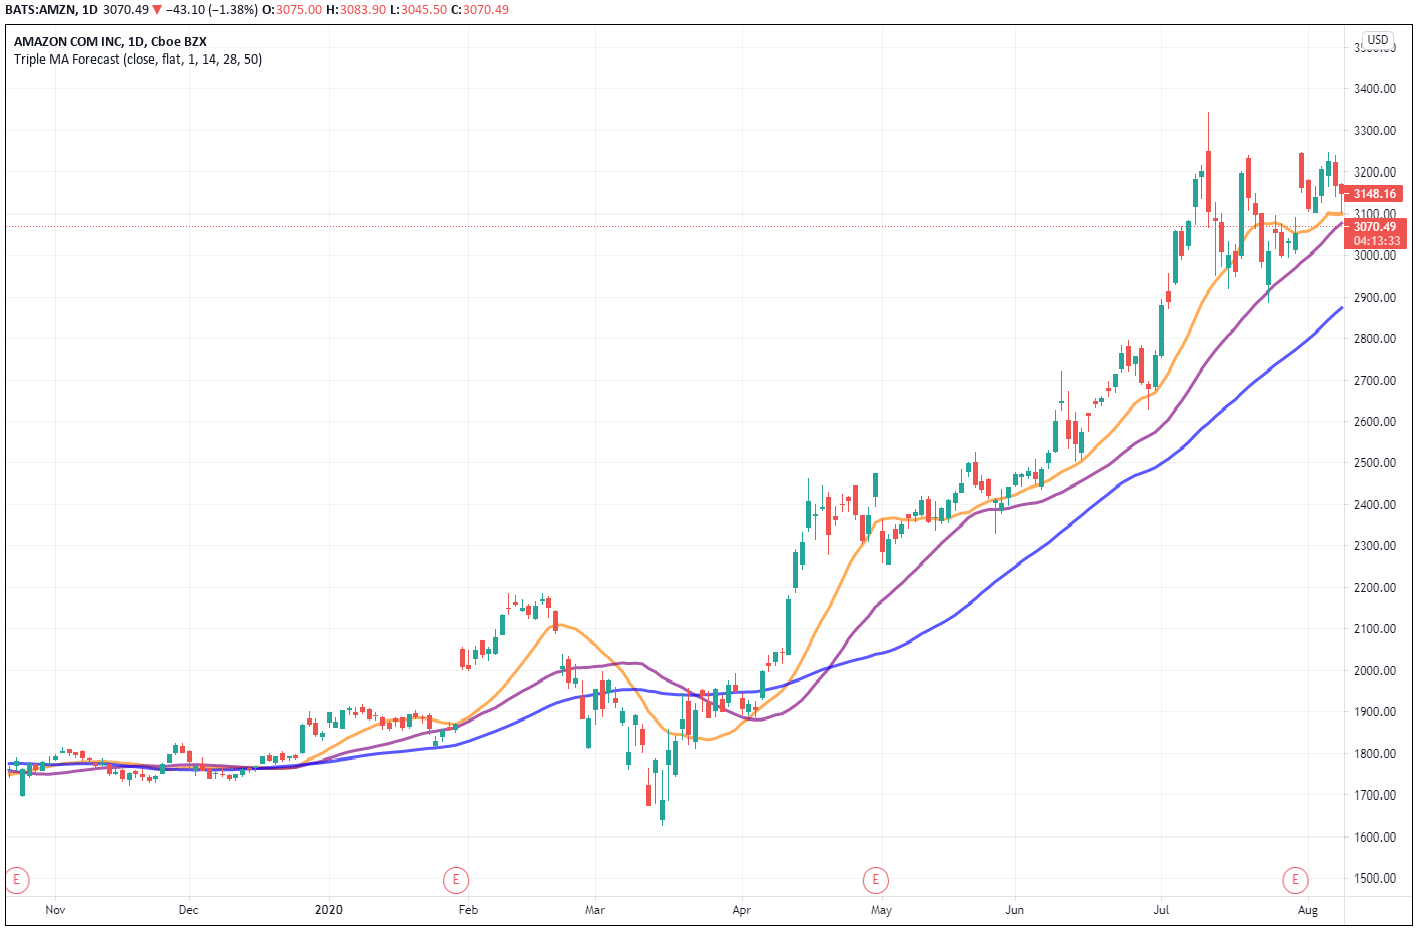
A well known and quite common strategy is the triple moving average trading strategy. The method involves using a long term MA, a medium term MA and a short term MA. The moving averages can be exponential or simple. A particular crossing sequence of the 3 MA triggers long/short positions opening. The position is closed based on a Trailing Stop Loss and Take Profit. Below is a simple simulation of this strategy applied to Amazon (from 2020-01-01 till 2020-12-31, 1d period), using 3 simple moving averages.
@Test
void testTripleMovingAverageCrossoverStrategy() throws Exception {
	Controller.run();

	SimpleDateFormat sdf = new SimpleDateFormat("yyyy-MM-dd HH:mm:ss");
	Instant startInstant = (sdf.parse("2020-01-01 00:00:00")).toInstant();
	Instant endInstant = (sdf.parse("2020-12-31 00:00:00")).toInstant();;

	List<TimeSeriesRequestIdI> listQueries = new ArrayList<>();
	listQueries.add(new TimeSeriesRequestIdInfluxdb.Builder(new TimeSeriesIdImpl.Builder("AMZN")
			 .startInstant(startInstant)
			 .endInstant(endInstant)
			 .interval("1d")
			 .build())
			.build());

	 DatasetI dts = Controller.getDatasetFactory().create(listQueries);

	 TripleSimpleMovingAverageCrossoverStrategy tsmac = new TripleSimpleMovingAverageCrossoverStrategy.Builder(
			  dts.getTimeSeries(new TimeSeriesIdImpl.Builder("AMZN")
			 .startInstant(startInstant)
			 .endInstant(endInstant)
			 .interval("1d")
			 .build()))
			 .source("close")
			 .lengthShortTermMA(5)
			 .lengthMediumTermMA(10)
			 .lengthLongTermMA(20)
			 .build();
	 tsmac.run();

	 System.out.println(tsmac.getPerformanceReport());
}
As you can see in the code, the first step is to add a query with the necessary information to a list used in a call to the database to generate a Dataset object. Next, the strategy is built by passing the time series contained in the dataset and a set of parameters. The strategy is simulated on the time series using the run() method. Each strategy inherting the abstract class StrategyAbstract is evaluated by default using a set of indicators (see table below).
| Name | Value |
|---|---|
| Tot. Net Profit | -3721.1 |
| Gross Profit | 30241.9 |
| Gross Loss | -33962 |
| Profit Factor | -0.8904 |
| Tot. Num. Of Trades | 11 |
| Percet Profitable | 0 |
| Winning Trades | 4 |
| Losing Trades | 7 |
| Even Trades | 0 |
| Avg. Trade Net Profit | -338.2 |
| Avg. Winning Trade | 7560.5 |
| Avg. Losing Trade | -4851.8 |
| Ratio Avg. Win Avg. Loss | -1.5 |
| Largest Winnig Trade | 12971 |
| Largest Losing Trade | -9924 |
| Max. Consecutive Winning Trades | 1 |
| Max. Consecutive Losing Trades | 3 |
| ... | ... |
This is just a simple example. Indeed, the strategy cannot be only tested on a single set of parameters, but also optimized, i.e., the most robust set of parameters must be selected. Optimization has many pitfalls. There are many ways in which it can be done incorrectly. This is very dangerous and can lead to wrong conclusions (an example for all is the well known overfitting).

P&L optimization
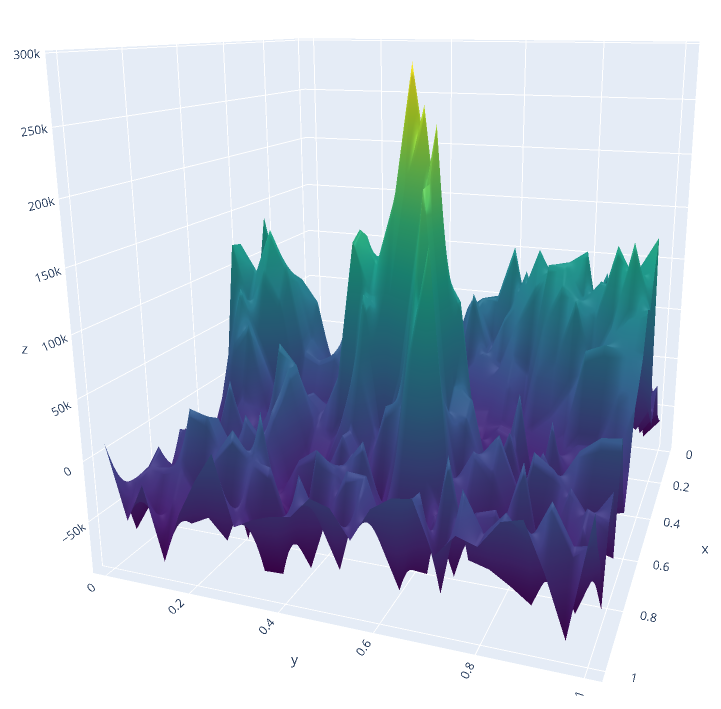
The figure above shows the P&L of a strategy by varying two of its parameters. As you can notice, the objective function presents multiple feasible points in the domain space that correspond to sub-optimal values of the objective function.
Do you want to know more about strategies, how to implement your own, how to optimize them and a lot of other fancy things? Go to Strategies
[2] Trevor Hastie and Robert Tibshirani and Jerome Friedman. 2017. The Elements of Statistical Learning Data Mining, Inference, and Prediction.
[3] Ian Goodfellow and Yoshua Bengio and Aaron Courville. Deep Learning. Goodfellow-et-al-2016.
[4] Nishant Shukla. 2018. Machine Learning with TensorFlow.
[5] SS Rao. 2020. A course in Time Series Analysis.
[6] Cosma Rohilla Shalizi. Advanced Data Analysis from an Elementary Point of View.
