This project is to build an end-to-end data pipeline for visualizing flights data. Every day, many airlines are operating various flights. This project's aim is to visualize few pattners like:
- Which country holds most number of airlines (international plus domestic)
- Which airline operates frequently ?
I have selected Open Flights Data https://openflights.org/data.html from the recommended datasets page: https://github.com/DataTalksClub/data-engineering-zoomcamp/blob/main/week_7_project/datasets.md
- Copy data into data lake (GCP buckets)
- Clean data (Apache Airflow Tasks)
- Move data from the data lake to data warehouse (GCP buckets & setup BigQuery)
- Create a analytical report
THhe final dashboard should consists of atleast two widgets.
Python >= 3.8gcloud CLI
See requirements.txt for more requirements
First, create a virtual environment locally, using command:
python3 -m venv venvThen from terminal, activate the environment like this:
source venv/bin/activateOnce python environment is activated, run below command on terminal:
pip install --upgrade pip
pip install -r requirements.txt
Then one can launch a Jupyter server like this:
jupyter notebookThe applcation is split into two parts:
- Infrastructure
- Apache Airflow
We follow medallion architecture to generate gold tables from bronze and silver.
- Bronze -> Raw data
- Silver -> Cleansed & Transformed
- Gold -> Final tables for vaisualization
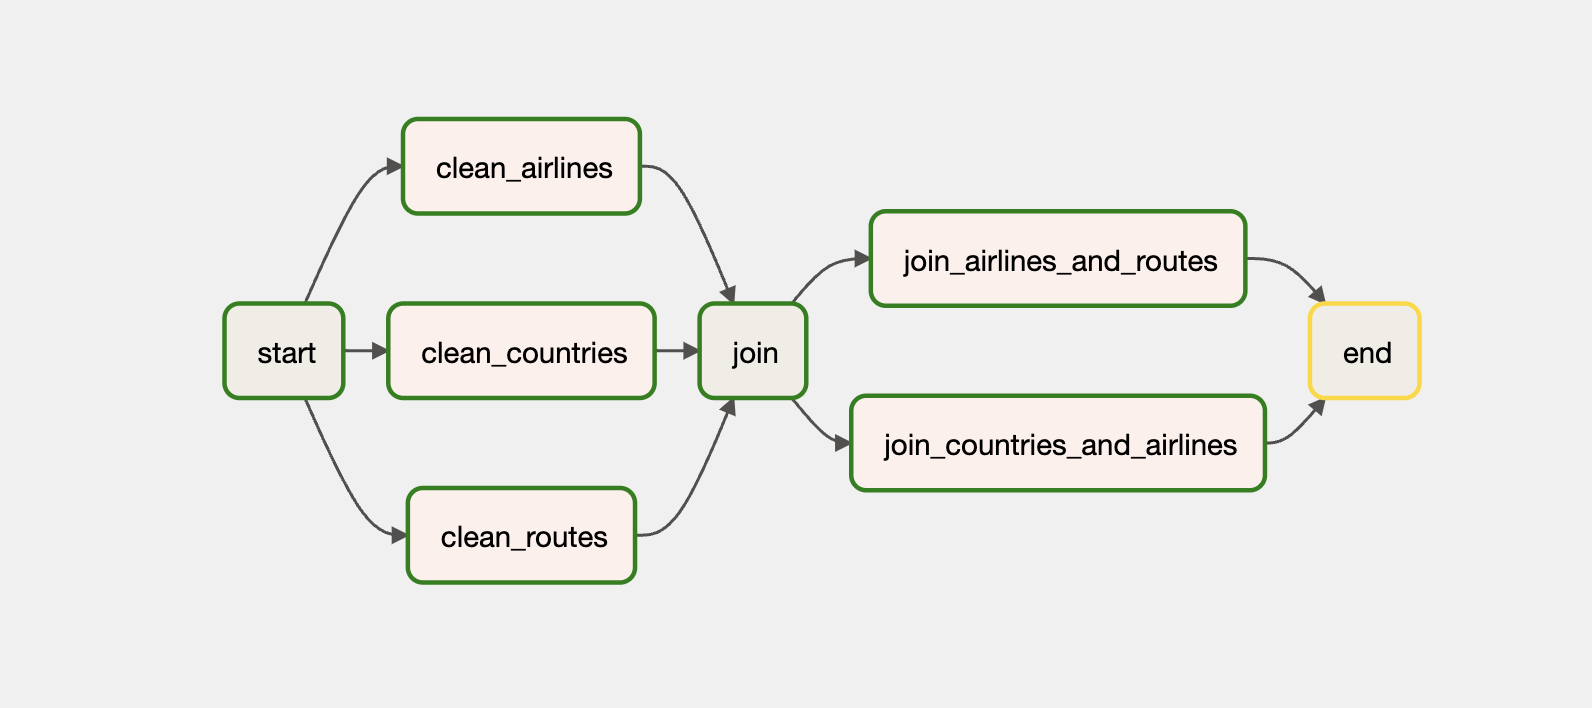
The initial data on Data lake (bucket) will be bronze. Airflow tasks will create silver tables out of these raw data. Then another set of tasks create gold tables by joining silver tables.
To spin up a GCP bucket for Datalake and BigQuery dataset for data warehouse, please run below command from the infrastructure directory.
Note: Please make sure you have setup the GCP project already, and configured gcloud CLI tool. Please see instructions to install gcloud on your platform here: https://cloud.google.com/sdk/docs/install
terraform init
terraform apply --auto-approve
This step creates following resources on GCP:
- Bigquery dataset & tables
- GCP Bucket for compose
- Composer environment (for Airflow tasks)
Once the infrastructure is setup and no errors from terraform, make sure to grant owner permissions to use Composer and GCP buckets.
The code for airflow DAGs is in dags/ directory. The file pipeline.py is responsible for defining airflow tasks. It has tasks for:
- Cleansing data
- Transforming data
- Gold table generation
Once gold tables are generated, one can visualize the data from Bigquery from here: https://console.cloud.google.com/bigquery?project=ue-assignment-375918
Note: This dataset and tables are created by Terraform already.
Now manually, create a report in looker studio: https://lookerstudio.google.com/u/0/navigation/reporting
Dashboard: https://lookerstudio.google.com/u/0/reporting/f7e9eb77-e1ef-4f07-a24d-4c9390f813d5/page/tEnnC
- Terraform state is currently using local backend
- Final reports are not created via Terraform
