Data is from the team rosters on SwimCloud.
- scrape a single page
- scrape a list of pages
- gather data in a single dataframe
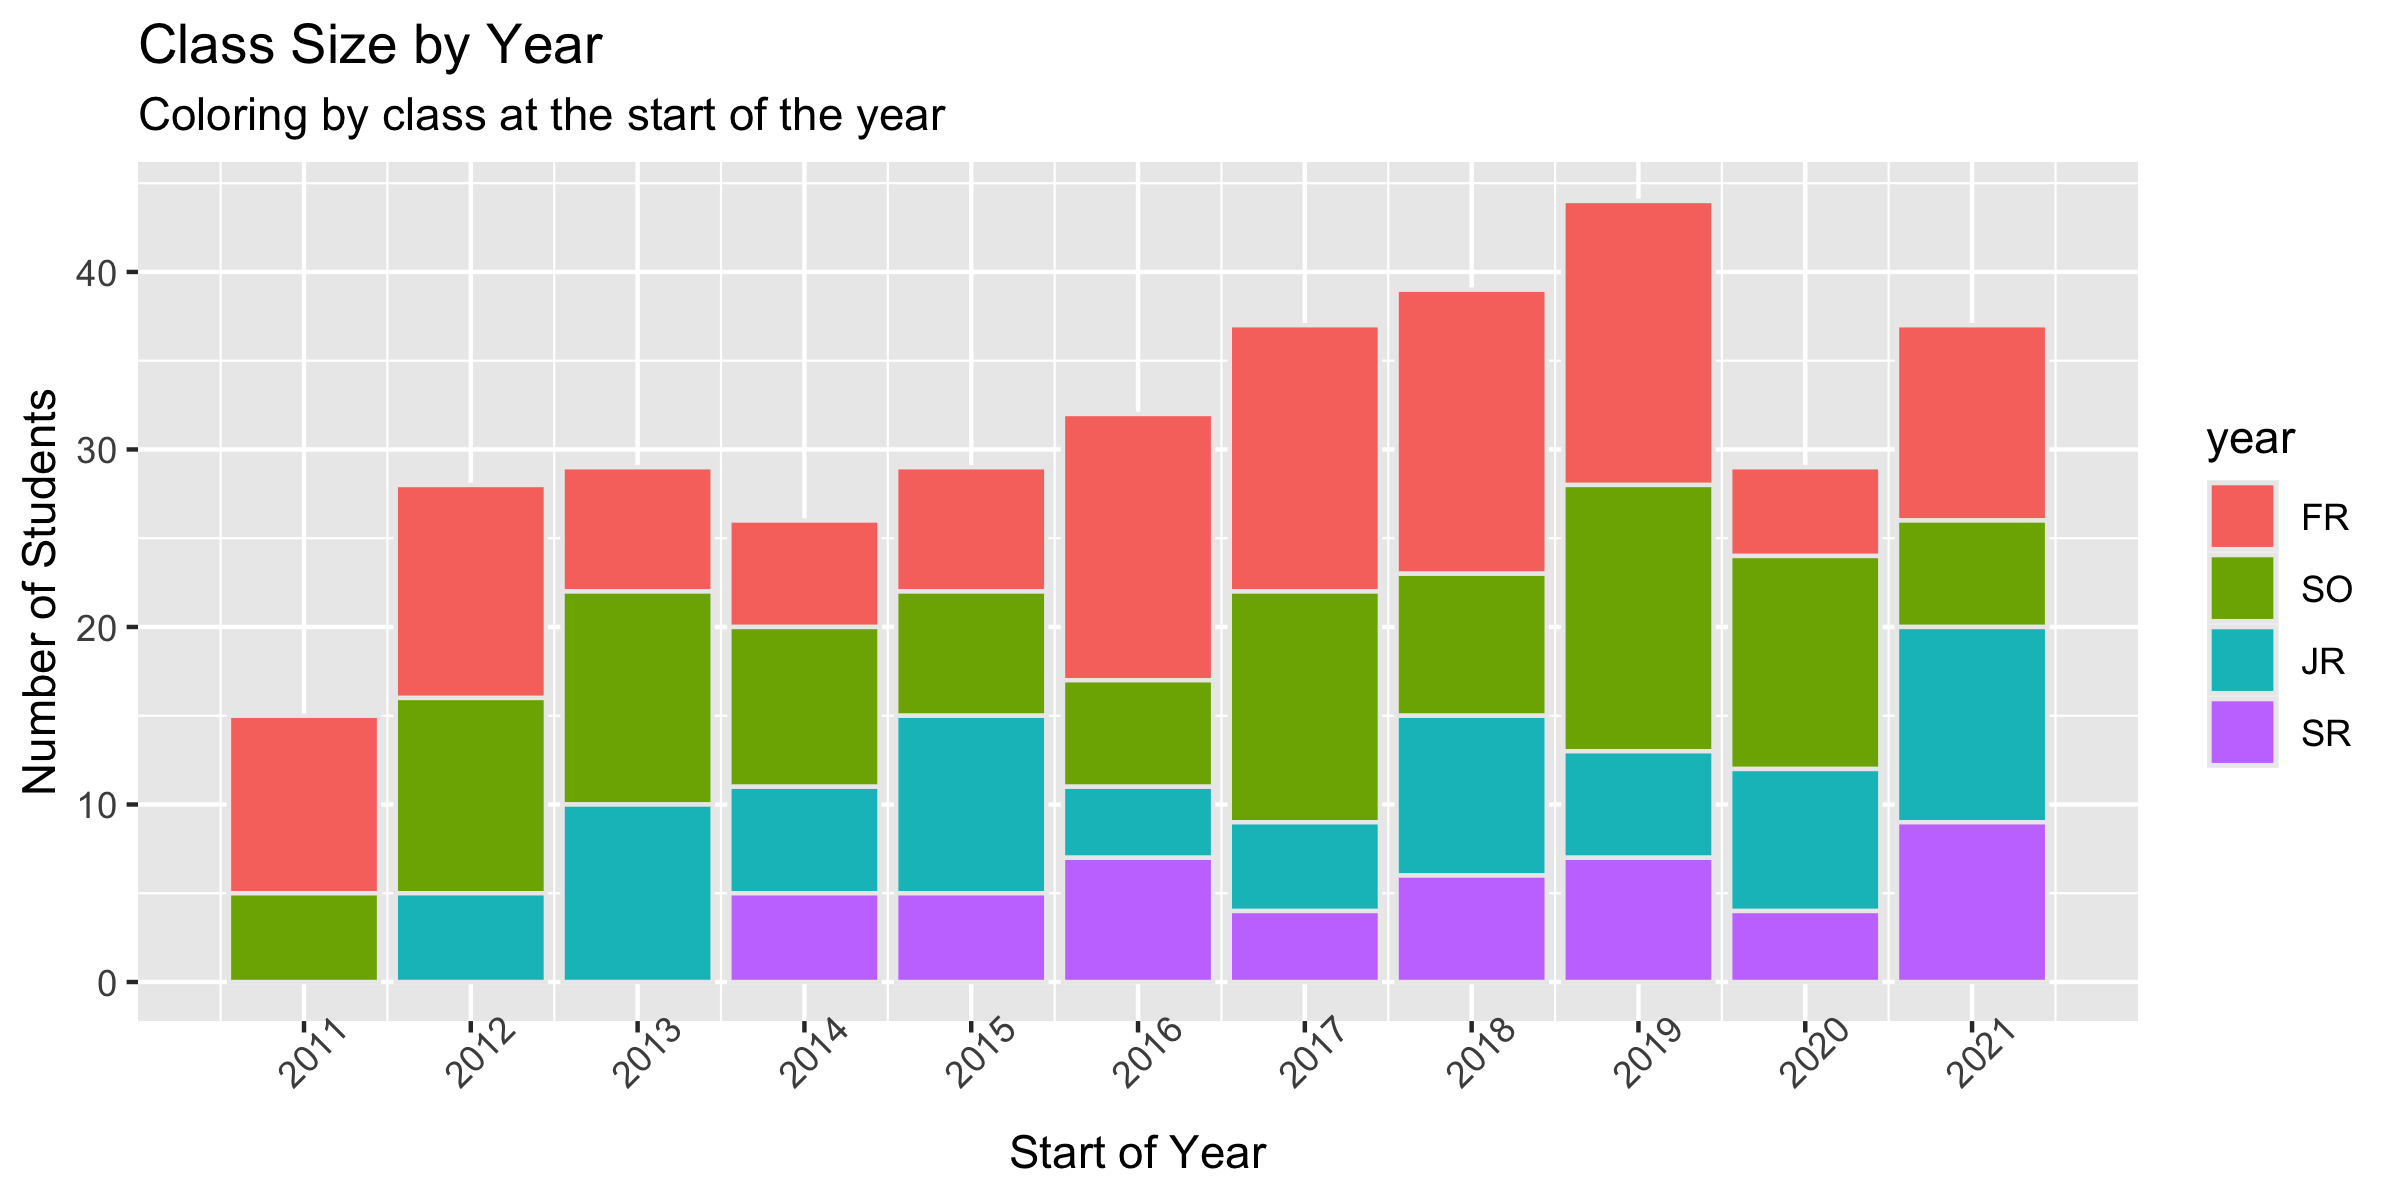
- plot class size per year colored by class
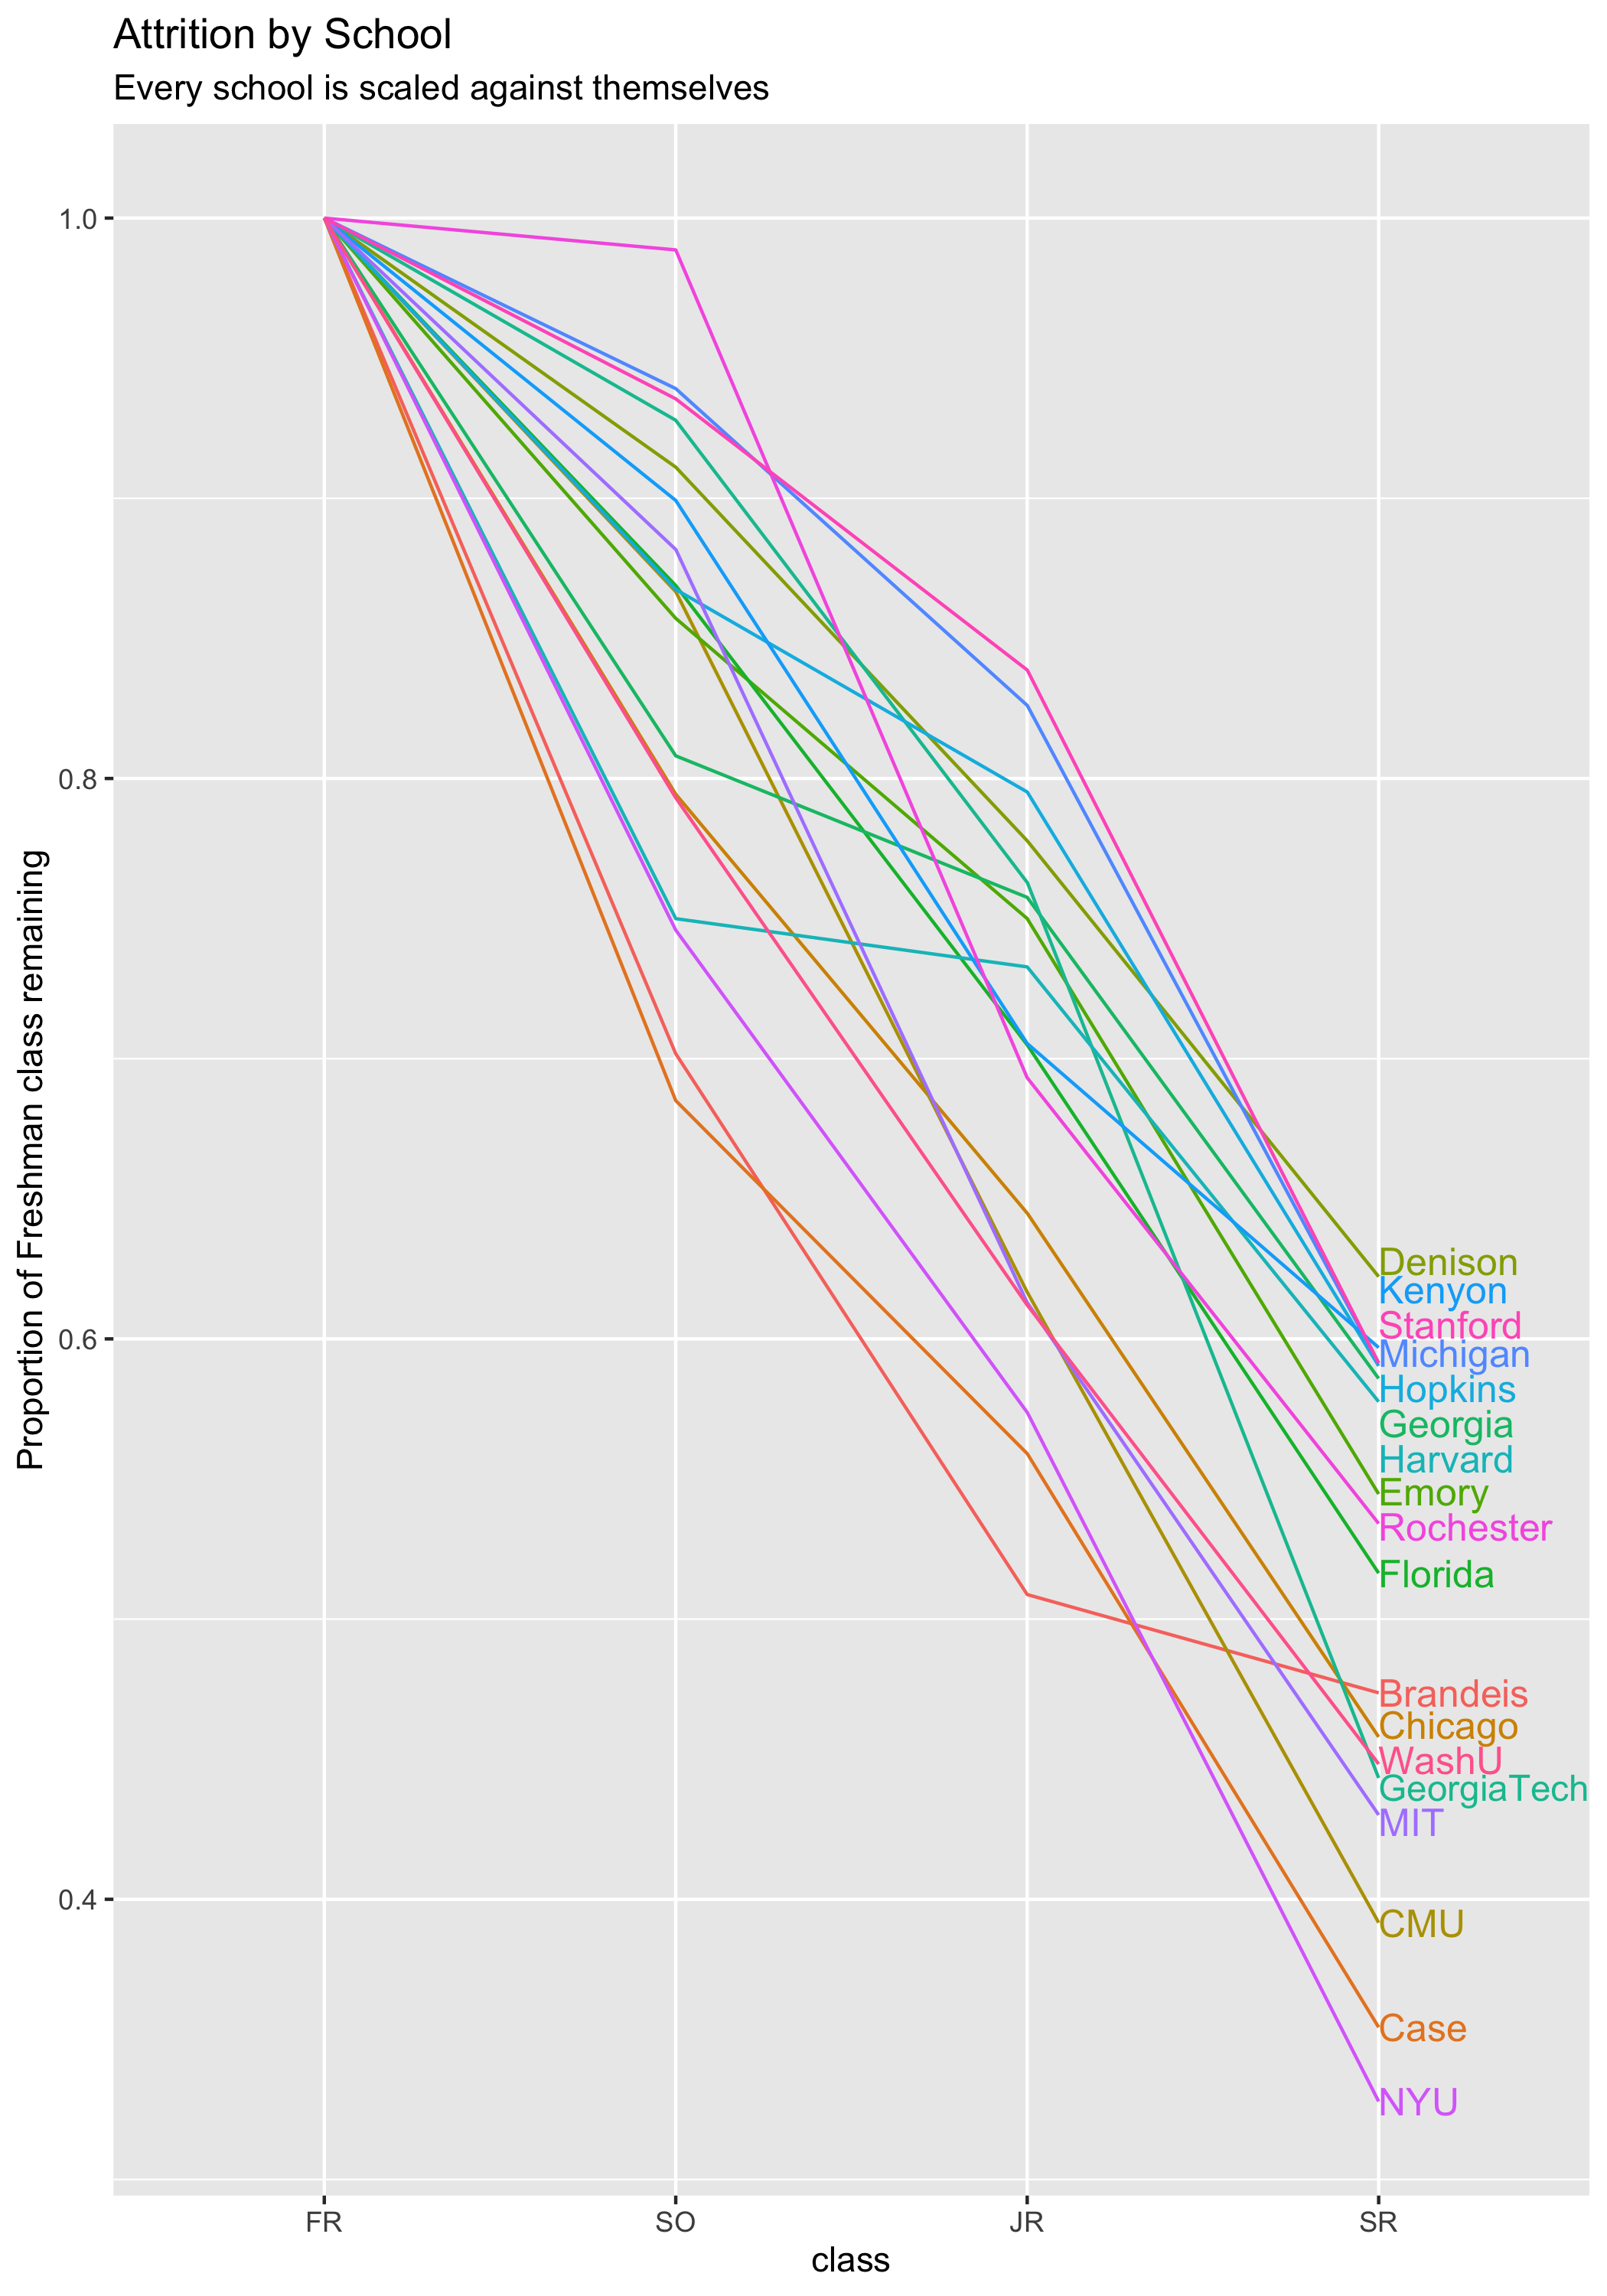
- plot attrition lines per class
Assumes you already have npm installed
npm ci
npm run scrape
This should fill up the data/ directory with files. This is the file tree for
just Carnegie Mellon, but the same file tree is reflective of every other school
$ tree data/
data
├── CMU
│   ├── 2011.csv
│   ├── 2012.csv
│   ├── 2013.csv
│   ├── 2014.csv
│   ├── 2015.csv
│   ├── 2016.csv
│   ├── 2017.csv
│   ├── 2018.csv
│   ├── 2019.csv
│   ├── 2020.csv
│ ├── 2021.csvAssume you already have R installed
npm run plot
Will generate the plots in the plots directory:
$ tree plots/
plots
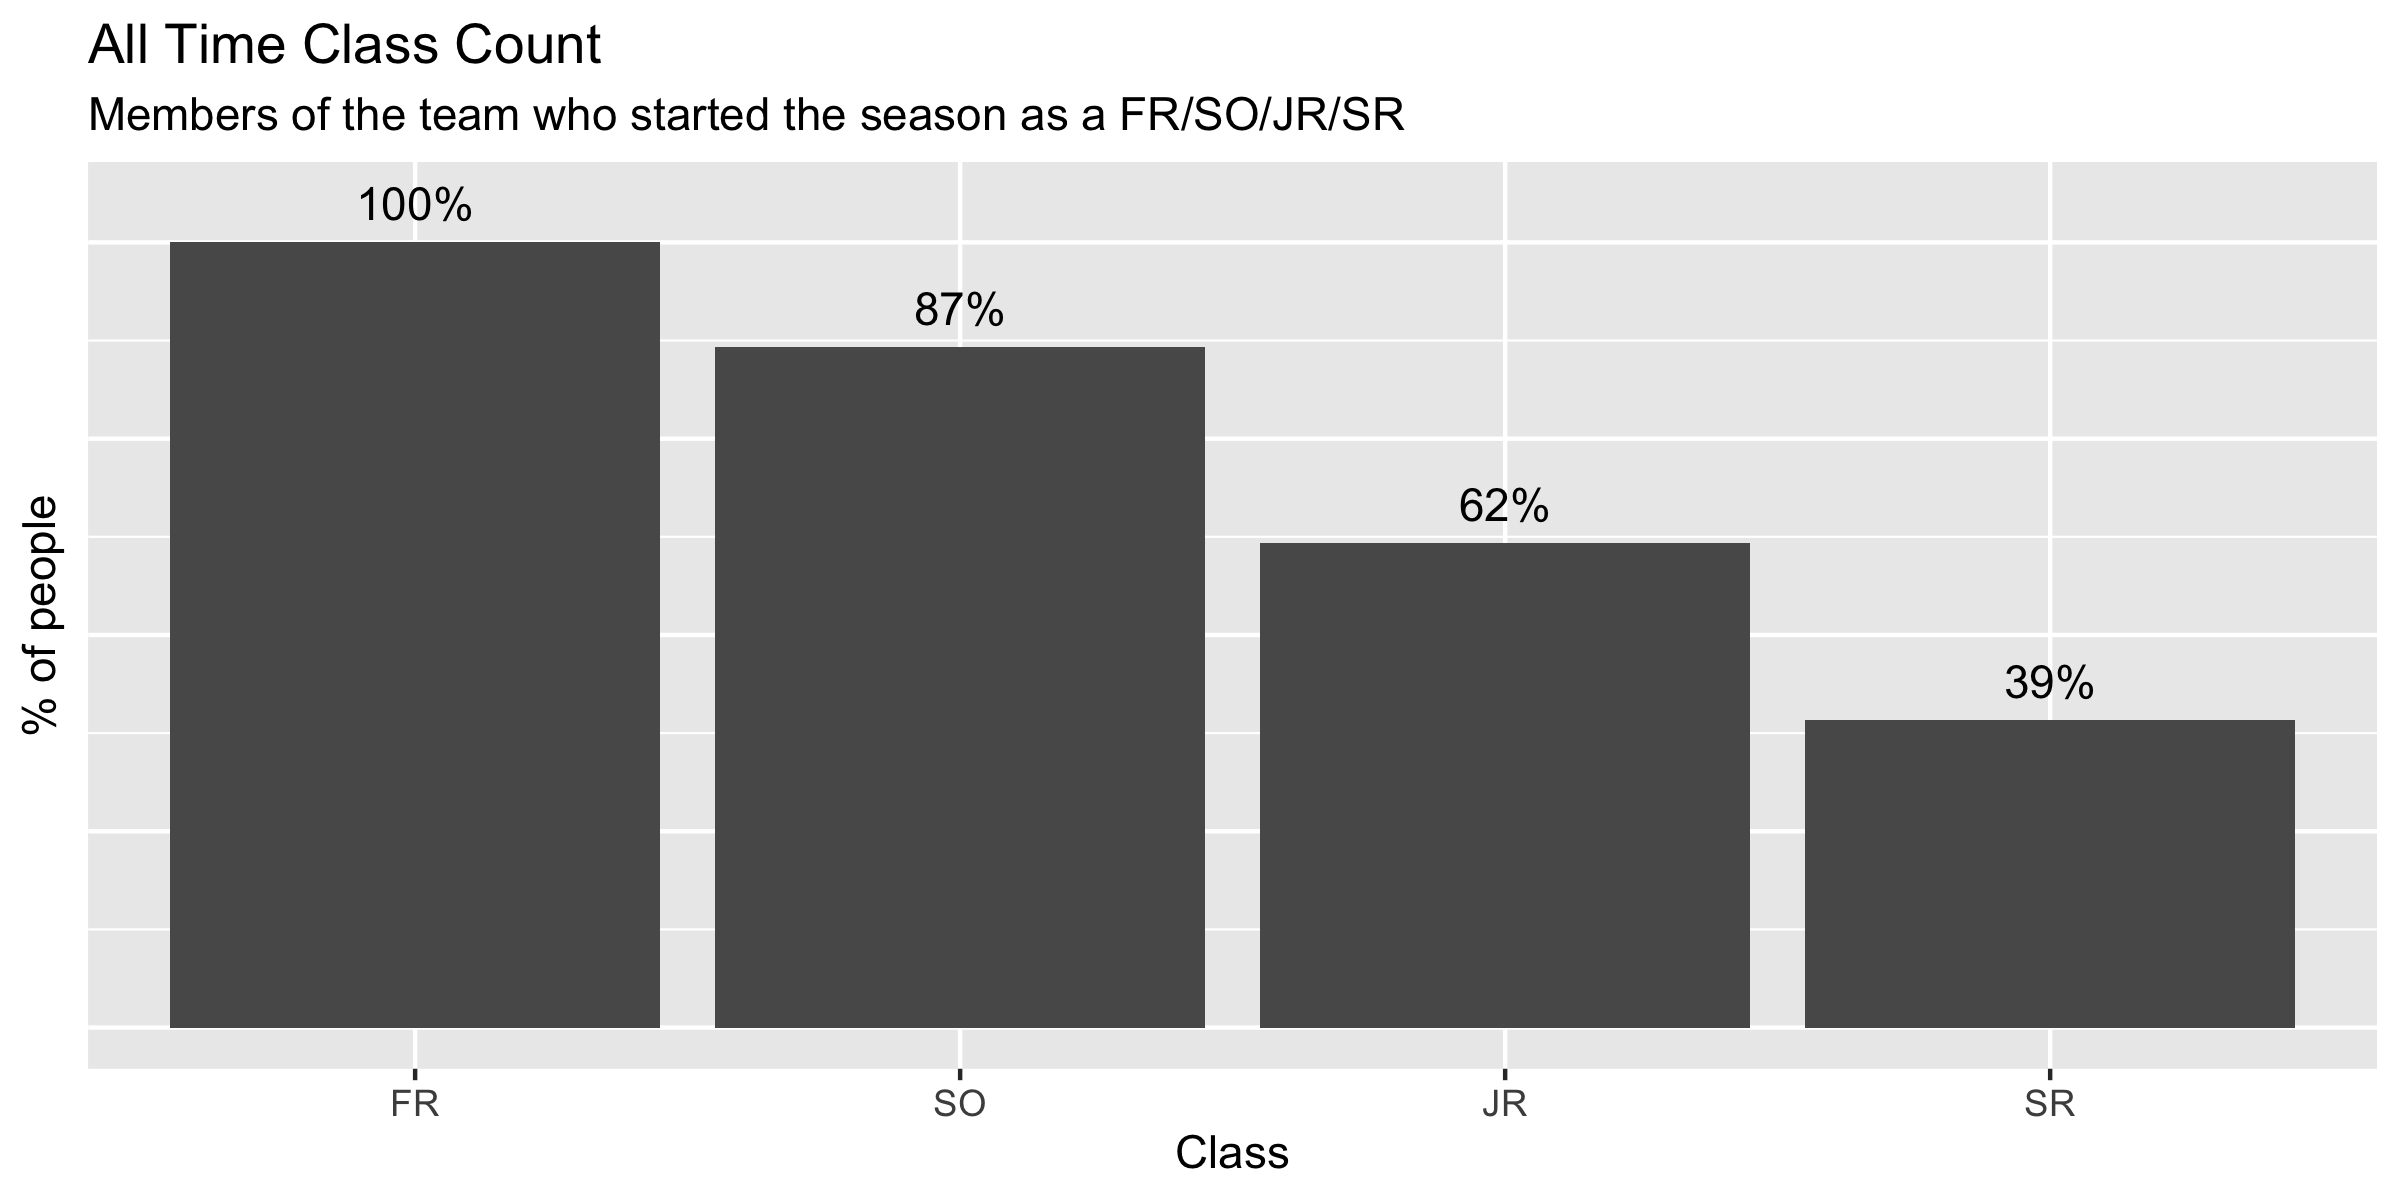
├── all-time-class-count.png
├── class-attrition-by-year.png
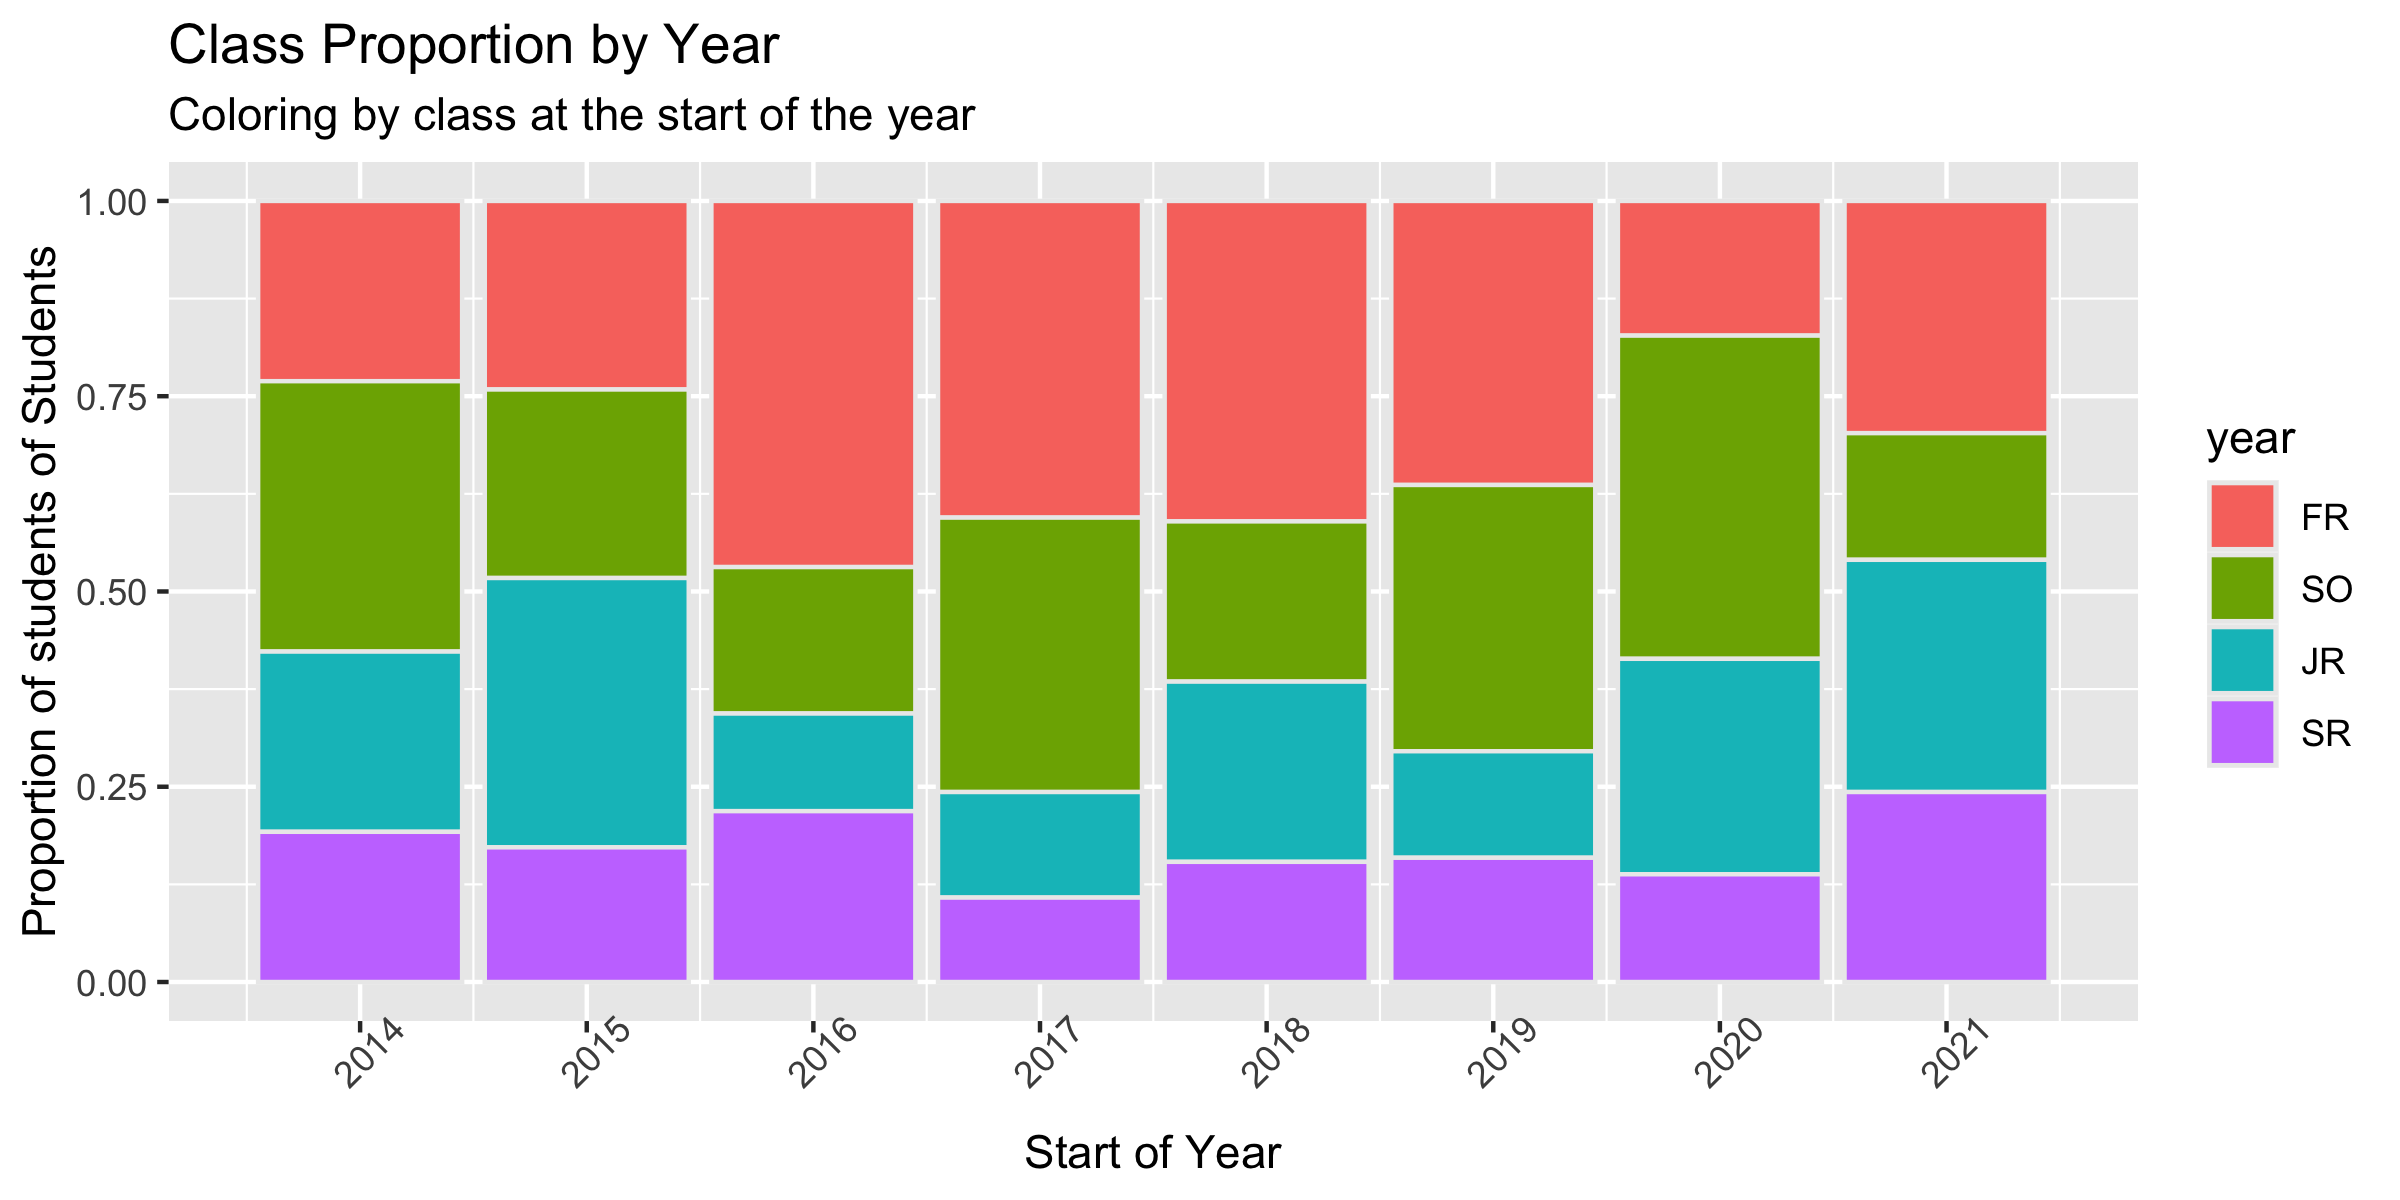
├── class-proportion-by-year.png
├── class-size-by-year.png
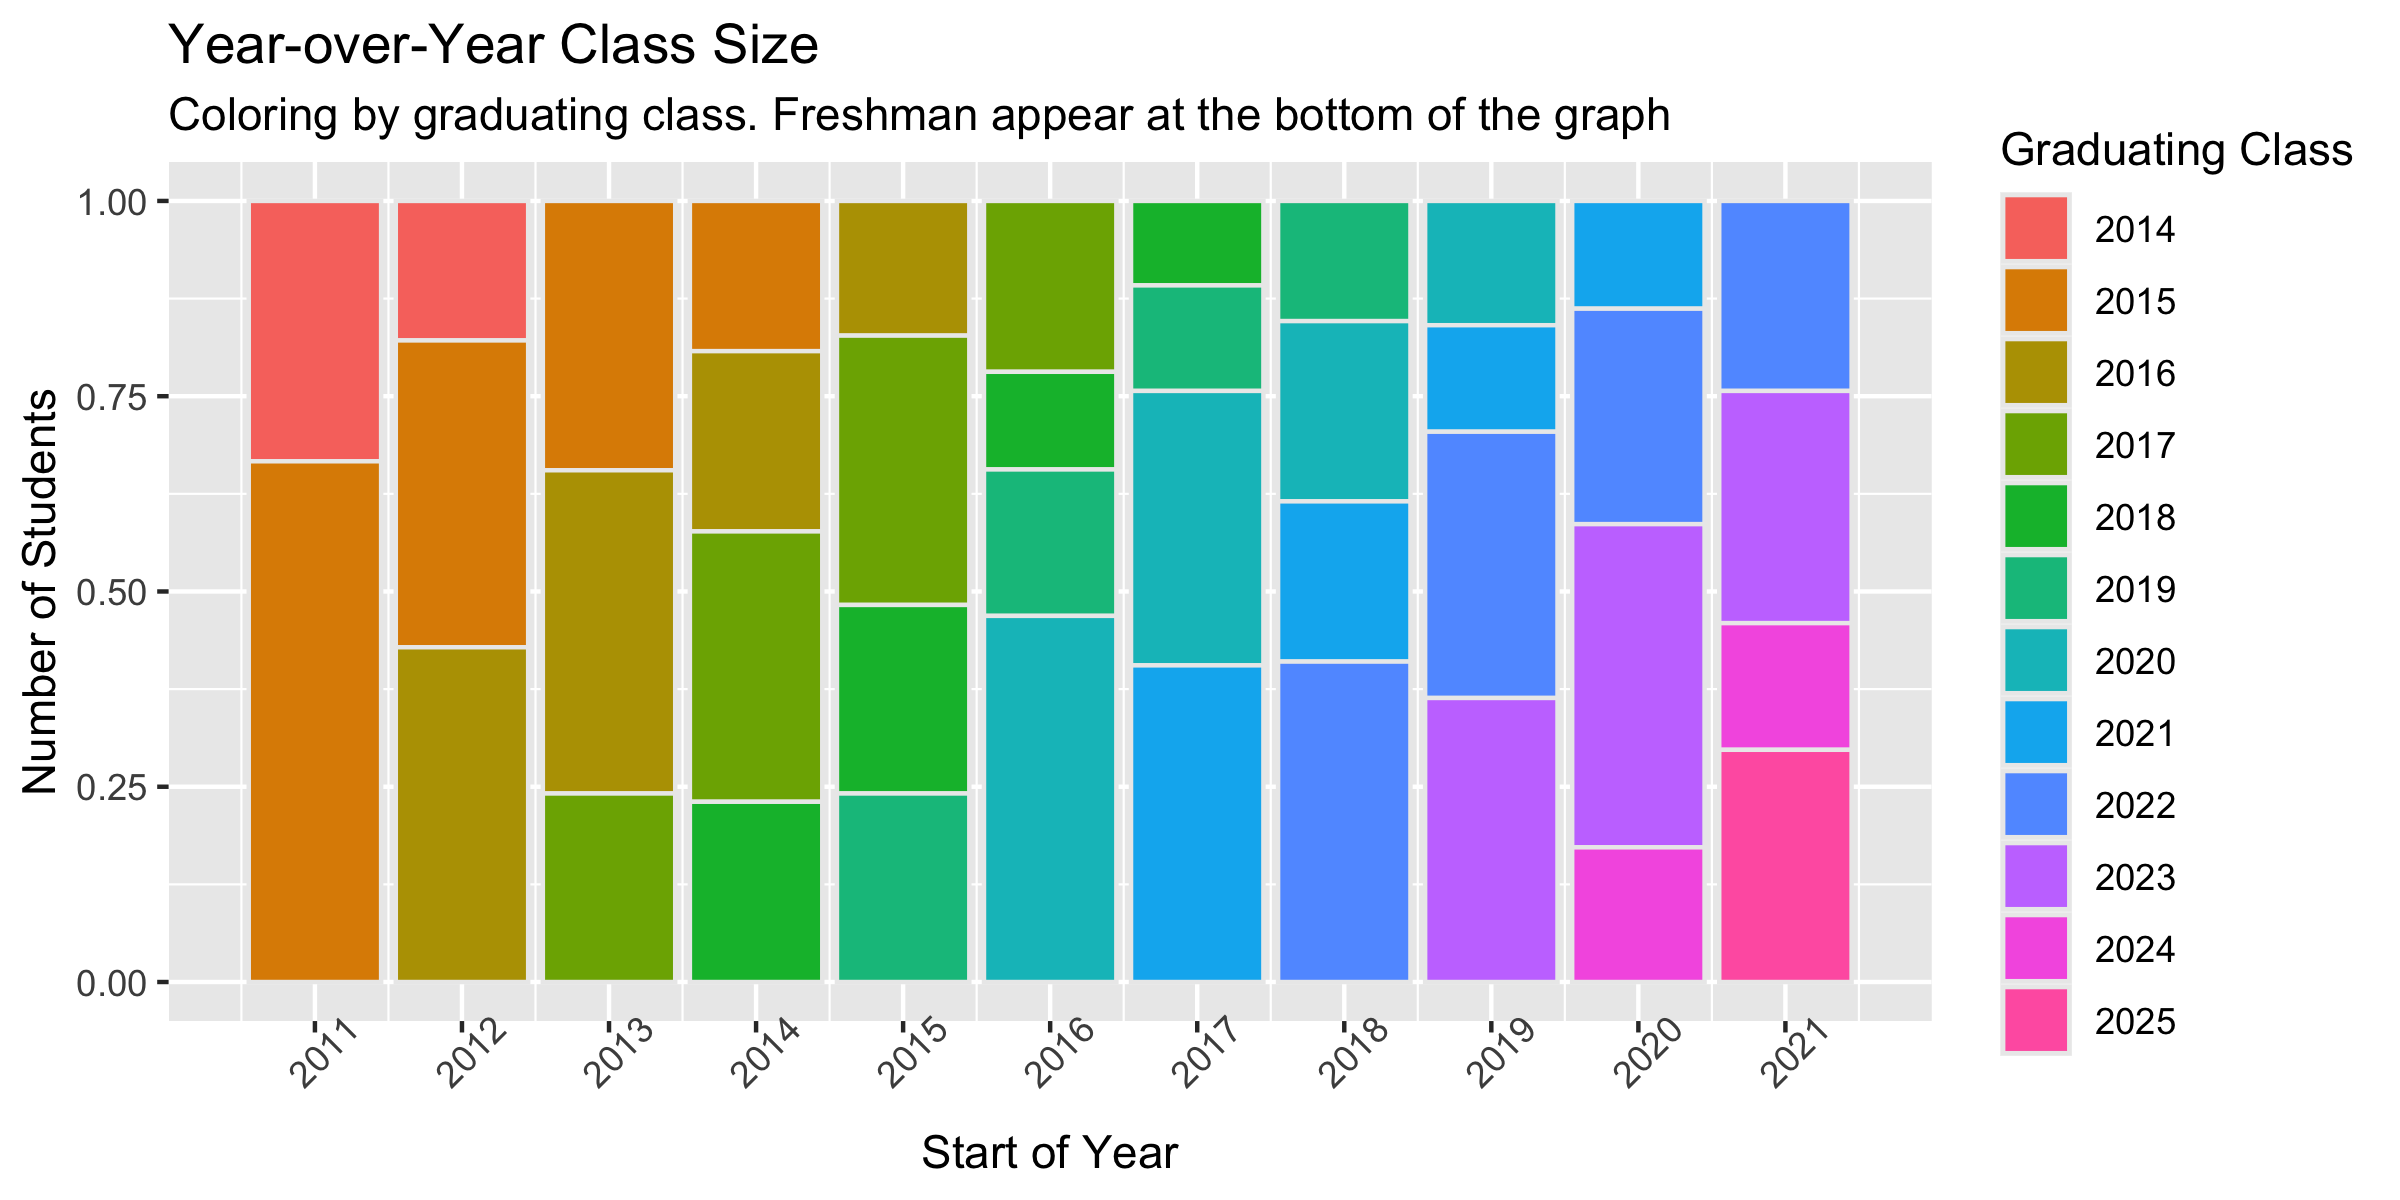
├── relative-class-proportion-by-year.png
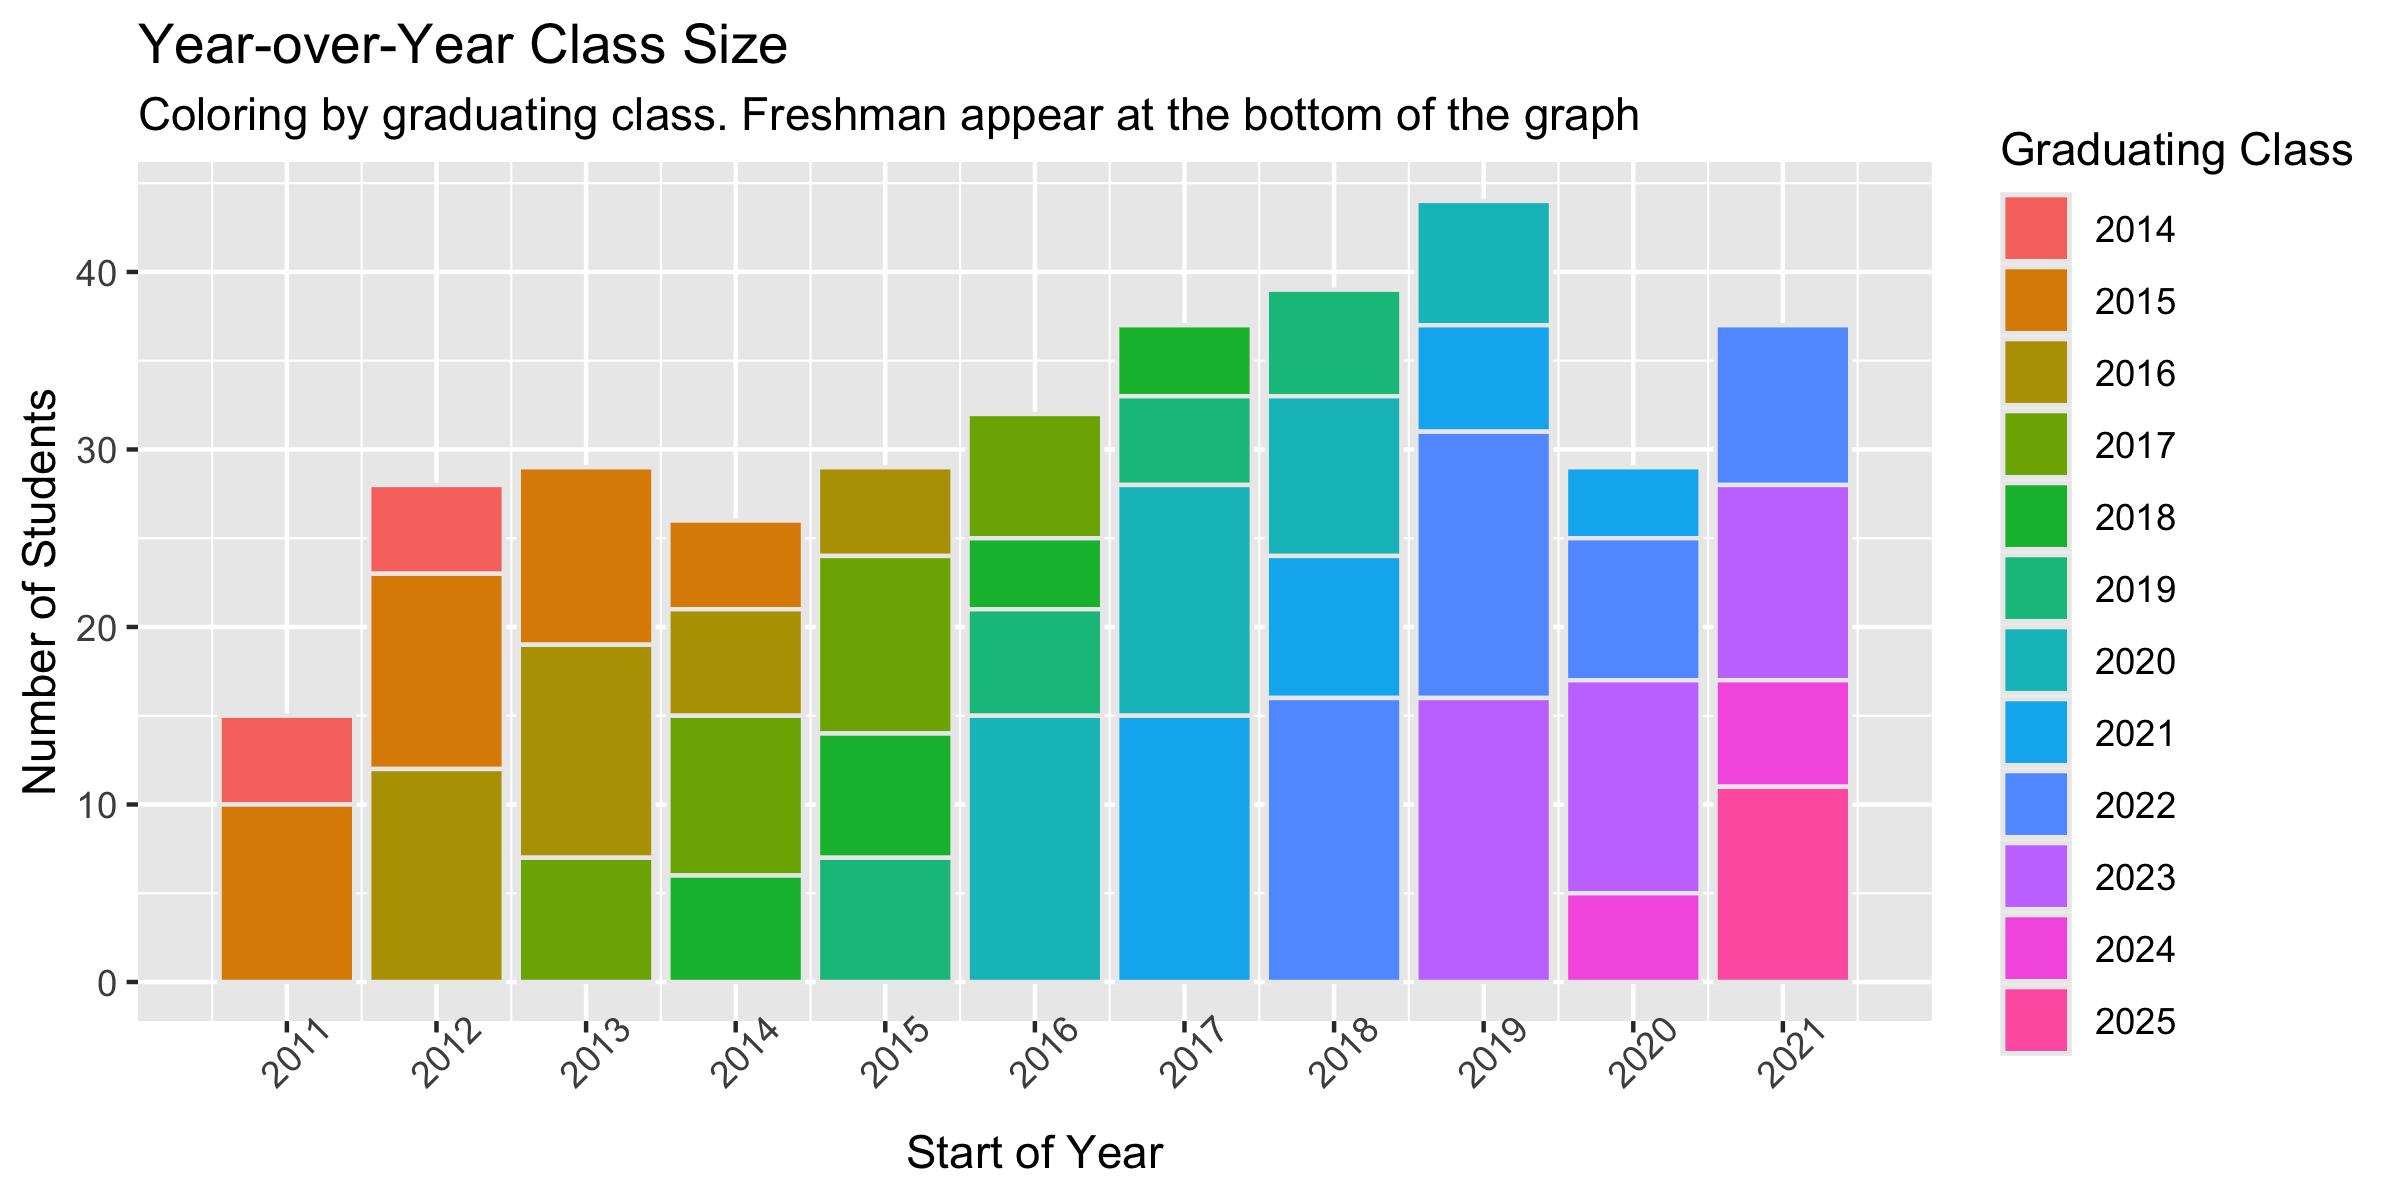
└── relative-class-size-by-year.png