This is a set of scripts and functions for GNU Octave which provide various functionality found to be missing in the standard packages.
Clone the repository and run make install from the project root.
This will build the package and install it into your Octave installation.
git clone https://github.com/Singond/Octave-extensions.git
cd Octave-extensions
make installPre-built packages for Octave are available at the releases page. You can use this method to only install the package without downloading the whole repository:
- From the
Assetssection in the desired version, find the filesingon-ext-*.tar.gz(here*is the version number). - Copy the URL of the file.
- In your Octave prompt, run
pkg install '<url>'where<url>is the URL of the file.
Having installed the package, load it like any other package. In your Octave prompt, run the following:
pkg load singon-extThe findpeaksp function searches for peaks in a signal. This implementation
supports filtering peaks by width and prominence.
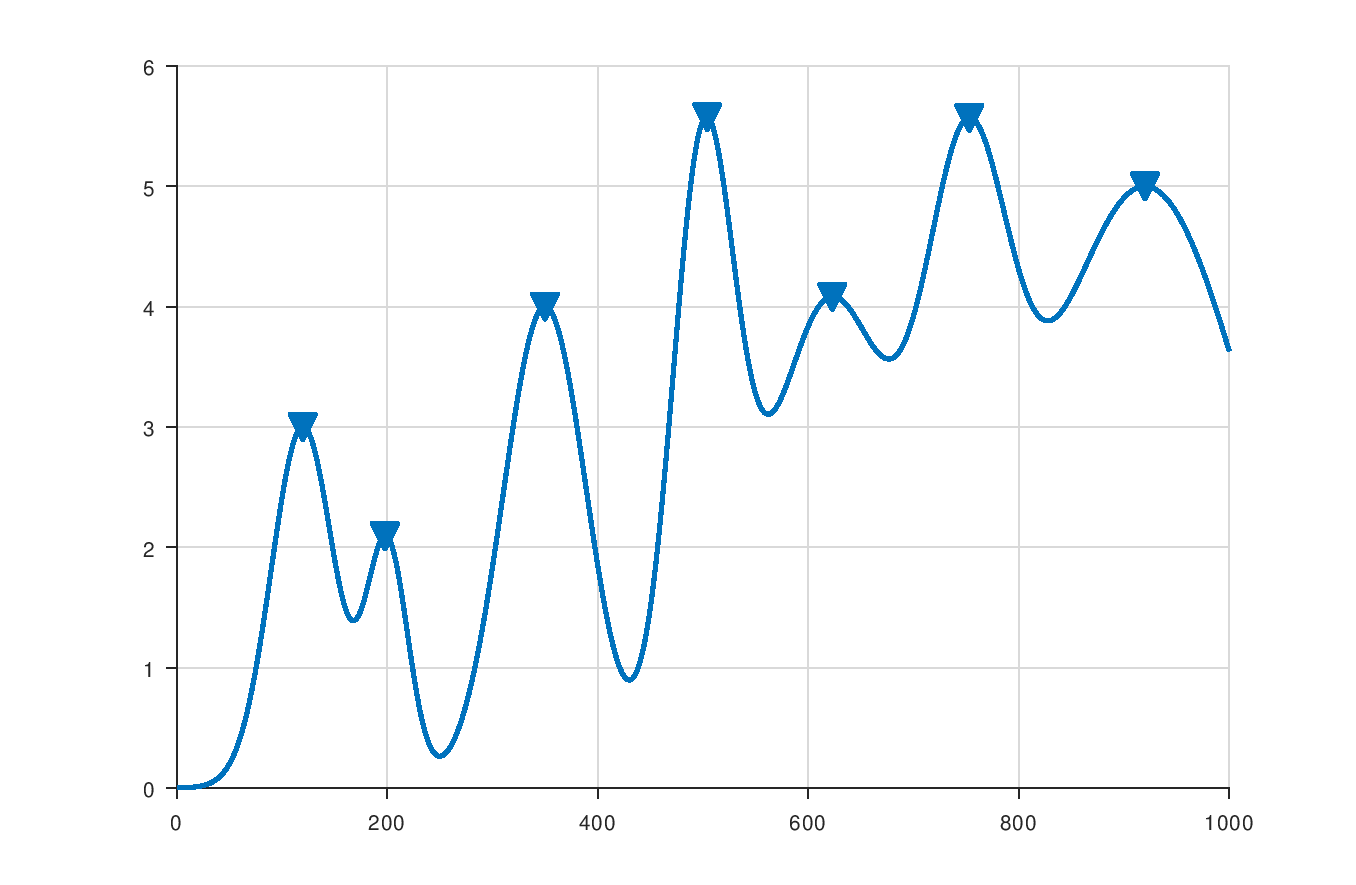
The following example generates a simple signal, finds all peaks in the signal, and displays the results in a plot:
## Generate an example signal by summing several gaussian pulses
x = 0.1:0.1:100;
p = [12 20 35 50 62 75 92];
s = [ 3  2  4  3  6  4 10];
m = [ 3  2  4  5  4  4  5];
yy = arrayfun(@(p,s,m) m*exp(-(x-p).^2./(2*s^2)), p, s, m, "UniformOutput", false);
y = sum(cell2mat(yy'))';

## Find all peaks in the signal and plot the results
findpeaksp(y);
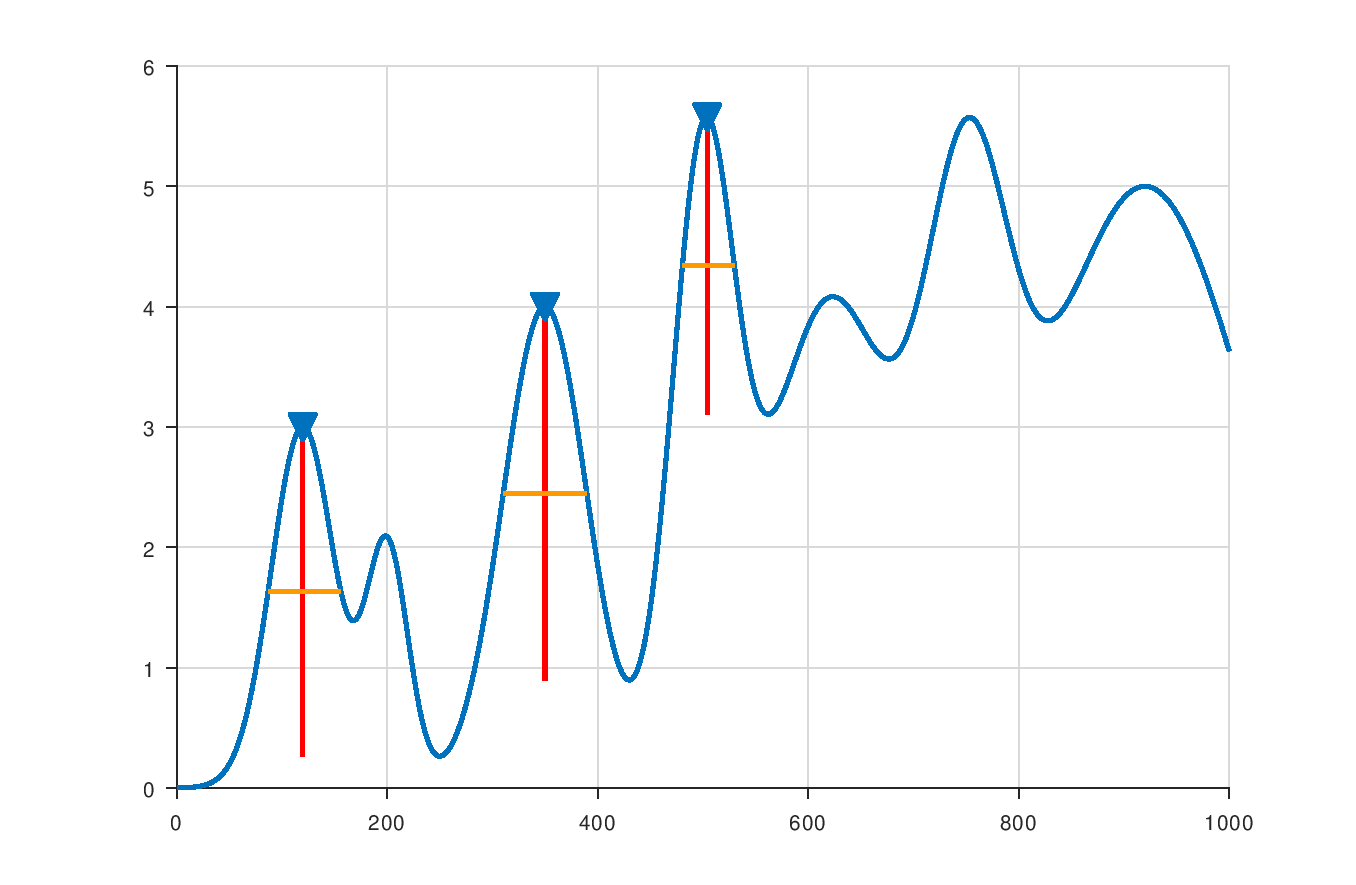
A small modification to the above example allows one to select only the peaks with prominence equal to or higher than 2:
## Generate an example signal by summing several gaussian pulses
x = 0.1:0.1:100;
p = [12 20 35 50 62 75 92];
s = [ 3  2  4  3  6  4 10];
m = [ 3  2  4  5  4  4  5];
yy = arrayfun(@(p,s,m) m*exp(-(x-p).^2./(2*s^2)), p, s, m, "UniformOutput", false);
y = sum(cell2mat(yy'))';

## Find peaks in the signal with prominence at least 2 and plot the results
findpeaksp(y, "MinPeakProminence", 2, "Annotate");
Here, we have used the Annotate option to mark the prominences in the plot.

