A real-time visualizer for the bitcoin blockchain
I think a lot of people hear something about Bitcoin and wonder what it really is. I mean: it's not physically limited, it's not verified by a trusted and independent source--so what is it? How is the supply limited? Who verifies that Frank sent money to Sally?
The best way to understand it is to visualize the data involved with some understanding attached.
Many computers expend processing power to validate blocks of transactions. The verification of each block includes, by cryptographic hash, the work of all previous blocks. The genious of this is that as the chain of blocks grows, the difficutly of later manipulation grows too. Grows exponentially, as it turns out.
This is what people talk about when they say block chain. A confirmed block is forever, and the block chain is the history of all confirmed blocks every agreed on by the community of nodes in the bitcoin network.
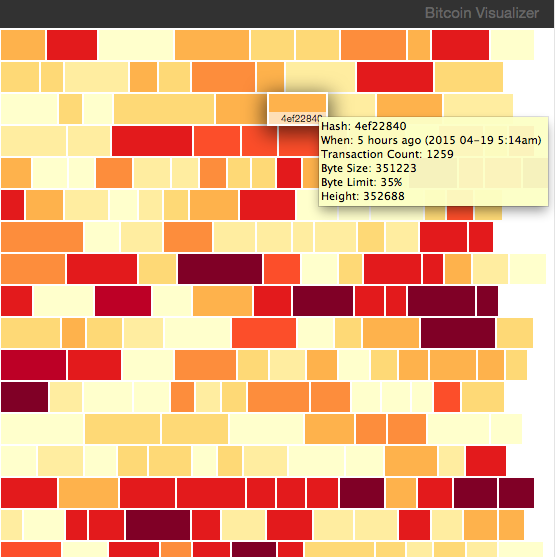
This visualization shows the bitcoin blockchain. Recently confirmed blocks are at the top and older ones are at the bottom.
Each rectangle is a single block of many transactions. Bitcoin processes about one block every 10 minutes.
The width of the block represents the number of transactions.
The color represents how close it is to capacity in byte size. Blocks are limited by the bitcoin protocol to 1mb, and many blocks are already very close to that limit, as you can see.
To run the project in development mode:
gulp
Run tests one time:
npm run test-once
Run a watcher that rebuilds the test package and runs tests whenever a test file changes:
npm run test-watch
- Live reload/watch that actually notices changes and rebuilds
- D3 draws fixed dom elements that float left
- Blank row at the top with a subtle title/link to the top right
- Blocks set width by transaction count
- colors from http://colorbrewer2.org/
- use api-vcr to record responses so I can work offline
- Blocks scale color by % of byte limit
- Pretty-print time and block capacity
- #build: a css-only change should inject new css, not refresh the browser
- Split blocks by day (in local time)
- #build: rebuild js changes faster, incrementally.
- Add a model layer with caching. Confirmed blocks are immutable and the caching layer can leverage that.
-
$_$ : Add a donation address and QR code - Support showing the entire history of bitcoin using infinite scroll and incremental loading
- Have one
day(other timeframes? A week?) of history always zoomed in for greater detail - Support changing the api key so an expert user can make it work if massive traffic makes me hit the API limit
- Ask the API providers for a free rate limit upgrade for this community project
- Show the text messages involved in the transactions. just a log style of what's said or something might be neat. https://chain.com/docs/v2/jquery/#bitcoin-block-op-returns
- Support infinite scroll with intelligent data requesting (fix height per day and request in days? fixed number of blocks per PX tall?)
- Consider: more interesting segmentation. Per day in local time? Responsive sizing? Other dimensions?
- Pending block (shows a dotted/transparent appearance). says "pending, last confirmed block at DD"