


![]()
Data visualization of the crime hotspots in Prince George's County
Explore the docs »
View Deployed Demo
·
Report Bug
·
Request Feature
- About the Project
- Built With
- Getting Started
- Prerequisites
- Installation
- Contributing
- Contact
- User Manual
- Developer Manual
The Prince George's County Crime Map application hopes to display what types of crimes occur the most and where in an effort to increase personal safety and affect policy to lower crime rates. In an ideal scenario for individuals, one would be able to pull up the crime map before or after leaving their house, place of work, or another area and view where crimes happened the most in close proximity to them. This would allow individuals to avoid areas of high crime to avoid theft, injury, or worse. Communities as a whole may be able to use the app to draft their own community safety guidelines and recommendations on personal protection. On a political scale, the app is meant to give public officials an idea of what crimes occur the most and where to inform their decisions on crime reduction and community safety.
- Improve the visualization of crime in Prince George's County
- Highlight crime hotspots, what crimes occur the most and where
- Creates an immediate data visualization of the hotspots so people can avoid them and activists and politicians can focus efforts in these areas
- Our main targets are Desktops and Mobile devices such as iPhones.
To get a local copy up and running follow these simple steps. If you just want to take a quick peek I would recommend you check out deployed version.
This is an example of how to list things you need to use the software and how to install them.
- npm
npm install npm@latest -g- Clone the PGC-Crime-Map
git clone https://github.com/Shivppatel/PGC-Crime-Map.git- Install NPM packages
npm install- Fork the Project
- Create your Feature Branch (
git checkout -b feature/AmazingFeature) - Commit your Changes (
git commit -m 'Add some AmazingFeature') - Push to the Branch (
git push origin feature/AmazingFeature) - Open a Pull Request
Project Link: https://github.com/Shivppatel/PGC-Crime-Map
Welcome to the user’s manual for the Prince George’s County Crime Map Web API (PGC Crime Map). In this document you’ll find out what the site does and how to best utilize it for your needs. You’ll also find any of the bugs consistently found in the project and what to do if you encounter them.
The navigation bar is located at the top of the page and will remain with you as you scroll down and up the page. The bar allows you to switch between pages without having to scroll to them, giving you quick and easy access to pages and limiting the chances you’ll get lost. When at the very top of the website in the home page, the navigation bar will be clear, but it will turn a dark blue when scrolling down to the other sections of the website.
The sections of the website are listed in order from left to right, those being: Home, About, Crime Map, Statistics, and Documentation. The bottom of the navbar of the page you’re on is highlighted at all times in a lighter blue than the one used for the navbar itself.
The sidebar mainly pops up automatically when the window is sufficiently small, either due to being on a smaller device (e.g. a phone) or decreasing the size of your browser window. The icon for the sidebar will appear as three solid white lines in the upper right corner of the page. Clicking on it will open a menu with all of the pages of the web app. Clicking any of these pages will bring you to the appropriate page.
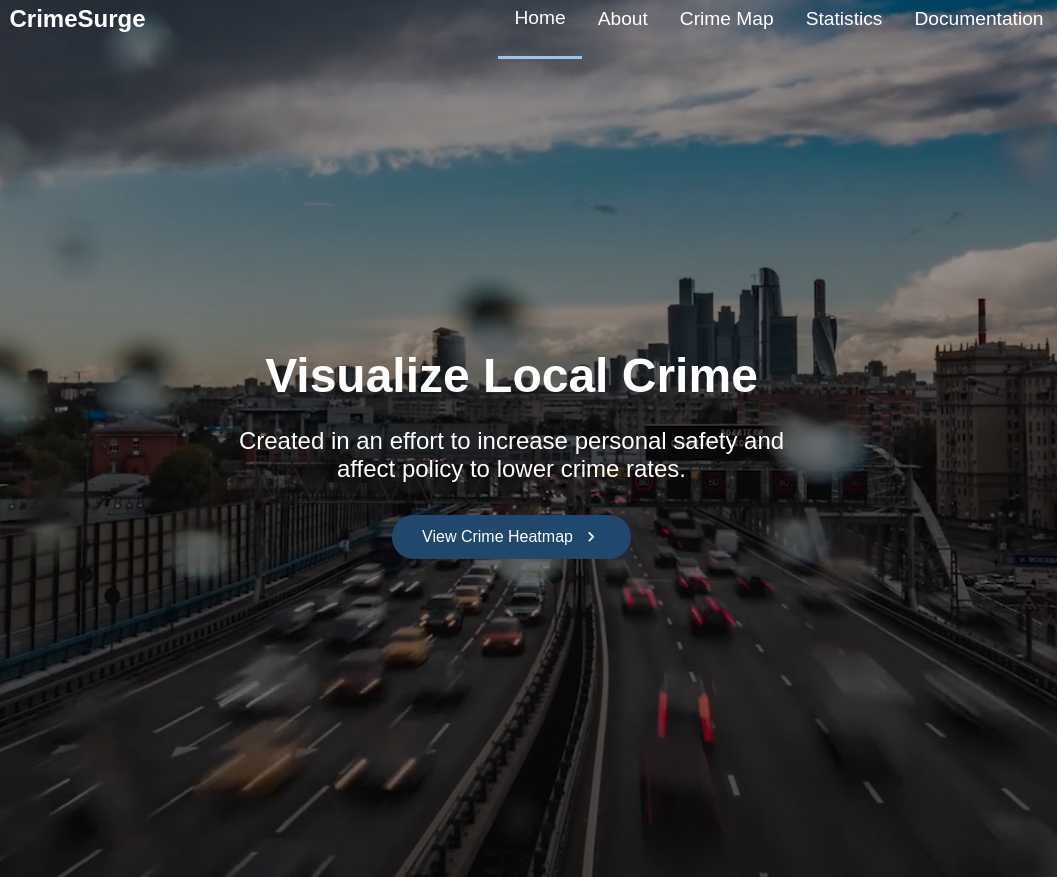
The homepage is the first page you should see when the CrimeSurge webpage is opened. It has a dynamic visual of traffic and a city skyline that replays indefinitely. The home page is the main page of the website and users can either utilize the scroll bar or navigation bar to go to other parts of the website. There is a link in the center of the homepage labeled “View Crime Heatmap” that serves as an additional link to the CrimeMap page.
The about page has three sections: “Our Goal”, “About Our Dataset”, and “What the Dataset Will Tell Us”. Each section has background information for the project, such as the dataset used and what the data should reveal to us and the users. The “Our Goal” section reveals what we hope to achieve with this dataset and website. The “About Our Dataset” section describes where we got our data from and the key data points used. The “What the Dataset Will Tell Us” portion describes what data our source gives us, such as the location and frequency of crimes. This can serve as useful background information for what the data actually is meant to show and if you may find this information personally relevant and useful.
The Crime Map is a dynamic page on our site that utilizes a heatmap. It generates points on the map using latitude and longitude data and indicates where a crime has occured. When many points are in the same location the heat map registers a red area. When a low amount of crime occurs in an area the color is green.
The map is laid over a Google Map-like structure, and has similar controls to a Google Map as a result. When you scroll over the map, the map image will darken and you will be given a prompt to control the map’s current location by holding down a button and using the mouse. Holding down this button and pushing up/back or scrolling up and down will zoom the map out and in respectively for better visualization of specific parts or the entirety of the map. (Left) Clicking the map and holding the cursor down will allow you to move the map from left to right and up and down by moving your mouse in a direction. Heat map points may become less “concentrated” when zoomed in, i.e. red and yellow spots may not display with said colors and you may have to zoom out to see the actual areas where crime is concentrated.
The statistics page shows crime statistics for the PG County area. It includes dynamic graphs that update as new data is added to the dataset. This page is useful to any user looking for specific statistics on crime rates in PG county.
Clicking on the button “Open statistics dashboard” will open a new tab displaying the current data the map has in a MongoDB dashboard. The graph displays crimes by categories, unveiling how often each crime is committed in the PG County area. Future functionality will likely add more insightfull graphs once our database gets populated with data with timestamps along with the date.
The documentation page guides users to important pages related to Crime Surge. There are three links: “View Source Code”, “User Manual”, and “Developer Manual”. The “View Source Code” link takes the user to our Github page with all the source code to show people how the site was constructed. The User Manual (what you’re currently viewing) describes how to utilize the website and what it’s for. The Developer Manual gives developers insight on how to work with the Crime Surge site and more information about our dataset. It also shows how the site works and how to work with the application on their local machines, from installing the necessary packages to running the site locally.
- Developer Manual Introduction
- Installation
- Running the Application
- Running Tests
- API
- Get
- Post
- Put
- Delete
- Known Bugs and Future Development
Welcome to the developer’s manual for the Prince George’s County Crime Map Web API (PGC Crime Map). In this document you’ll find how to install and run this application in addition to the API requests used to make the application work. You’ll also find any of the bugs consistently found in the project, how they were dealt with, and any plans for future development.
Run “npm install” in a new terminal window to download the basic parts of the package.json file. This will install said file into the local node_modules folder, which may be necessary to run the application. If the application cannot run but there’s no error in your code, you may just have to run “npm install”, especially if you just installed another package.
After this, run “npm install --save node-fetch”. This will allow you to retrieve external data into your server.js file or anything similar to it.
The application is made using React, a single-page web application. In order to install/start a new React project, you must input “npx create-react-app [app-name]” into the terminal of your window. Doing so will provide you with a basic react project with the standard functionalities installed, including a “src” folder that will hold all of the components to make the application. After doing this, create folders for your components, page, video, and images. The components will hold the individual “pages” of the application, including the home page, about, and documentation pages. The “pages” folder will hold the basic structure of the page in an “index.js” file, including the header, footer, and individual pages such as the homepage, about, and documentation. The images and videos folders will hold the images and videos (or link to them) used for the web page. The components folder will hold an individual folder for each component’s page structure called “index.js” and a styling file named “component_name.js” that the index.js will be linked to (or rather import the styling from). The index.js file will function much like a regular HTML page with the exception that you’ll be using capitalized letters for any class names you make in the styling js file (header will become “Header” so the rules from the styling file can be applied in the index.js file). Keep in mind that for each index.js file, you’ll need to type “import React from ‘react’” at the top of the file, and import any other necessary libraries as well such as “import GoogleMapReact from ‘google-map-react’”.
To run the program after everything is installed, first move into the “Clients” directory with “cd Clients”. Type “npm start” into the terminal in this directory to begin running the front end of the application. If everything has been installed correctly, this command should open up a new local instance of server 3000 (although if that server is currently running, you will be prompted to use another server). Your local instance should open up as a new tab in your browser, but if it doesn’t, type “localhost:[current local host number]” to navigate to the local instance of the application.
After you have confirmed the front end has begun running correctly, move back into the main directory with “cd ..” and run “npm start” again. This will start the back end that utilizes API calls such as get, post, and put.
If that doesn’t work, the other options may resolve the problem, but if they don’t, make sure to pull any changes made to the main branch if you’re working in a group. The version differences between branches may resolve the problem. If pulling or merging branches does not work, uninstalling and reinstalling the project may fix the issue. Reinstallation should solve the problem and wipe out any mistakes made during the initial installation process, but if the problem persists after reinstallation, additional research may be needed.
The PGC Crime Map API technically does not have any official tests to run to test its functionality such as Cypress. There are, however, several visual ways to test the application, much like any application.
The first is to make sure the web page has opened and displayed its contents correctly. Any differences between the expectation and reality of factors such as placement, color, and text size should be noted and fixed in the code if possible.
Second, the heat map should display hues of green, yellow, and red on the imported Google map that show where crimes (or other activities) are concentrated the most. If this isn’t true, the data points may have been retrieved incorrectly or the link to the API may be broken.
Third, if the statistics aren’t shown to be similar to the tableau version of the data, the get or post requests likely faltered, the SQL script has an error in it, or the link to the API is broken.
The application mainly utilizes the get, post, and put endpoints to retrieve and post the data from the PG County API along with adding and updating crime incidents in the database. There is an additional delete endpoint that helps to delete particular incidents from the database. These endpoints can be found primarily in server.js, and utilize mongoose to build a database.
The get endpoint is meant to retrieve data from the PG County API database, with said data usually being in the form of JSON. The get endpoint also sends a JSON representation of the database’s crime incidents. In the get endpoint, a statement such as “Hello, welcome to CrimeSurge's API” is output if the get request is valid. If the request is invalid, an error is thrown. The url endpoint for the get endpoint is “/api/incident-data”.
The post endpoint sends data to our server to update the database we have created, allowing said database to be updated automatically or manually if need be. Whenever something utilizes the post endpoint, a message is sent in the form of the new data added to the database. The endpoint also outputs a few messages to the log to ensure the post request is working, such as the body of the request (req.body). Just like the get endpoint, an invalid request generates an error message. The url endpoint for the post endpoint is “/api/report-incident”.
The put request updates an incident in the database, allowing crimes that may have been misinput to be updated without deleting them through a put request. Whenever a put request is submitted, a message is sent in the form of the data that was updated. The console also generates a statement of the query that updated the data and what the update is. It will also generate an error if the request is invalid. The url endpoint for the put endpoint is “/api/update-incident”.
The delete endpoint deletes incidents in the database that may have been invalid upon their input. It will delete the input that matches the request body, and returns a message containing what was deleted. Like the other endpoints, it will output an error message for invalid requests. The url endpoint for the delete endpoint is “/api/delete-incident”.
There are several potential bugs in the application that still need to be resolved. The heat map’s data points, when zoomed out a bit, can become blob-like and indistinguishable from each other. This bug does not occur often, but it does exist and can make identifying crime hotspots difficult. In the future this will be remedied by looking at the styling choices of the heatmap and if there is a way to keep hotspots more distinct from each other even when zoomed a certain distance away.
Another minor bug is that when clicking on separate hotspots and exiting out of the specific crimes highlighted, the page will move down. The shift is notable enough that after clicking on approximately a dozen hotspots, exiting from all of them will shift the user to the next page. We’re unsure why this occurs, but in the future, perhaps we’ll add code that keeps the user’s current view centered on the page after exiting a specific crime.
Additional future development will focus on importing more graphs and increasing user interaction. One way to combine the two would be to have all of the graphs available on the statistics page via arrows that allow a user to switch to graphs. For example, a crime by location graph could be added, and users could swap between graphs with the push of an arrow button on the left and right of the graphs.
Making the heat map similar to this is another possible objective, such as allowing users to filter for crimes on the heat map by time or crime type so people could see when crimes were committed the most in what locations and when. This could help improve visualizations for when crimes are committed in a physical sense, and notify people of when they’re most likely to be a victim.