Using Jupyter Notebook and Pandas. Reviewing schools for data analysis.
More Python coding.
Analyzing city school data to make future school budget decisions.
-
Inside the local git repository, created a folder for the Python/Pandas Challenge. CitySchools
-
The analysis can be seen in the files: 'School Data Analysis.RTF' or 'School Data Analysis.DOCX'
-
Inside of this folder 'CitySchools'; added the following:
- A new file called
CitySchools.ipynb. This is the main script to run for analysis. - A "Resources" folder that contains the CSV files used. Make sure the script has the correct path to the CSV file.
- A new file called
- A table that summarizes key metrics about each school, including:
- Total Schools
- Total Students
- Total Budget
- Average Math Score
- Average Reading Score
- % Passing Math (The percentage of students that passed math.)
- % Passing Reading (The percentage of students that passed reading.)
- % Overall Passing (The percentage of students that passed math and reading.)
- A table that highlights the top 5 performing schools based on % Overall Passing. Include:
- School Name
- School Type
- Total Students
- Total School Budget
- Per Student Budget
- Average Math Score
- Average Reading Score
- % Passing Math (The percentage of students that passed math.)
- % Passing Reading (The percentage of students that passed reading.)
- % Overall Passing (The percentage of students that passed math and reading.)
- A table that highlights the bottom 5 performing schools based on % Overall Passing. Include all of the same metrics as above.
- A table that lists the average Math Score for students of each grade level (9th, 10th, 11th, 12th) at each school.
- A table that lists the average Reading Score for students of each grade level (9th, 10th, 11th, 12th) at each school.
- A table that breaks down school performances based on average Spending Ranges (Per Student). Use 4 reasonable bins to group school spending. Include in the table each of the following:
- Average Math Score
- Average Reading Score
- % Passing Math (The percentage of students that passed math.)
- % Passing Reading (The percentage of students that passed reading.)
- % Overall Passing (The percentage of students that passed math and reading.)
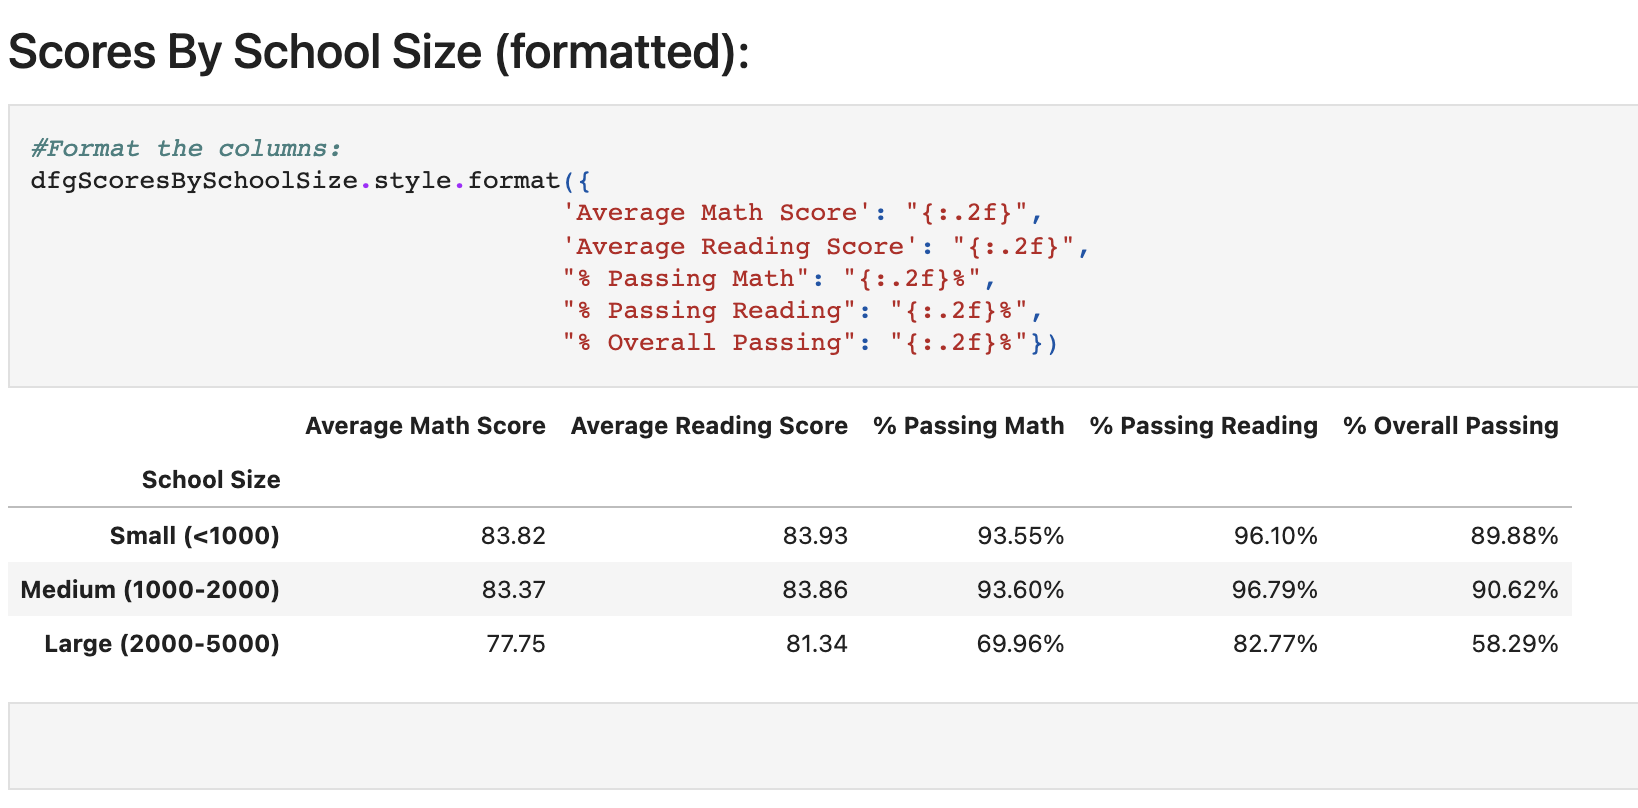
- Repeated the above breakdown, but this time grouped schools based on a reasonable approximation of school size (Small, Medium, Large).
- Repeated the above breakdown, but this time group schools based on school type (Charter vs. District).
Mockaroo, LLC. (2021). Realistic Data Generator. https://www.mockaroo.com/
© 2022 SherryK All Rights Reserved.
