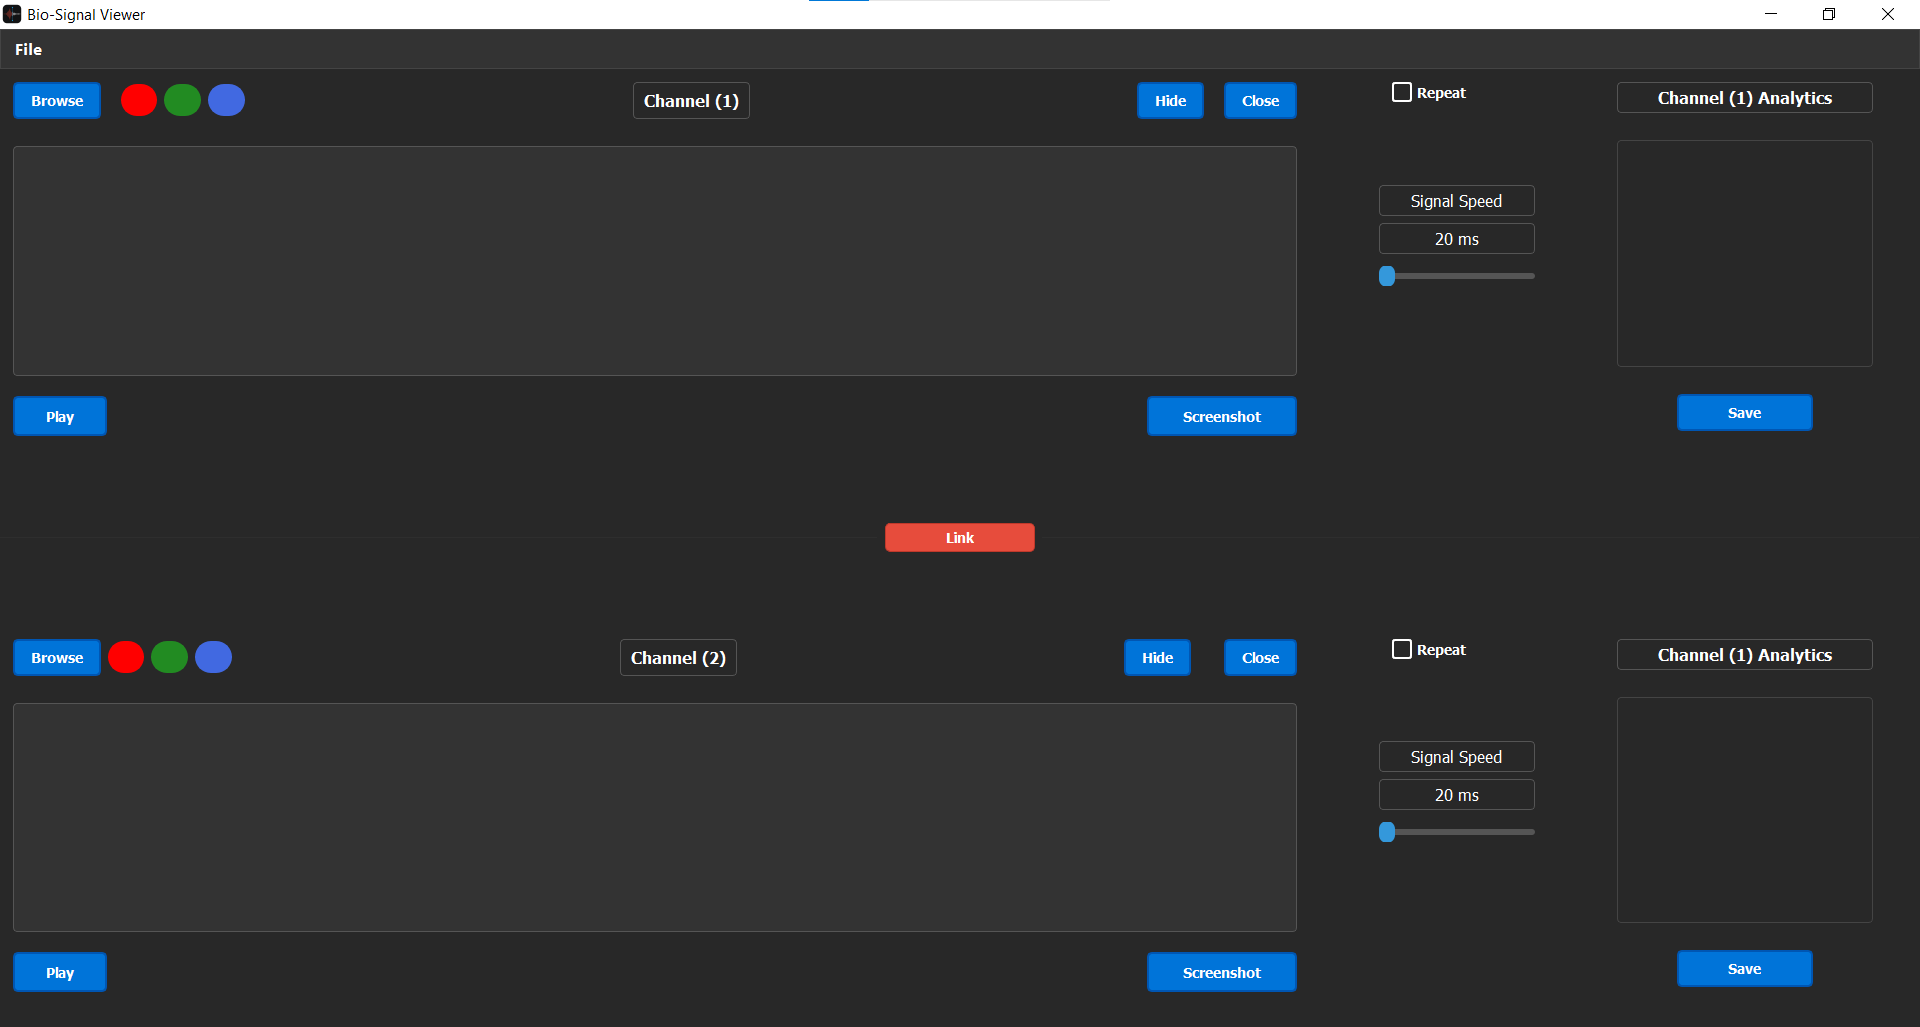
The Signal Viewer is a desktop application designed to visualize biological signals. Utilizing PyQt5 for its GUI and incorporating functionalities such as playback and real-time updates, it serves as a versatile tool for researchers and professionals working with biological signals like ECG.
- Signal Visualization: View biological signals effectively in a clean and user-friendly interface.
- File Import: Import signal data from
.dat,.csvfiles. - Playback Controls: Play and pause the visualization to understand signal variations and anomalies over time.
- Hide/Show: Ability to toggle the visibility of the signals for comparative studies.
- Screenshot: Snapshot feature to capture and save the visualized signals as images.
- Color Toggling: Customize the color of the signal for clear visibility and understanding.
- Python 3.x
- wfdb
- numpy
- pandas
- PyQt5
- pyqtgraph
- reportlab
- pyqt5-tools
-
Clone the Repository
git clone [https://github.com/fadymohsen/SignalViewer] cd [SignalViewer] -
Install Dependencies & Requirements
pip install -r requirements.txt #All Libraries & Packages -
Run the Application
python main.py
-
Load Signal:
- Click on
Browseand choose your signal file (.dat or .csv format). - View the signal in the respective channel panel.
- Click on
-
Playback:
- Use the
Play/Pausebutton to start or stop the signal visualization playback.
- Use the
-
Hide/Show Signal:
- Use the
Hidebutton to toggle the visibility of the signals in each channel.
- Use the
-
Screenshot:
- Use the
Screenshotbutton to save a snapshot of the current view of the signal.
- Use the
-
Change Signal Color:
- Utilize the color buttons (e.g., Red, Green, Blue) to toggle the color of the visualized signals.
-
Close:
- Click the
Closebutton to end the signal visualization in a particular channel.
- Click the
-
Export:
- functionality to save the visualized data in various formats.
-
Zoom:
- Zoom in or out in the signal view.
- Signal Viewer: The primary GUI application class responsible for handling user inputs and managing UI updates.
- Signal: A class dedicated to managing and manipulating signal data, rendering, and controlling playback.
- PyQt5: Handles GUI creation, management, and user interaction.
- pyqtgraph: Enables real-time signal graphing.
- wfdb: Used for loading, writing, and processing WFDB signals and annotations.
- NumPy and pandas: Manage numerical operations and data management.
1- Fady Mohsen
2- Ahmad Mahmoud
3- Shehab Mohamad
4- Mohamad Aziz
