This project is part of GL5 DevOps Lab. We are meant to create a distributed application, then use it with other tools in order to understand different DevOps concepts.
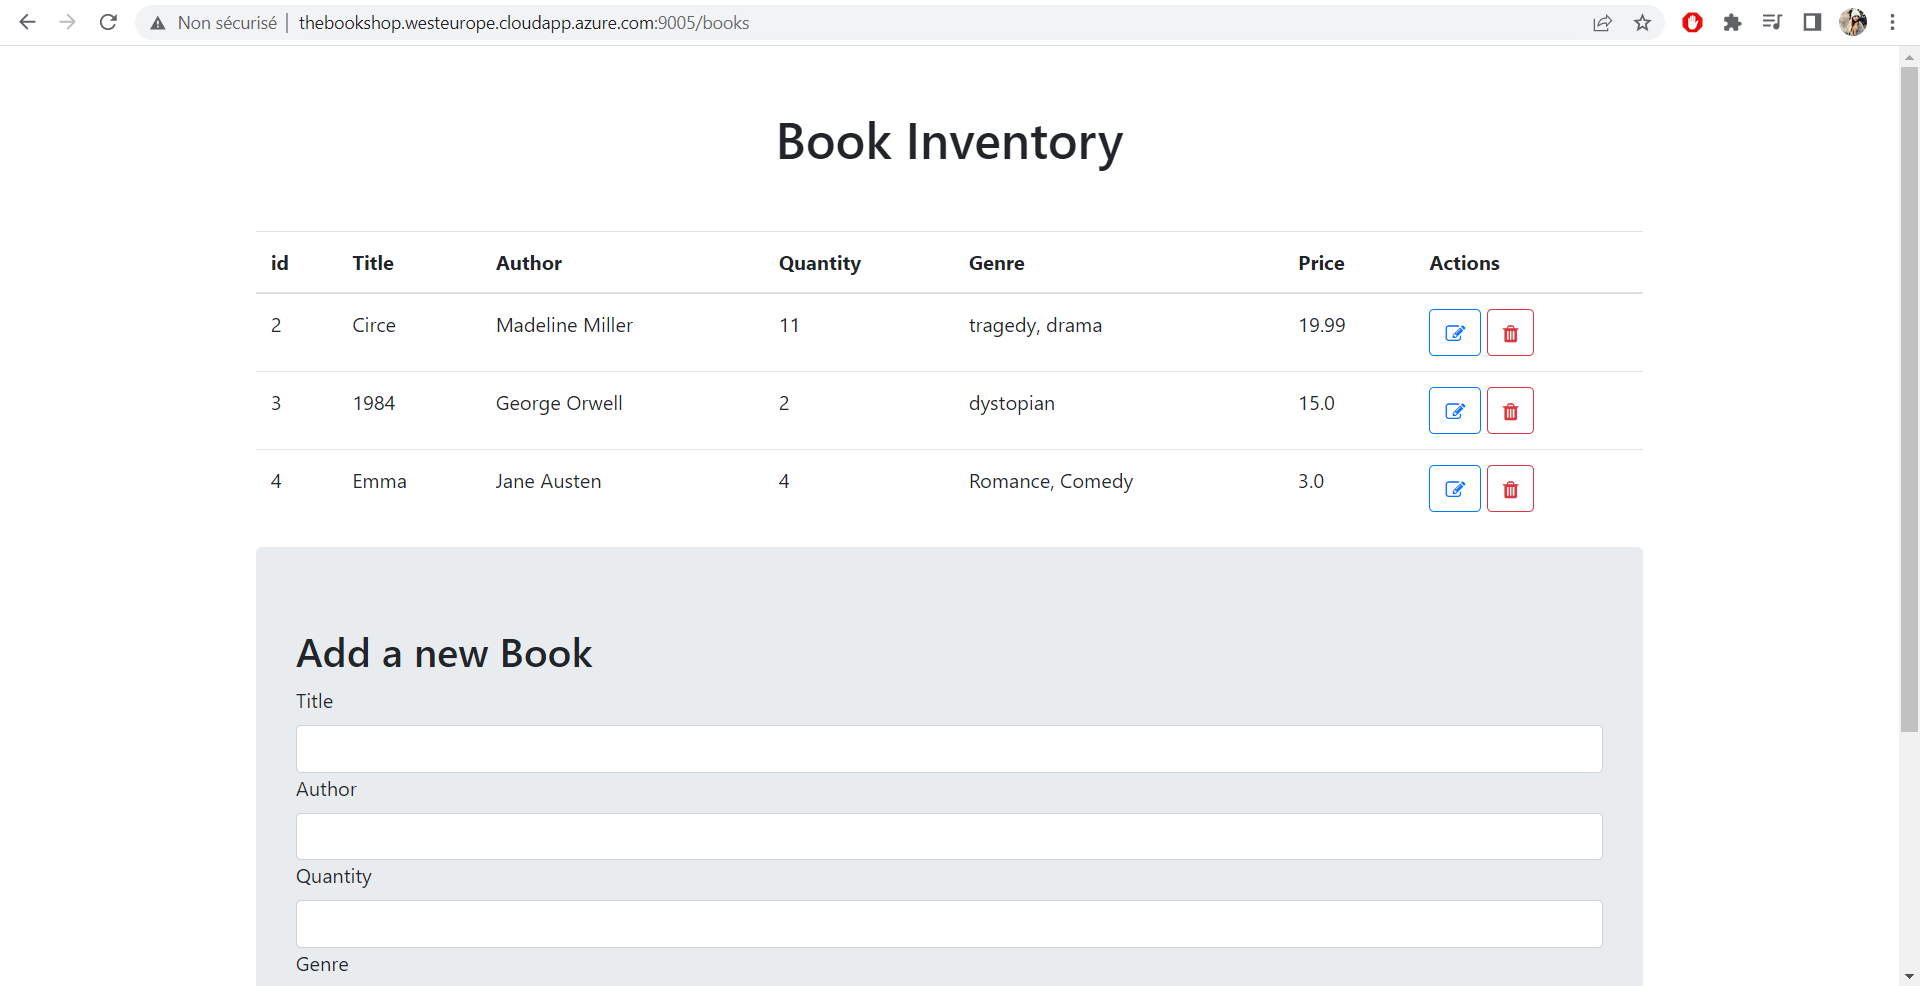
The Book Shop is an application that manages a book inventory. It's a Frontend/Backend application with basic CRUD features, developed using Spring Boot and it interrogates a PostgreSQL database.
You can access the website here

In this part, we will focus on the three pillars of Observability:
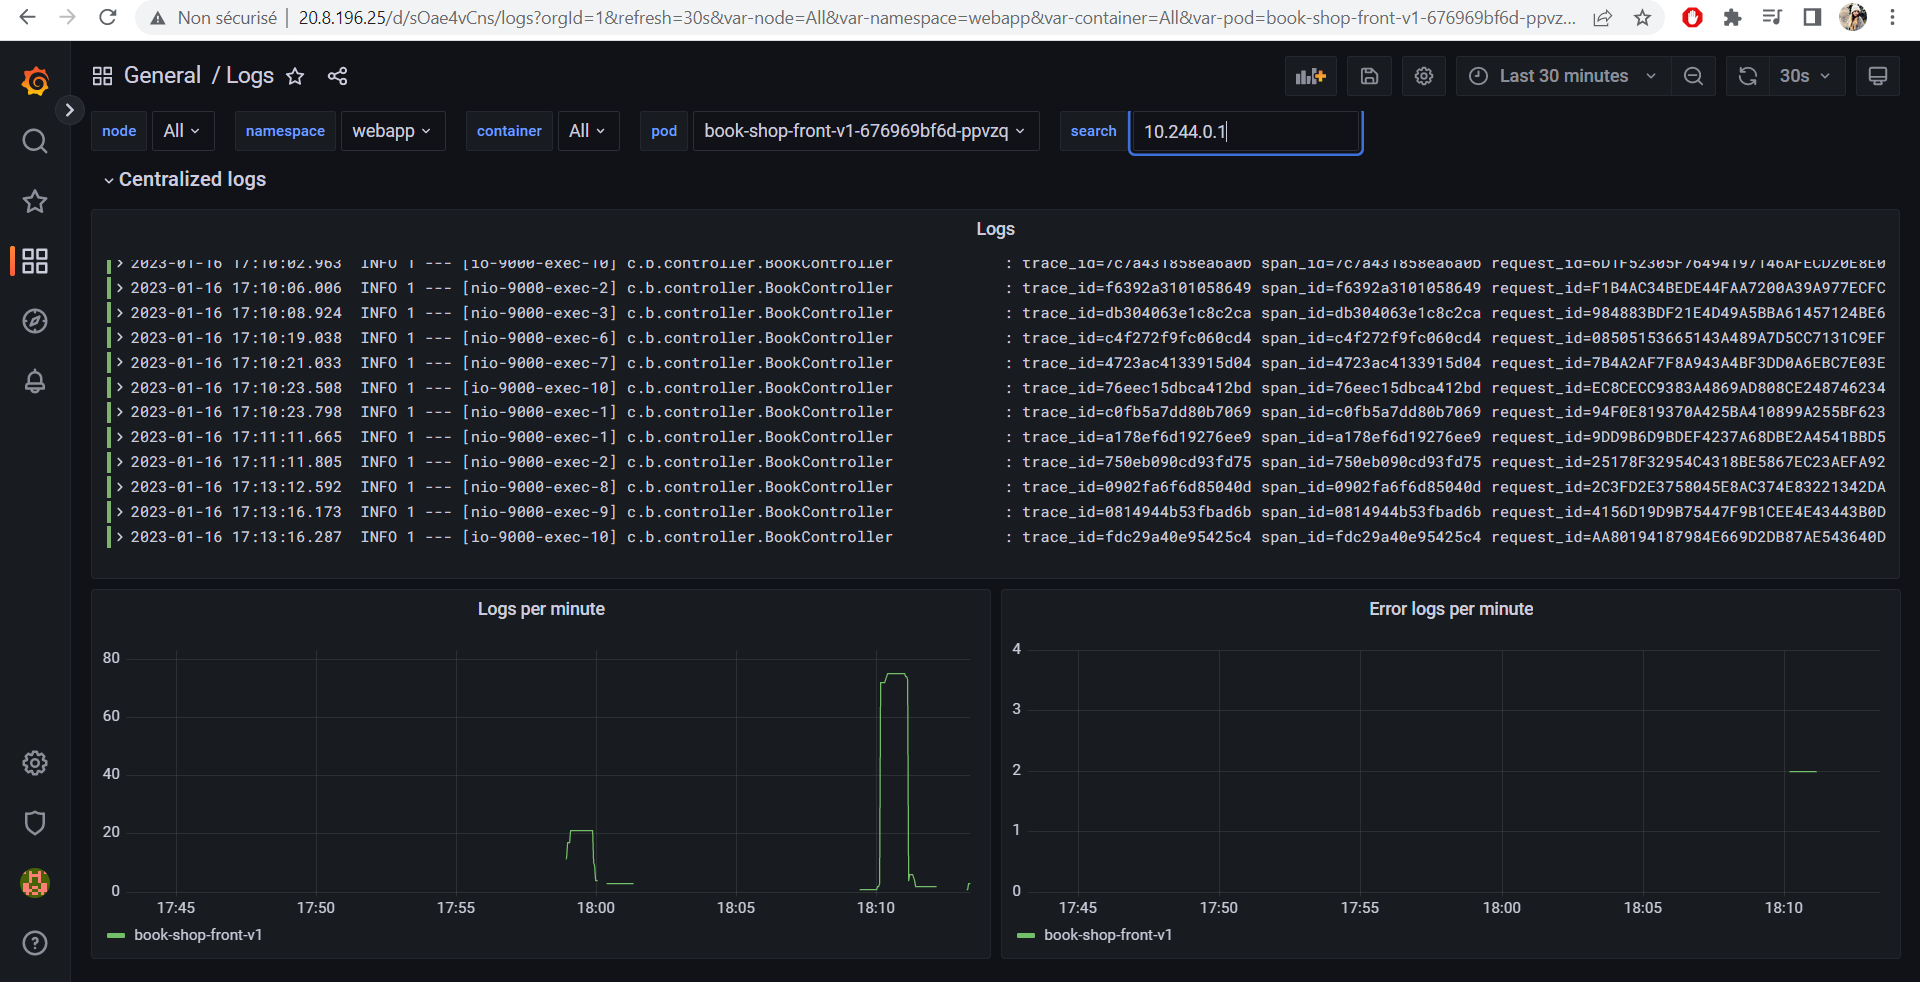
I used Apache Log4j to enable logging in my application.
I made sure to add the request_id and the ip_address in every log so that it can help us while debugging.
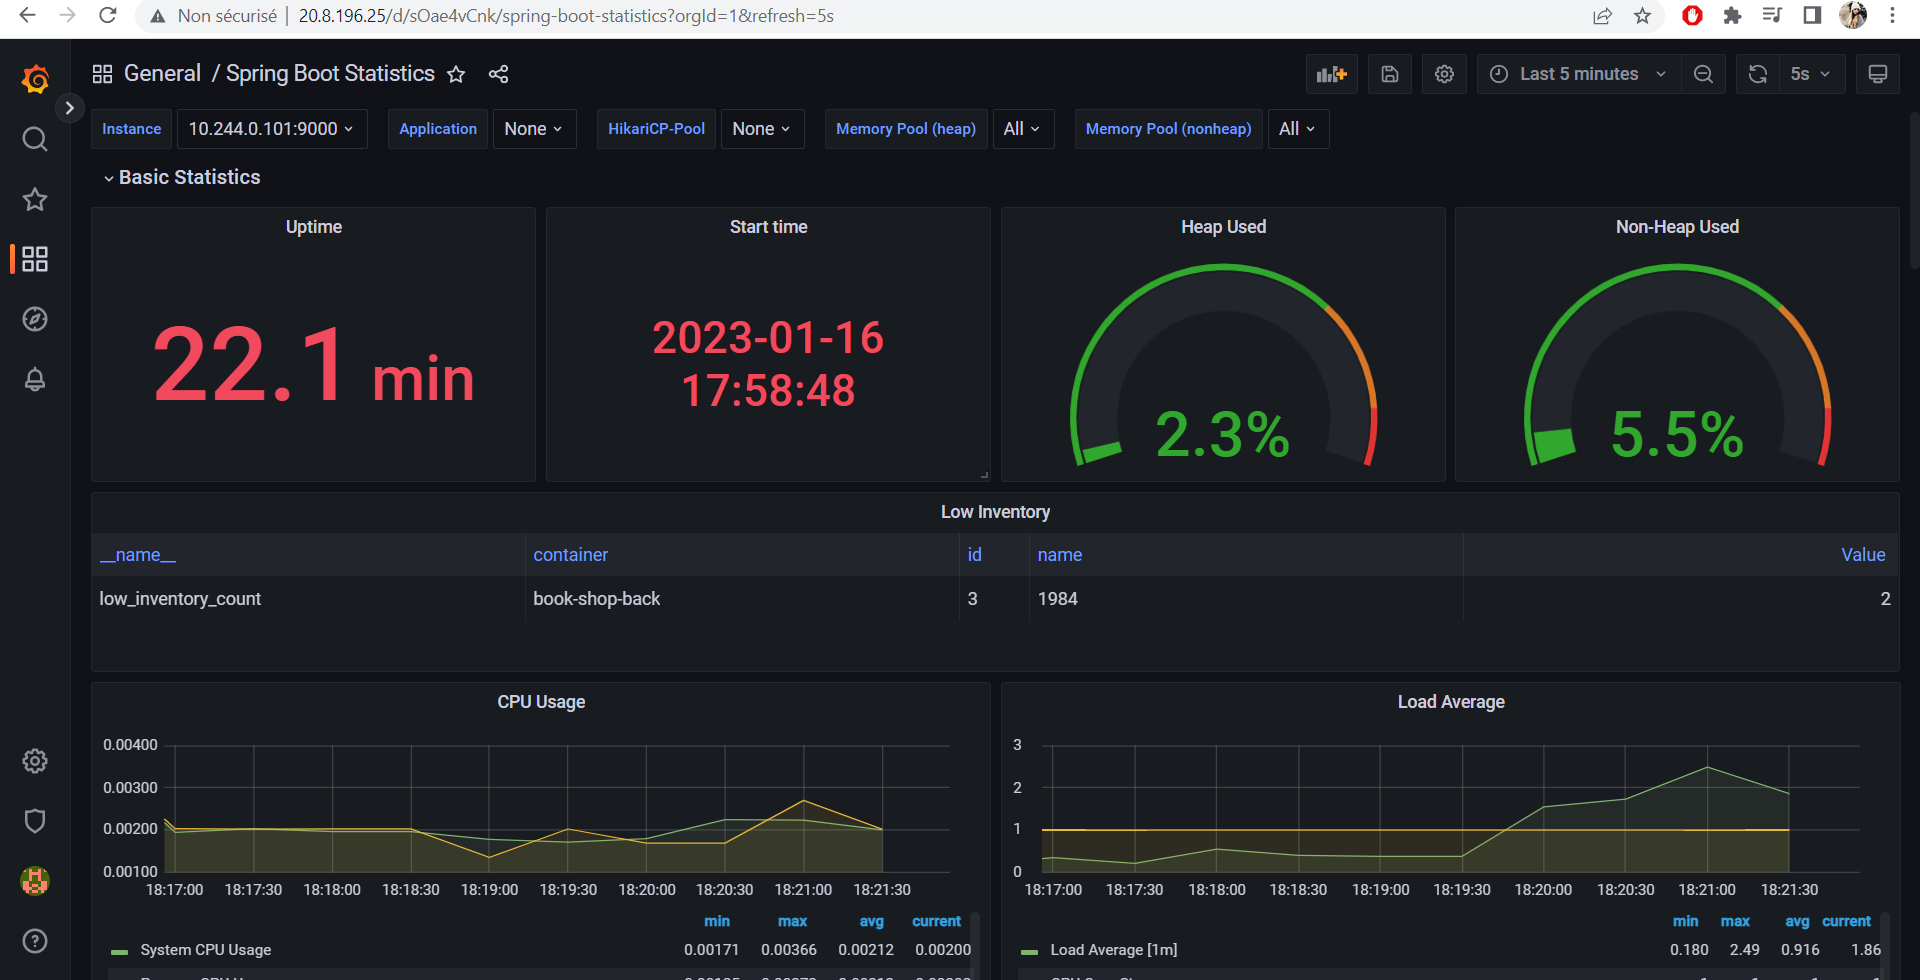
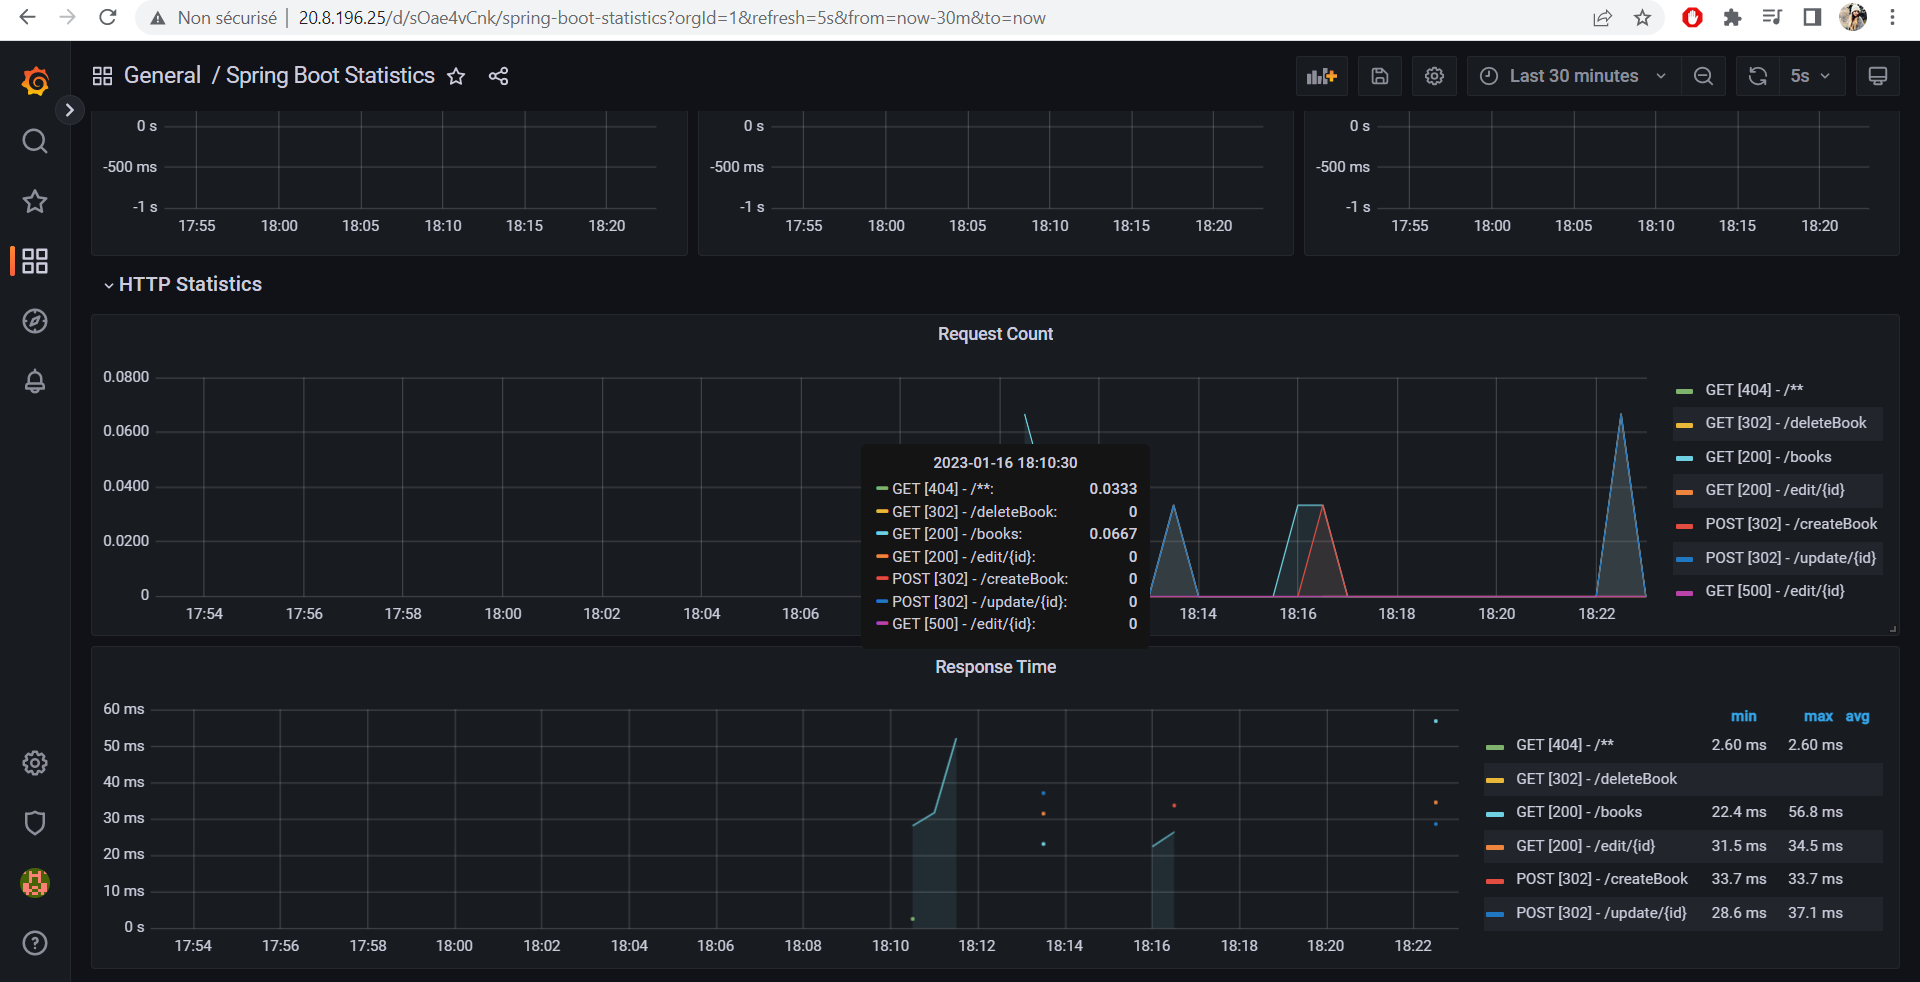
I used Spring Boot Actuator which exposes metrics to be pulled by Prometheus.
Behind the hoods, Spring Boot Actuator uses Micrometer to instrument and capture different metrics from the code, such as: JVM Memory usage, CPU usage, Connection Pool information, HTTP requests and so on.
Business logic metrics : I added a custom metric which is low.inventory.count. Basically after each creation/update of a book in The Book Shop, a query is run to check for books with inventory count lower than 3. The resulting books are shown in a dimensional Gauge with 2 different tags : the book id and the book title so that way we can track and restock those books.
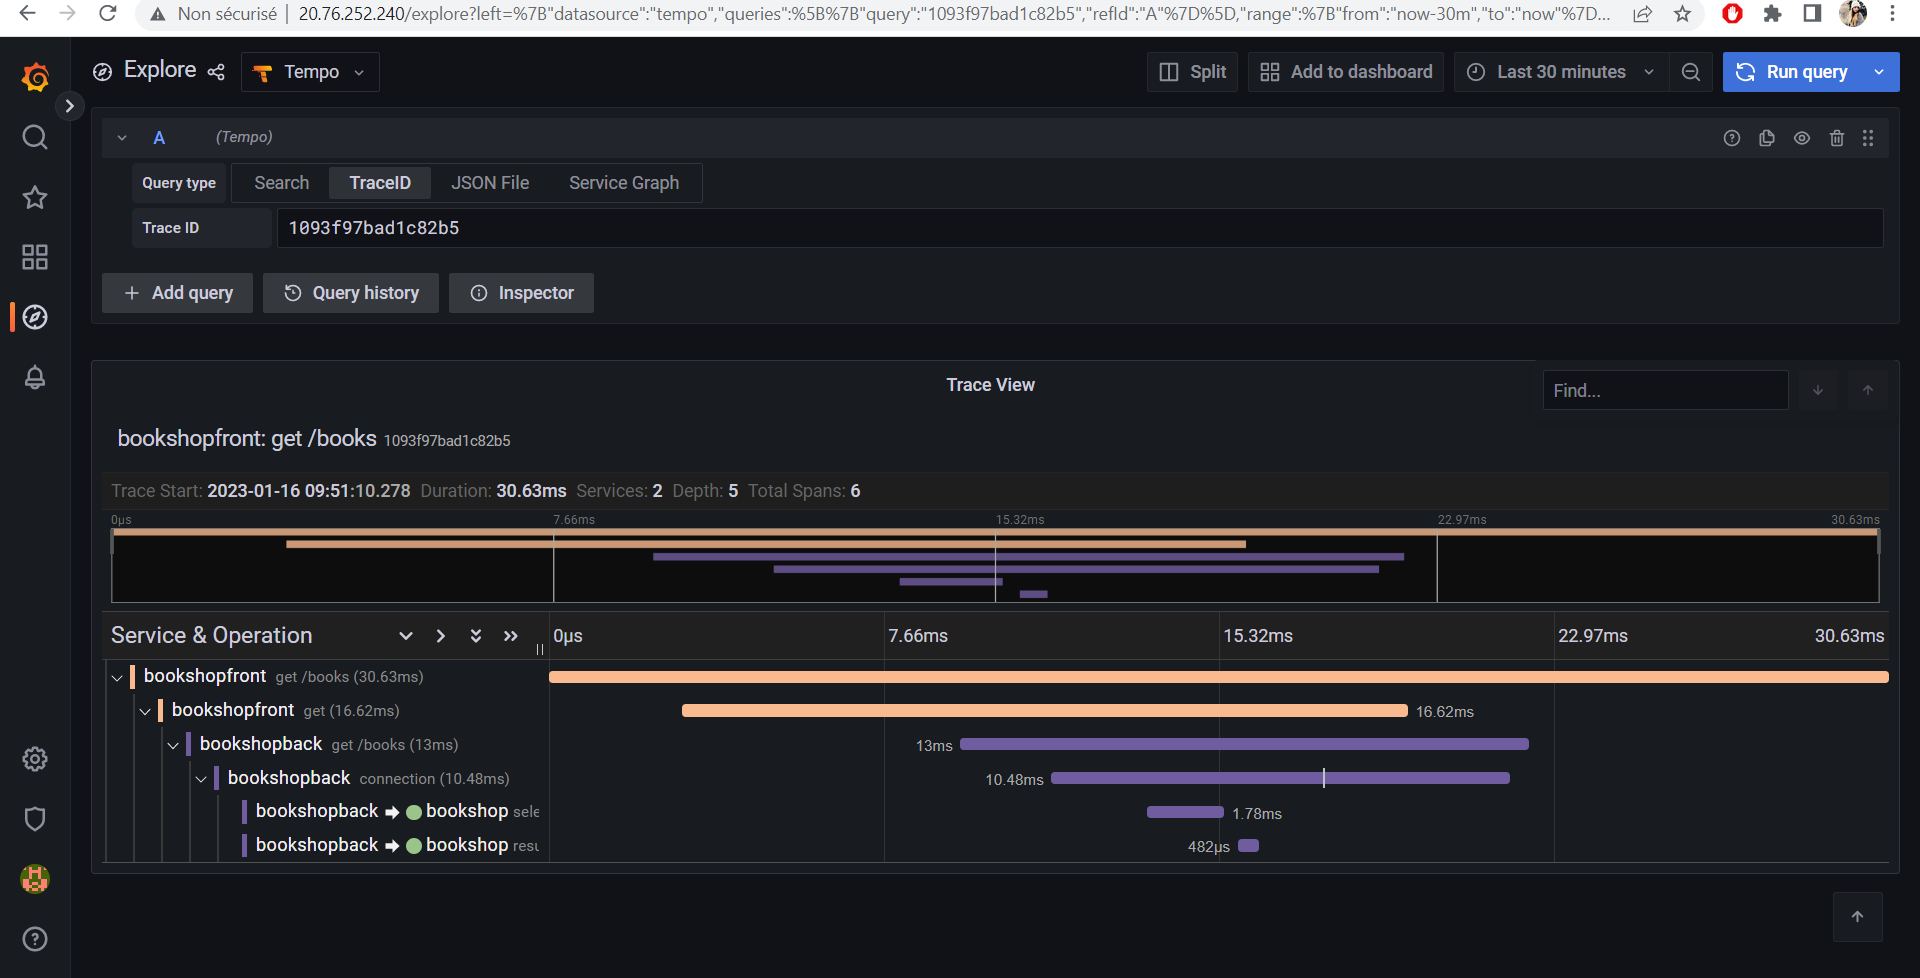
I used Spring Cloud Sleuth which provides Spring Boot auto-configuration for distributed tracing.
I added spring-cloud-sleuth-zipkin so that the app will generate and report Zipkin-compatible traces via HTTP.
The span_id and the trace_id are shown in each logs for both Backend and Frontend.
In this part, we will focus on 3 parts:
1. Automated infrastructure provisioning using well isolated and maintainable infrastructure layers (Microstacks)
I used Terraform to build 3 microstacks:
-
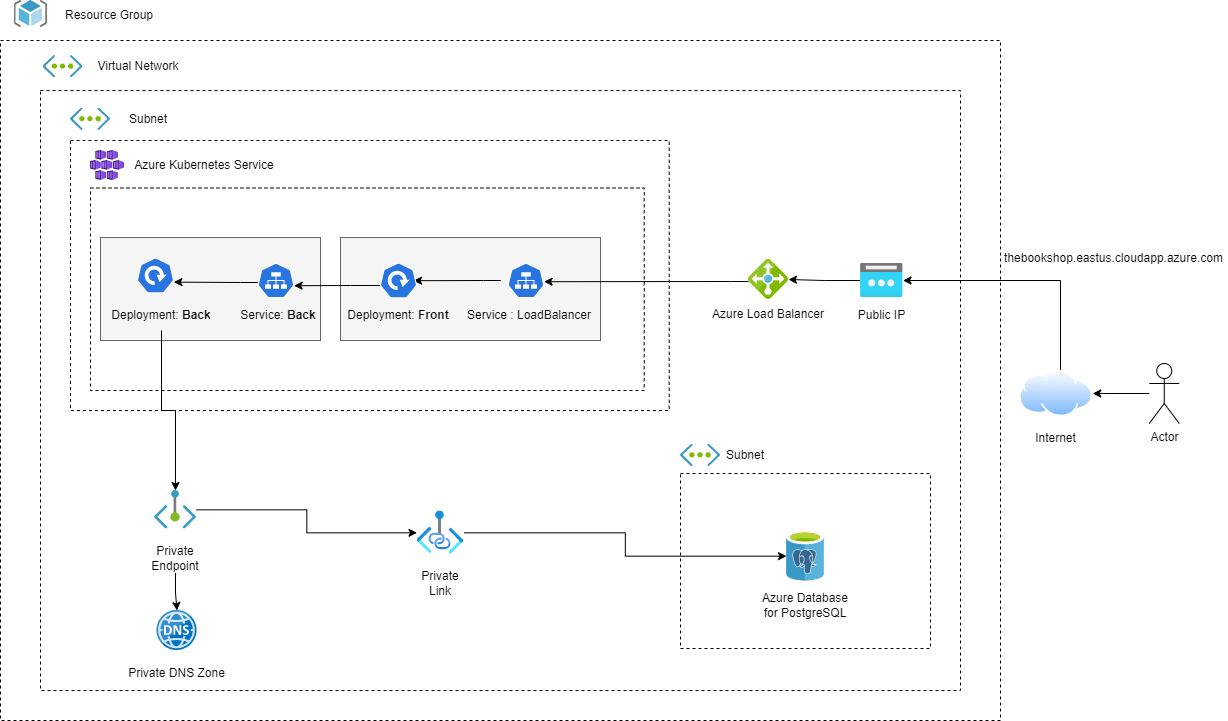
First Stack : Database and Networking : here I provisioned the Azure Database for PostgreSQL server and database for our webapp. I also created a Virtual Network and a Subnet where our webapp will run and linked it to the database using Azure Private Link and a Private DNS for the PostgreSQL server.
-
Second Stack : Kubernetes Cluster : here I provisioned an AKS cluster whithin the subnet created earlier ( and resource group as well ).
-
Third Stack : Monitoring Setup : here I created the monitoring setup for our webapp using Kubernetes provider as well as Helm provider. This Stack will create a Kubernetes namespace for our monitoring setup then using Helm, it will install the Prometheus Stack, Loki Stack (with Grafana), Tempo, Postgresql-exporter to monitor our PostgreSQL server and Argo cd ( will be used in the next step ). For organization, I split those different charts into 4
modulesso we can reuse them whenever.
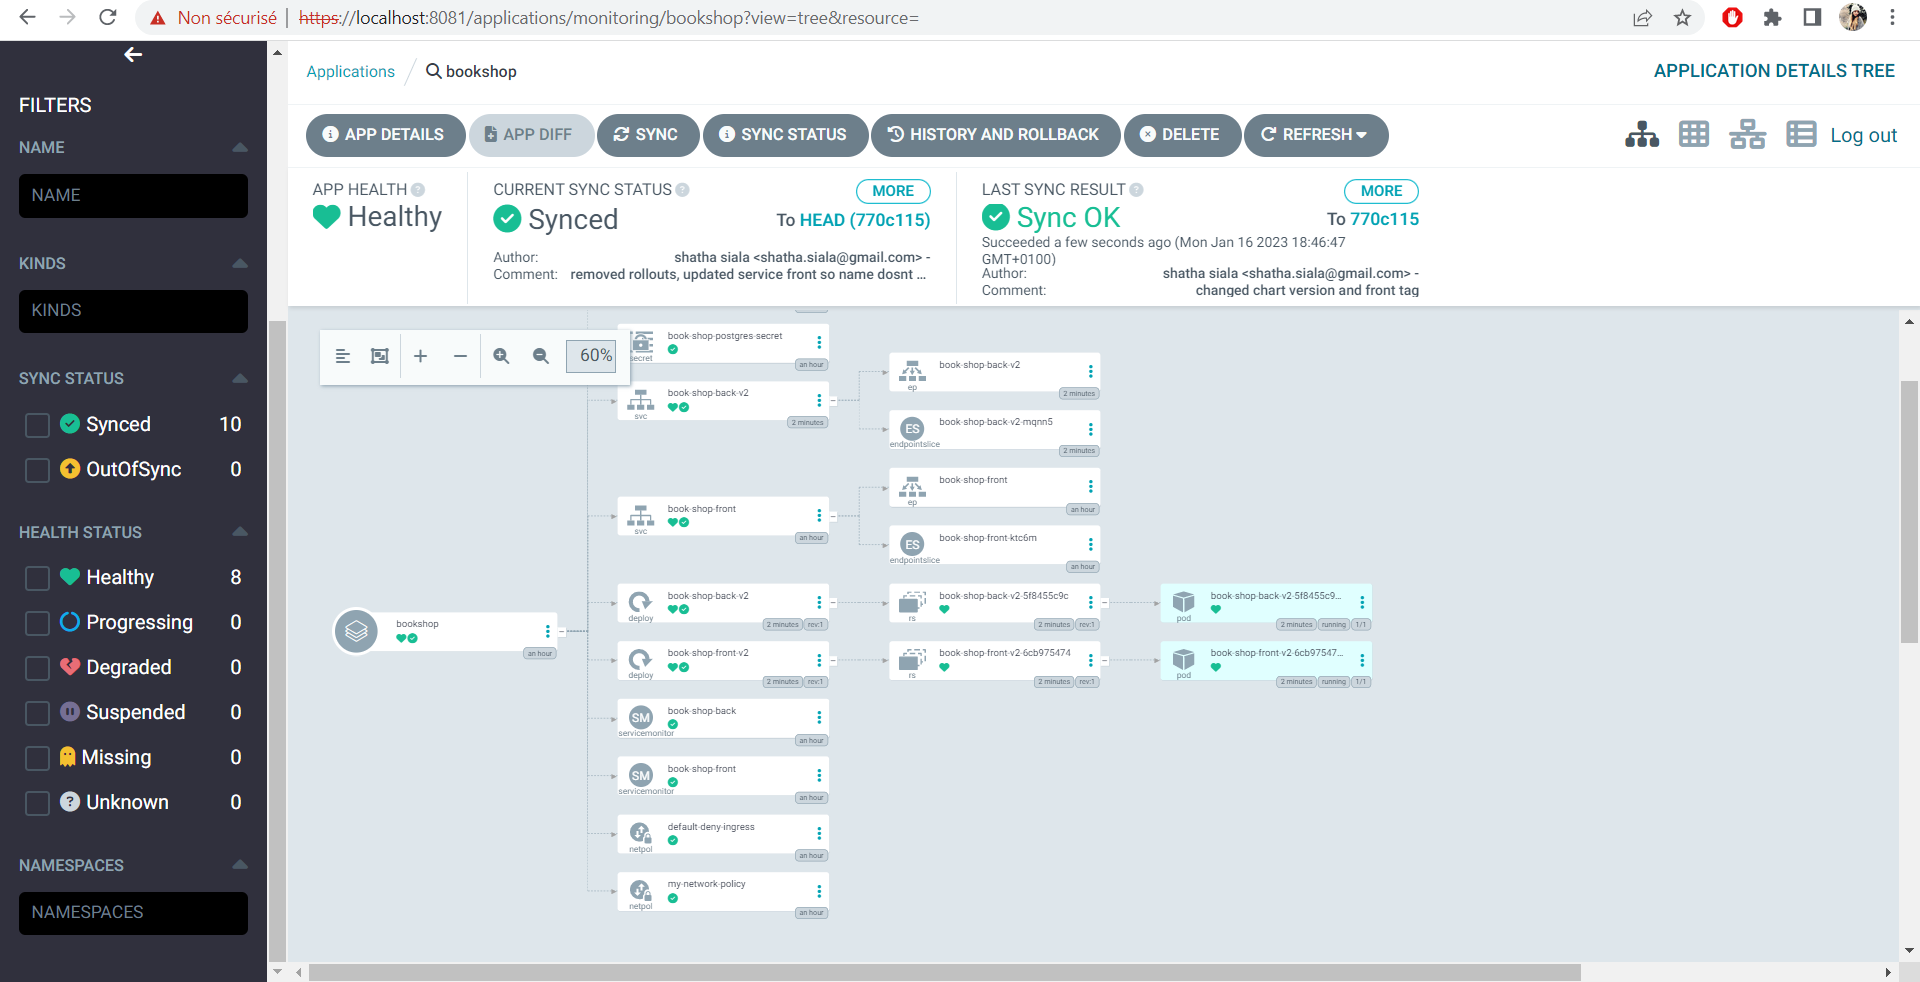
To automate the deployment of my webapp, I created a Helm Chart for it which will be used by Argo CD for deployment. Basically each time argo cd detects a change in the chart in thhis repo, it will automatically synchronize the web app thus resulting in automated deployment.
To be noted, we can multiple additional labels to a deployment, we can change the image name and/or tag, we can specify the number of replicas, and the list goes on. You can see the values you can change in the values.yaml file.
I used Argo CD to automate deployment of my chart from my github repo.
To be able to use myltiple environments at once, I added a version label in my deployments and services as well as for selectors. This can be used to match pods to deployments or a deployment to a service not only by the app name but now also with the version.
This will come in handy in the next steps.
We will be building both Back and Front using Docker then we will use Kubernetes in the deployment.
This is the architecture for the Monitoring setup :
I used Helm Charts to deploy it.
I decided to use the Blue/Green deployment strategy since it gives us instant rollout/rollback and the quantity of ressources isn't really a big issue since I'm using the cloud.
This can easily work with Argo CD. Basically when we change the version and synch the application (without choosing the prune option) it will create all the kubernetes resources with the new version ( since the version is contained in the name of the resources, except for the front service).
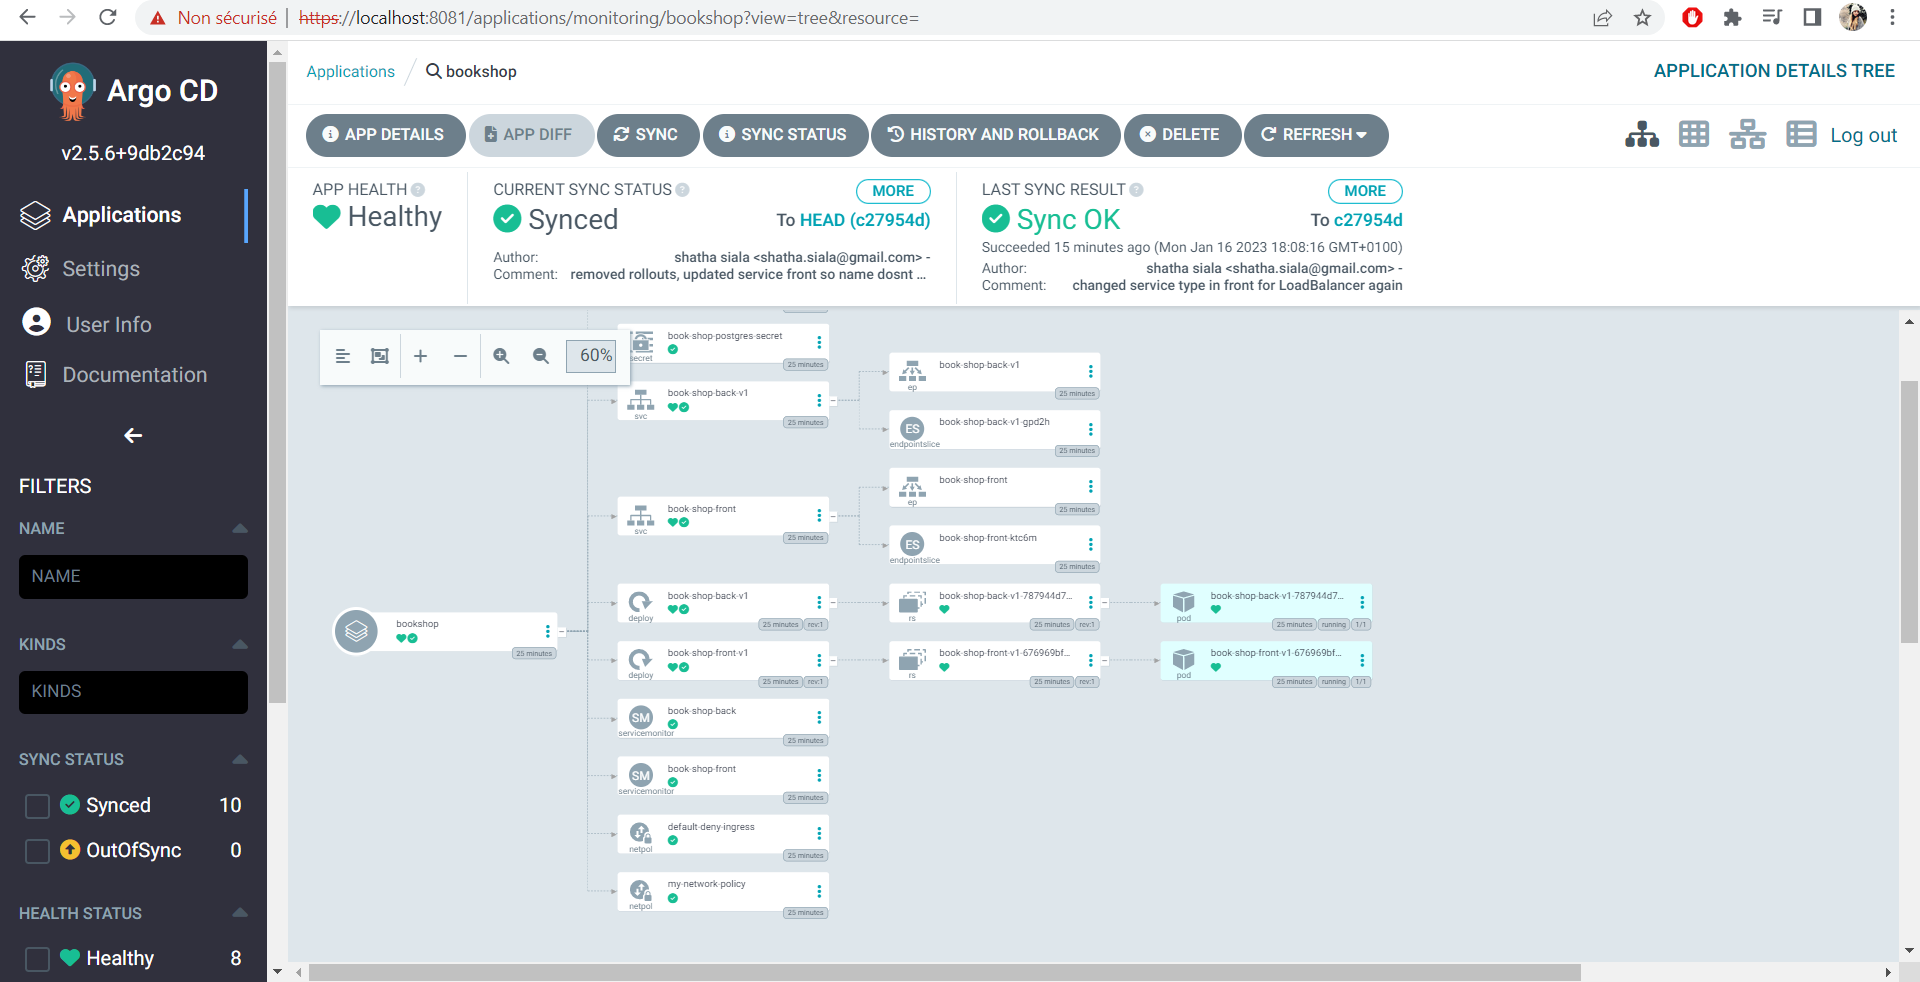
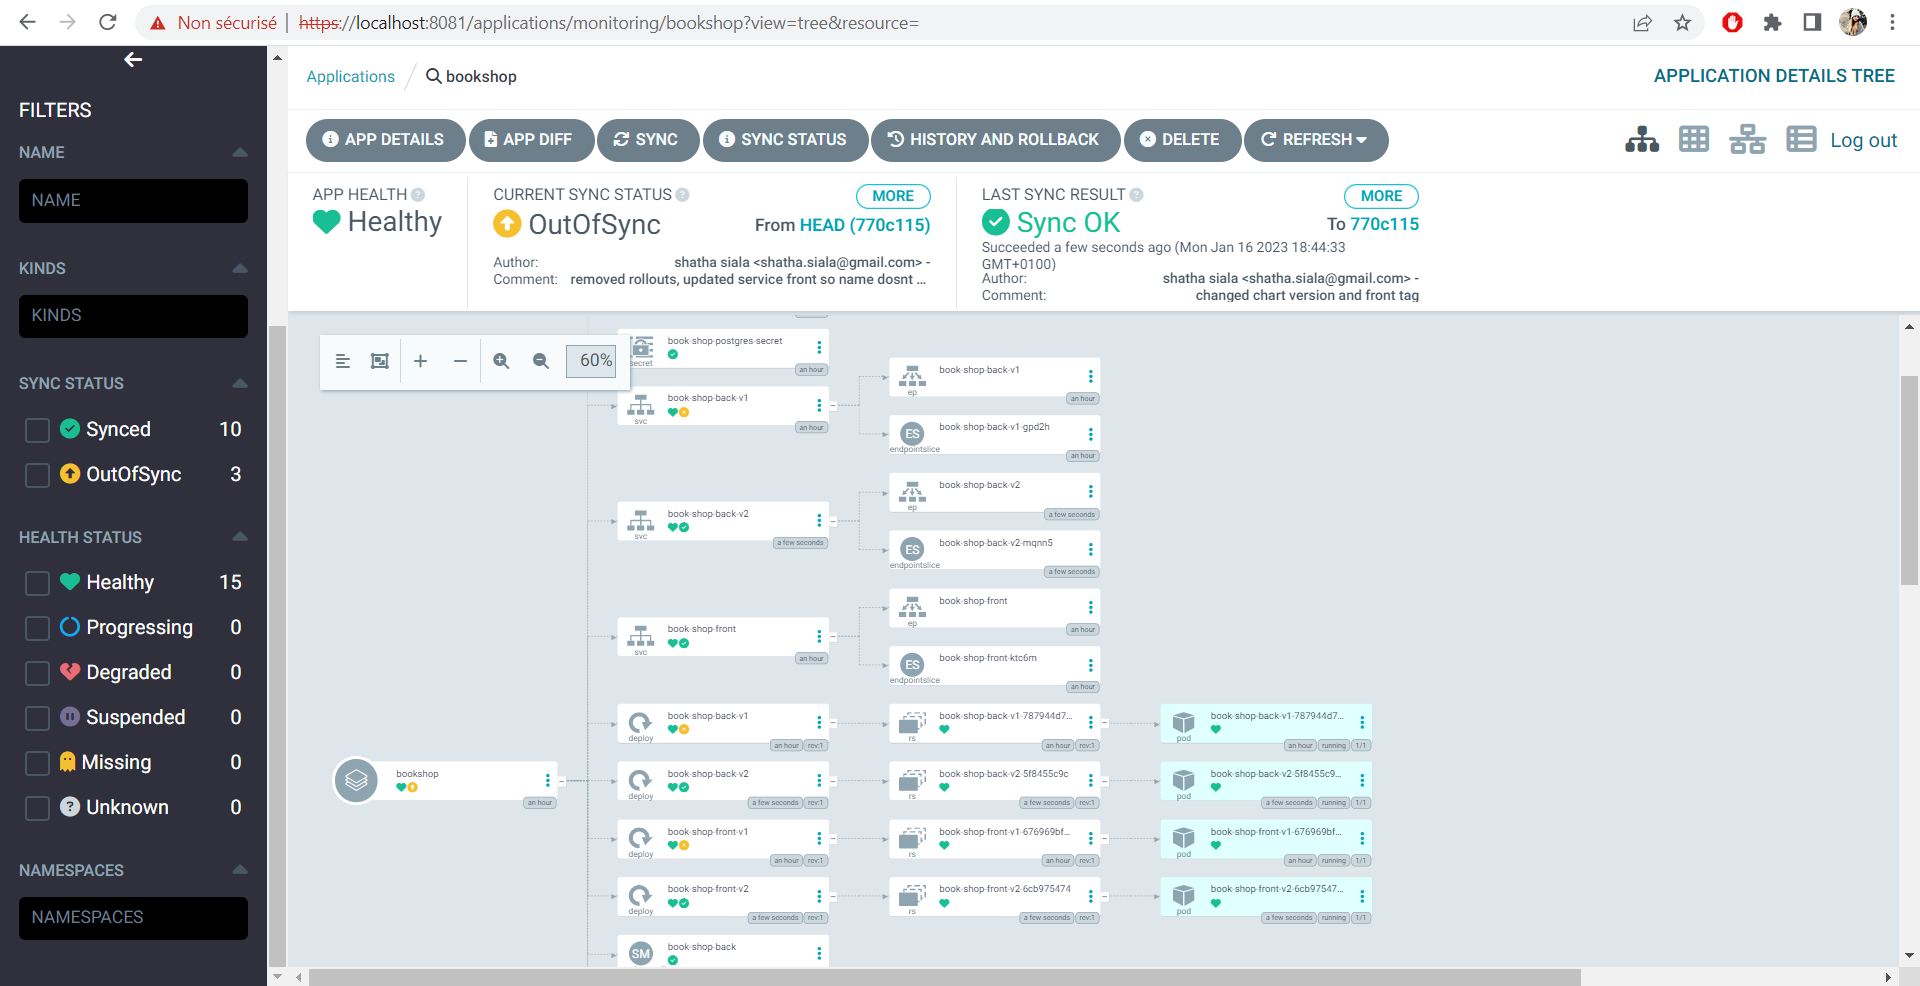
The front will be updated with the new version label, so it will redirect traffic to the new deployment.
After that, we can simply synch the application but this time with the prune option so that the old versioned resources would be deleted.