English | 简体中文
![]()


G6 is a graph visualization engine, which provides a set of basic mechanisms, including rendering, layout, analysis, interaction, animation, and other auxiliary tools. G6 aims to simplify the relationships, and help people to obtain the insight of relational data. Developers are able to build graph visualization analysis applications or graph visualization modeling applications easily.


- Abundant Built-in Items: Nodes and edges with free configurations;
- Steerable Interactions: More than 10 basic interaction behaviors ;
- Powerful Layout: More than 10 layout algorithms;
- Convenient Components: Outstanding ability and performance;
- Friendly User Experience: Complete documents for different levels of user requirements. TypeScript supported.
G6 concentrates on the principle of 'good by default'. In addition, the custom mechanism of the item, interation behavior, and layout satisfies the customazation requirements.
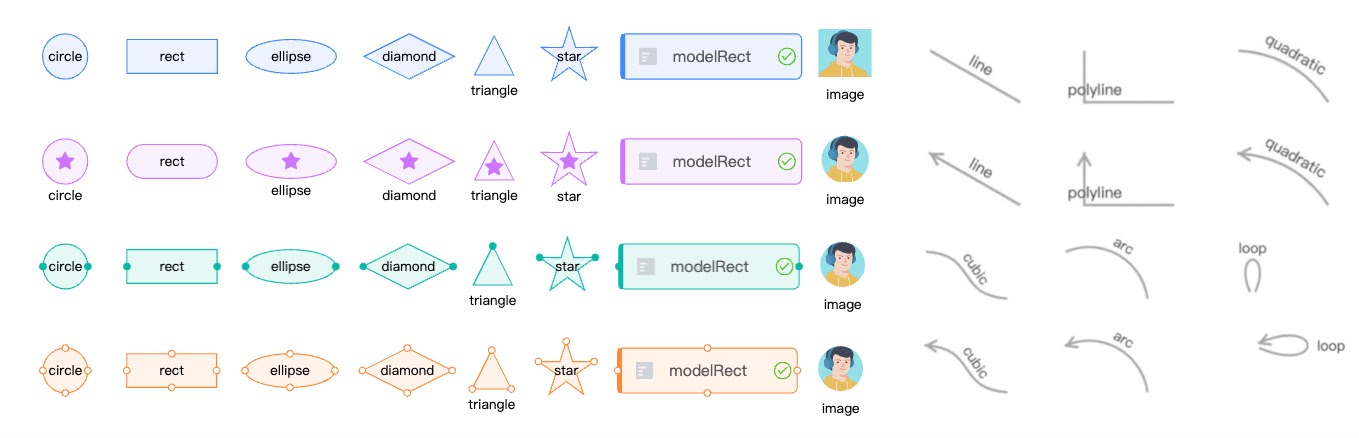
Abundant Built-in Items
$ npm install @antv/g6
import G6 from '@antv/g6';

const data = {
  nodes: [
    {
      id: 'node1',
      label: 'Circle1',
      x: 150,
      y: 150,
    },
    {
      id: 'node2',
      label: 'Circle2',
      x: 400,
      y: 150,
    },
  ],
  edges: [
    {
      source: 'node1',
      target: 'node2',
    },
  ],
};

const graph = new G6.Graph({
  container: 'container',
  width: 500,
  height: 500,
  defaultNode: {
    type: 'circle',
    size: [100],
    color: '#5B8FF9',
    style: {
      fill: '#9EC9FF',
      lineWidth: 3,
    },
    labelCfg: {
      style: {
        fill: '#fff',
        fontSize: 20,
      },
    },
  },
  defaultEdge: {
    style: {
      stroke: '#e2e2e2',
    },
  },
});

graph.data(data);
graph.render();
For more information of the usage, please refer to Getting Started.
# install dependencies (with pnpm)
pnpm install

# build
pnpm build

# start the dev server
pnpm start

# if you wanna watch one of the packages, e.g. packages/core
$ cd ./packages/core
$ npm run watch

# run test case
$ npm test

# run test case in watch mode
npm test -- --watch ./tests/unit/algorithm/find-path-spec
DEBUG_MODE=1 npm test -- --watch ./tests/unit/algorithm/find-path-specFor React project integration, we have an independent product recommendation: Graphin, which is a toolkit based on G6 and React, that focuses on relational visual analysis. It's simple, efficient, out of the box.
At present, Graphin has good practices in business graph analysis projects. For details, see 《Who uses Graphin》
Welcome to join the G6 Communication Group. We also welcome the github issues.
- DingTalk Group: 30088652
- WeChat Group: Add WeChat AntVG6 to join the group

Please let us know what you are you going to help. Do check out issues for bug reports or suggestions first.