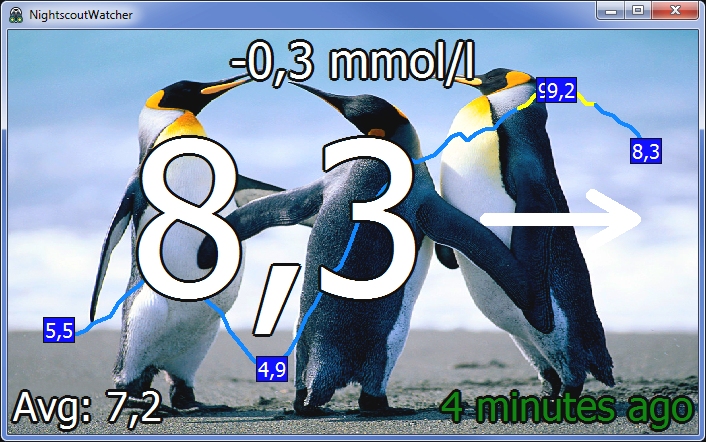
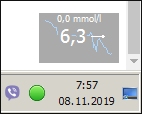
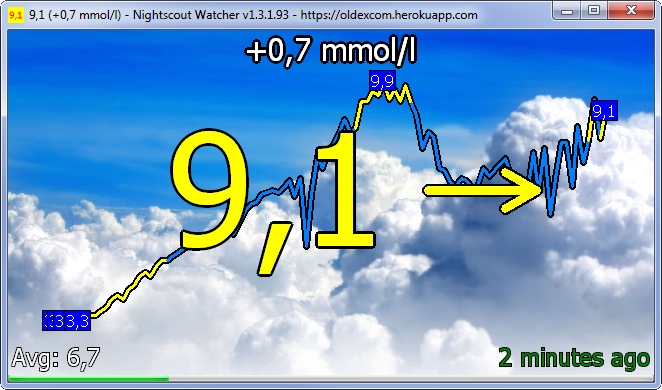
The main purpose of the application is to show glucose level on your monitor in background mode to control glucose level in more convenient way. It's especially convinent for office workers who spend a lot of time working on computer.
App receives TSV-data about blood sugar level by requesting url like this: http://oldexcom.herokuapp.com/api/v1/entries/sgv?count=3000&find[dateString][$gte]=2019-11-16T01:00:00
You are always welcome to connect to this open source project by helping of any kind (e.g. testing, programming, spelling and etc.). Don't be hesitating if you notice something that can help to improve this project. Just write me an issue. PS. I'm not a native English speaker. I'll be grateful if you participate in correction of mistakes.
- The main prerequisite is availability of your own nightscout site.
- Blood sugar level data from your CGM must be sent to Nightscout site (for instance through xDrip+)
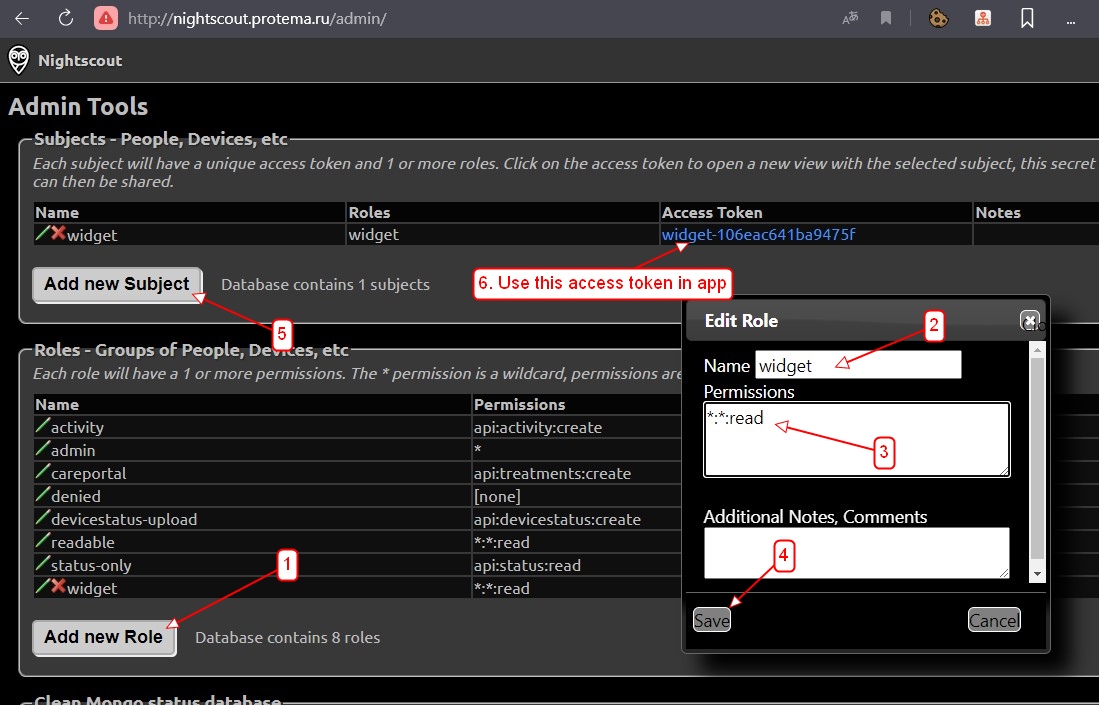
- Log in to the admin panel of your Nightscout site (e.g. https://nightscout.somedomain.com/admin/)
- Create a new role using the pattern
*:*:read - Create a new subject using role created in step 2
- Use generated access token of the role in application window "Source settings"
- Download installer (only win64 version is available)
- Install and start executable
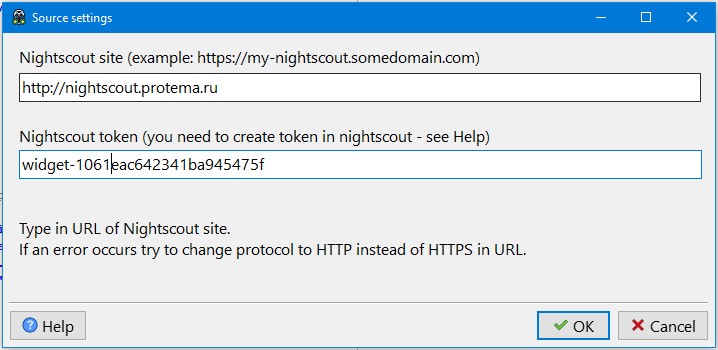
- Type in url and access token of your Nightscout site
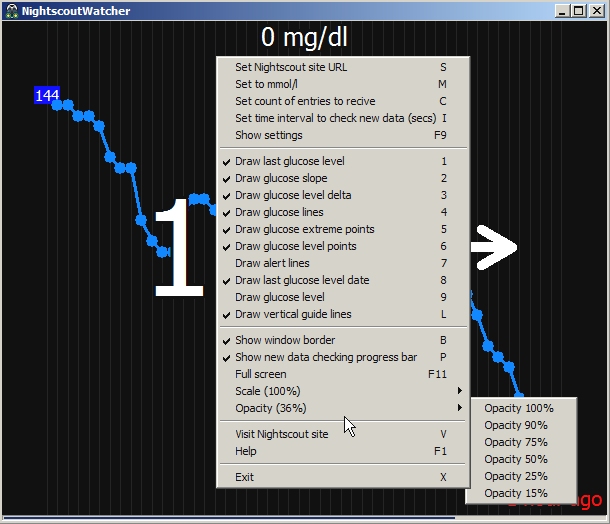
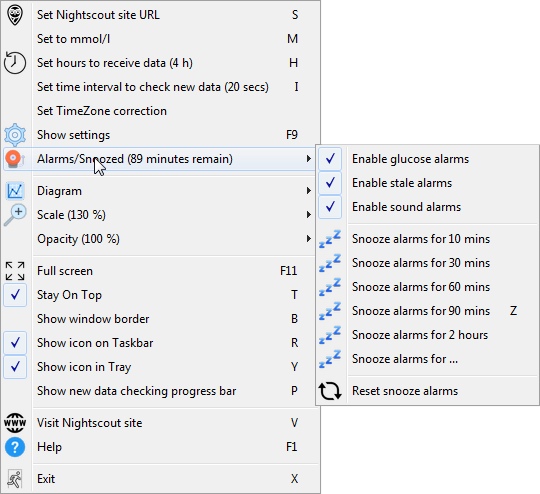
 A lot of hot keys are available in then main window.
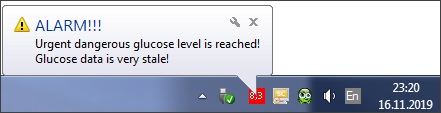
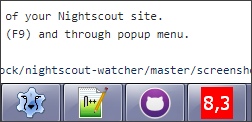
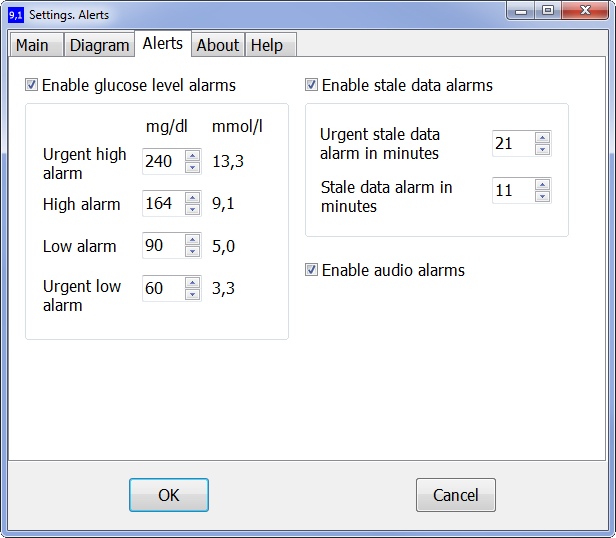
When glucose level is going to be high or data from site is stale the alarms appear. Last glucose level and stale indicator start blinking. Depending on settings it can also be blinking tray icon with balloon hint or blinking icon on Taskbar. Sound alarms are the same as in the nightscout (disabled by default). You can snooze all alarms by popup menu and click snooze alarms or just hit Z key.
After start the application you must type in the url of your Nightscout site. All available settings are placed on settings window (F9) and through popup menu.
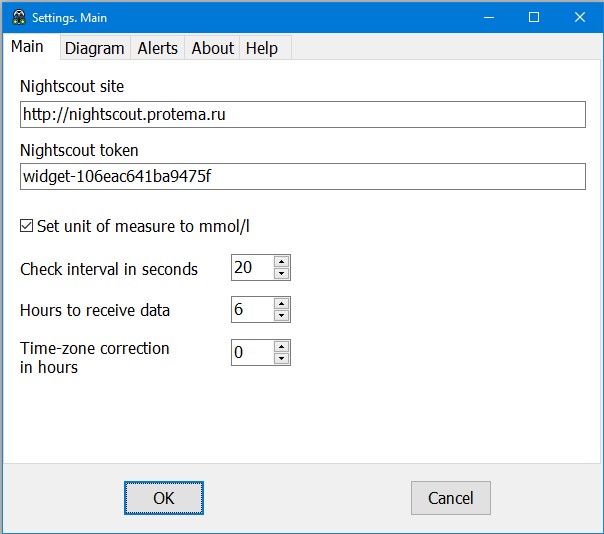
The main settings are:
- Nightscout site URL (required field)
- Unit of measure (mmol/l or mg/dl). Mg/dl is used by default.
- Time interval to check new data (in seconds)
- Hours to receive data
- Time-zone correction in hours
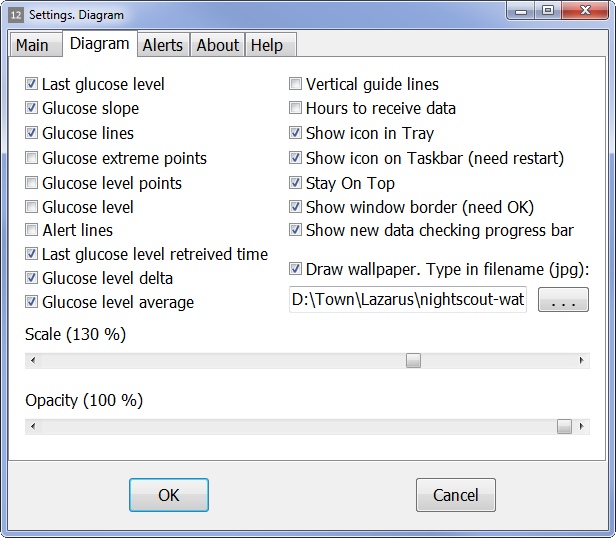
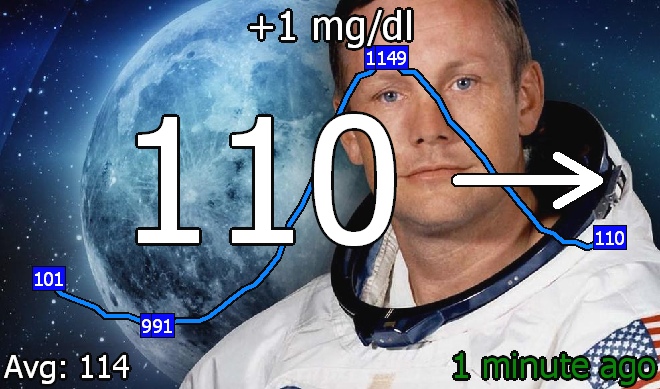
It allows to set up different glucose data to show on diagram such as:
- Last glucose level
- Glucose slope
- Glucose lines
- Glucose extreme points
- Glucose level points
- Glucose level
- Alert lines
- Last glucose level retrieved time
- Glucose level delta
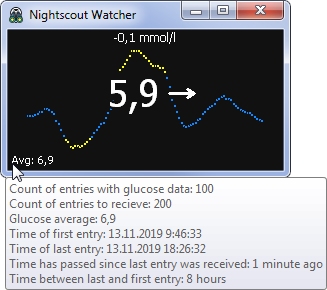
- Glucose average
- Vertical guide lines
- Wallpaper (jpeg only)
You can change Scale of diagram elements by Mouse Wheel.
- Show icon in Tray (Y)
- Show icon on Taskbar (R)
- Stay window on top (T)
- Show window border (B)
- Make window full screen (F11)
- Show new data checking progress bar ( P )
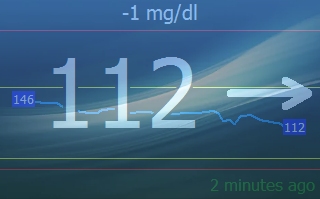
- Window opacity
-
LEFT/RIGHT/UP/DOWN – Move window on the screen
-
SHIFT + LEFT/RIGHT/UP/DOWN/MouseWheel – Resize window
-
ALT + UP/DOWN/MouseWheel – Increase/Decrease window opacity
-
CTRL + UP/DOWN or CTRL + PLUS/MINUS or MouseWheel – Increase/Decrease scale
-
CTRL + 0 - Set scale to 100%
-
RightClick – Show popup menu
-
S – Set Nightscout site URL
-
M – Set unit of measure to mmol/l
-
H – Set hours to receive data from site
-
I – Set time interval of new data checking
-
F9 - Show settings window
-
1 – Draw latest glucose level value
-
2 – Draw glucose slope
-
3 – Draw glucose level delta
-
4 – Draw glucose lines
-
5 – Draw glucose extreme points
-
6 – Draw glucose level points
-
7 – Draw alert lines
-
8 – Draw spent time since last glucose level data was received
-
9 – Draw glucose level values
-
W – Draw wallpaper
-
A – Draw average glucose level
-
L – Draw vertical guidelines
-
E – Draw hours to receive data
-
T – Stay window on top
-
B – Show window border
-
P – Show new data checking progress bar
-
F11 – Show in full screen
-
Z - Snooze alarms for 10 (or last chosen snooze period) minutes
-
V/DoubleClick – Visit your Nightscout site
-
F1 - This help
-
X - Exit
It is written on Lazarus and can be compiled on Windows, Linux, OS X, Android operating systems.