Это старт-кит для использования систем мониторинга в кластере docker-swarm Prometheus, Grafana, cAdvisor, Node Exporter, Alert Manager and Unsee.
Клонируем этот репозиторий
$ git clone https://github.com/Segate-ekb/monitoring.git
$ cd monitoring
ADMIN_USER=admin \
ADMIN_PASSWORD=admin \
docker stack deploy -c docker-compose.yml monitoring
Требования:
- Docker CE 17.09.0-ce or Docker EE 17.06.2-ee-3
- Swarm-кластер с минимум одним менеджером и воркером
- Необходимо добавить следующий код в /etc/docker/daemon.json на всех нодах
{
  "metrics-addr" : "0.0.0.0:9323",
  "experimental" : true
}
Список сервисов:
- prometheus
http://<swarm-ip>:9090 - grafana
http://<swarm-ip>:3000 - node-exporter
- cadvisor
- dockerd-exporter
- caddy
<!-TODO-!>Надо доперевести доку!
Navigate to http://<swarm-ip>:3000 and login with user admin password admin.
You can change the credentials in the compose file or
by supplying the ADMIN_USER and ADMIN_PASSWORD environment variables at stack deploy.
Swarmprom Grafana is preconfigured with two dashboards and Prometheus as the default data source:
- Name: Prometheus
- Type: Prometheus
- Url: http://prometheus:9090
- Access: proxy
After you login, click on the home drop down, in the left upper corner and you'll see the dashboards there.
Docker Swarm Nodes Dashboard

URL: http://<swarm-ip>:3000/dashboard/db/docker-swarm-nodes
This dashboard shows key metrics for monitoring the resource usage of your Swarm nodes and can be filtered by node ID:
- Cluster up-time, number of nodes, number of CPUs, CPU idle gauge
- System load average graph, CPU usage graph by node
- Total memory, available memory gouge, total disk space and available storage gouge
- Memory usage graph by node (used and cached)
- I/O usage graph (read and write Bps)
- IOPS usage (read and write operation per second) and CPU IOWait
- Running containers graph by Swarm service and node
- Network usage graph (inbound Bps, outbound Bps)
- Nodes list (instance, node ID, node name)
Docker Swarm Services Dashboard
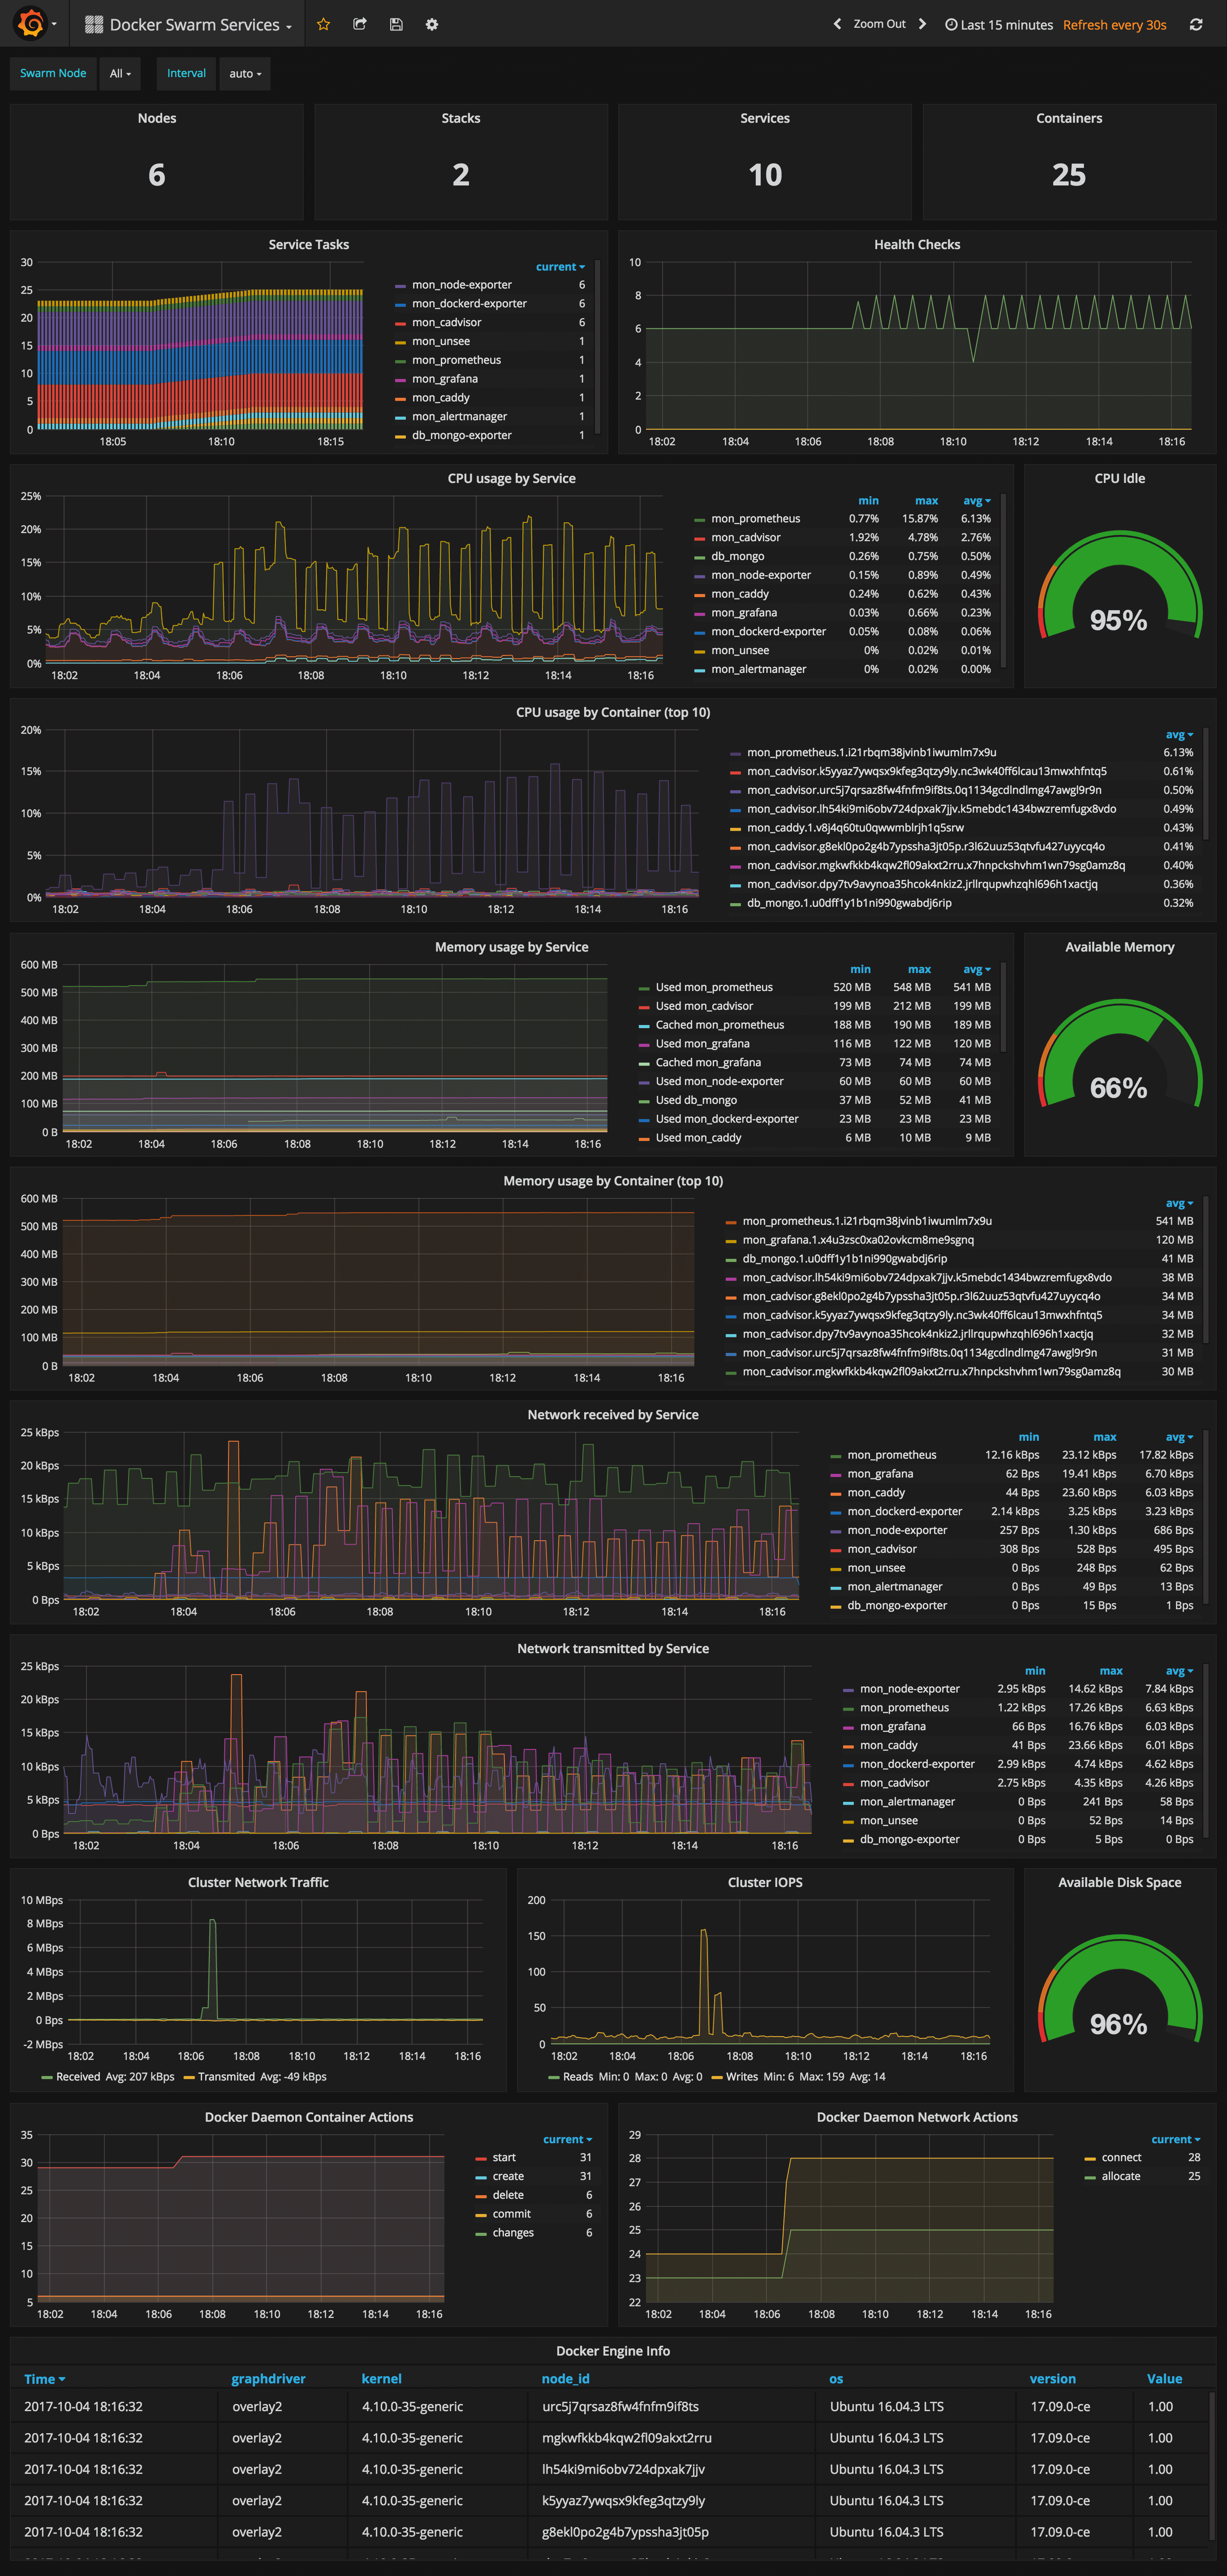
URL: http://<swarm-ip>:3000/dashboard/db/docker-swarm-services
This dashboard shows key metrics for monitoring the resource usage of your Swarm stacks and services, can be filtered by node ID:
- Number of nodes, stacks, services and running container
- Swarm tasks graph by service name
- Health check graph (total health checks and failed checks)
- CPU usage graph by service and by container (top 10)
- Memory usage graph by service and by container (top 10)
- Network usage graph by service (received and transmitted)
- Cluster network traffic and IOPS graphs
- Docker engine container and network actions by node
- Docker engine list (version, node id, OS, kernel, graph driver)
Prometheus Stats Dashboard
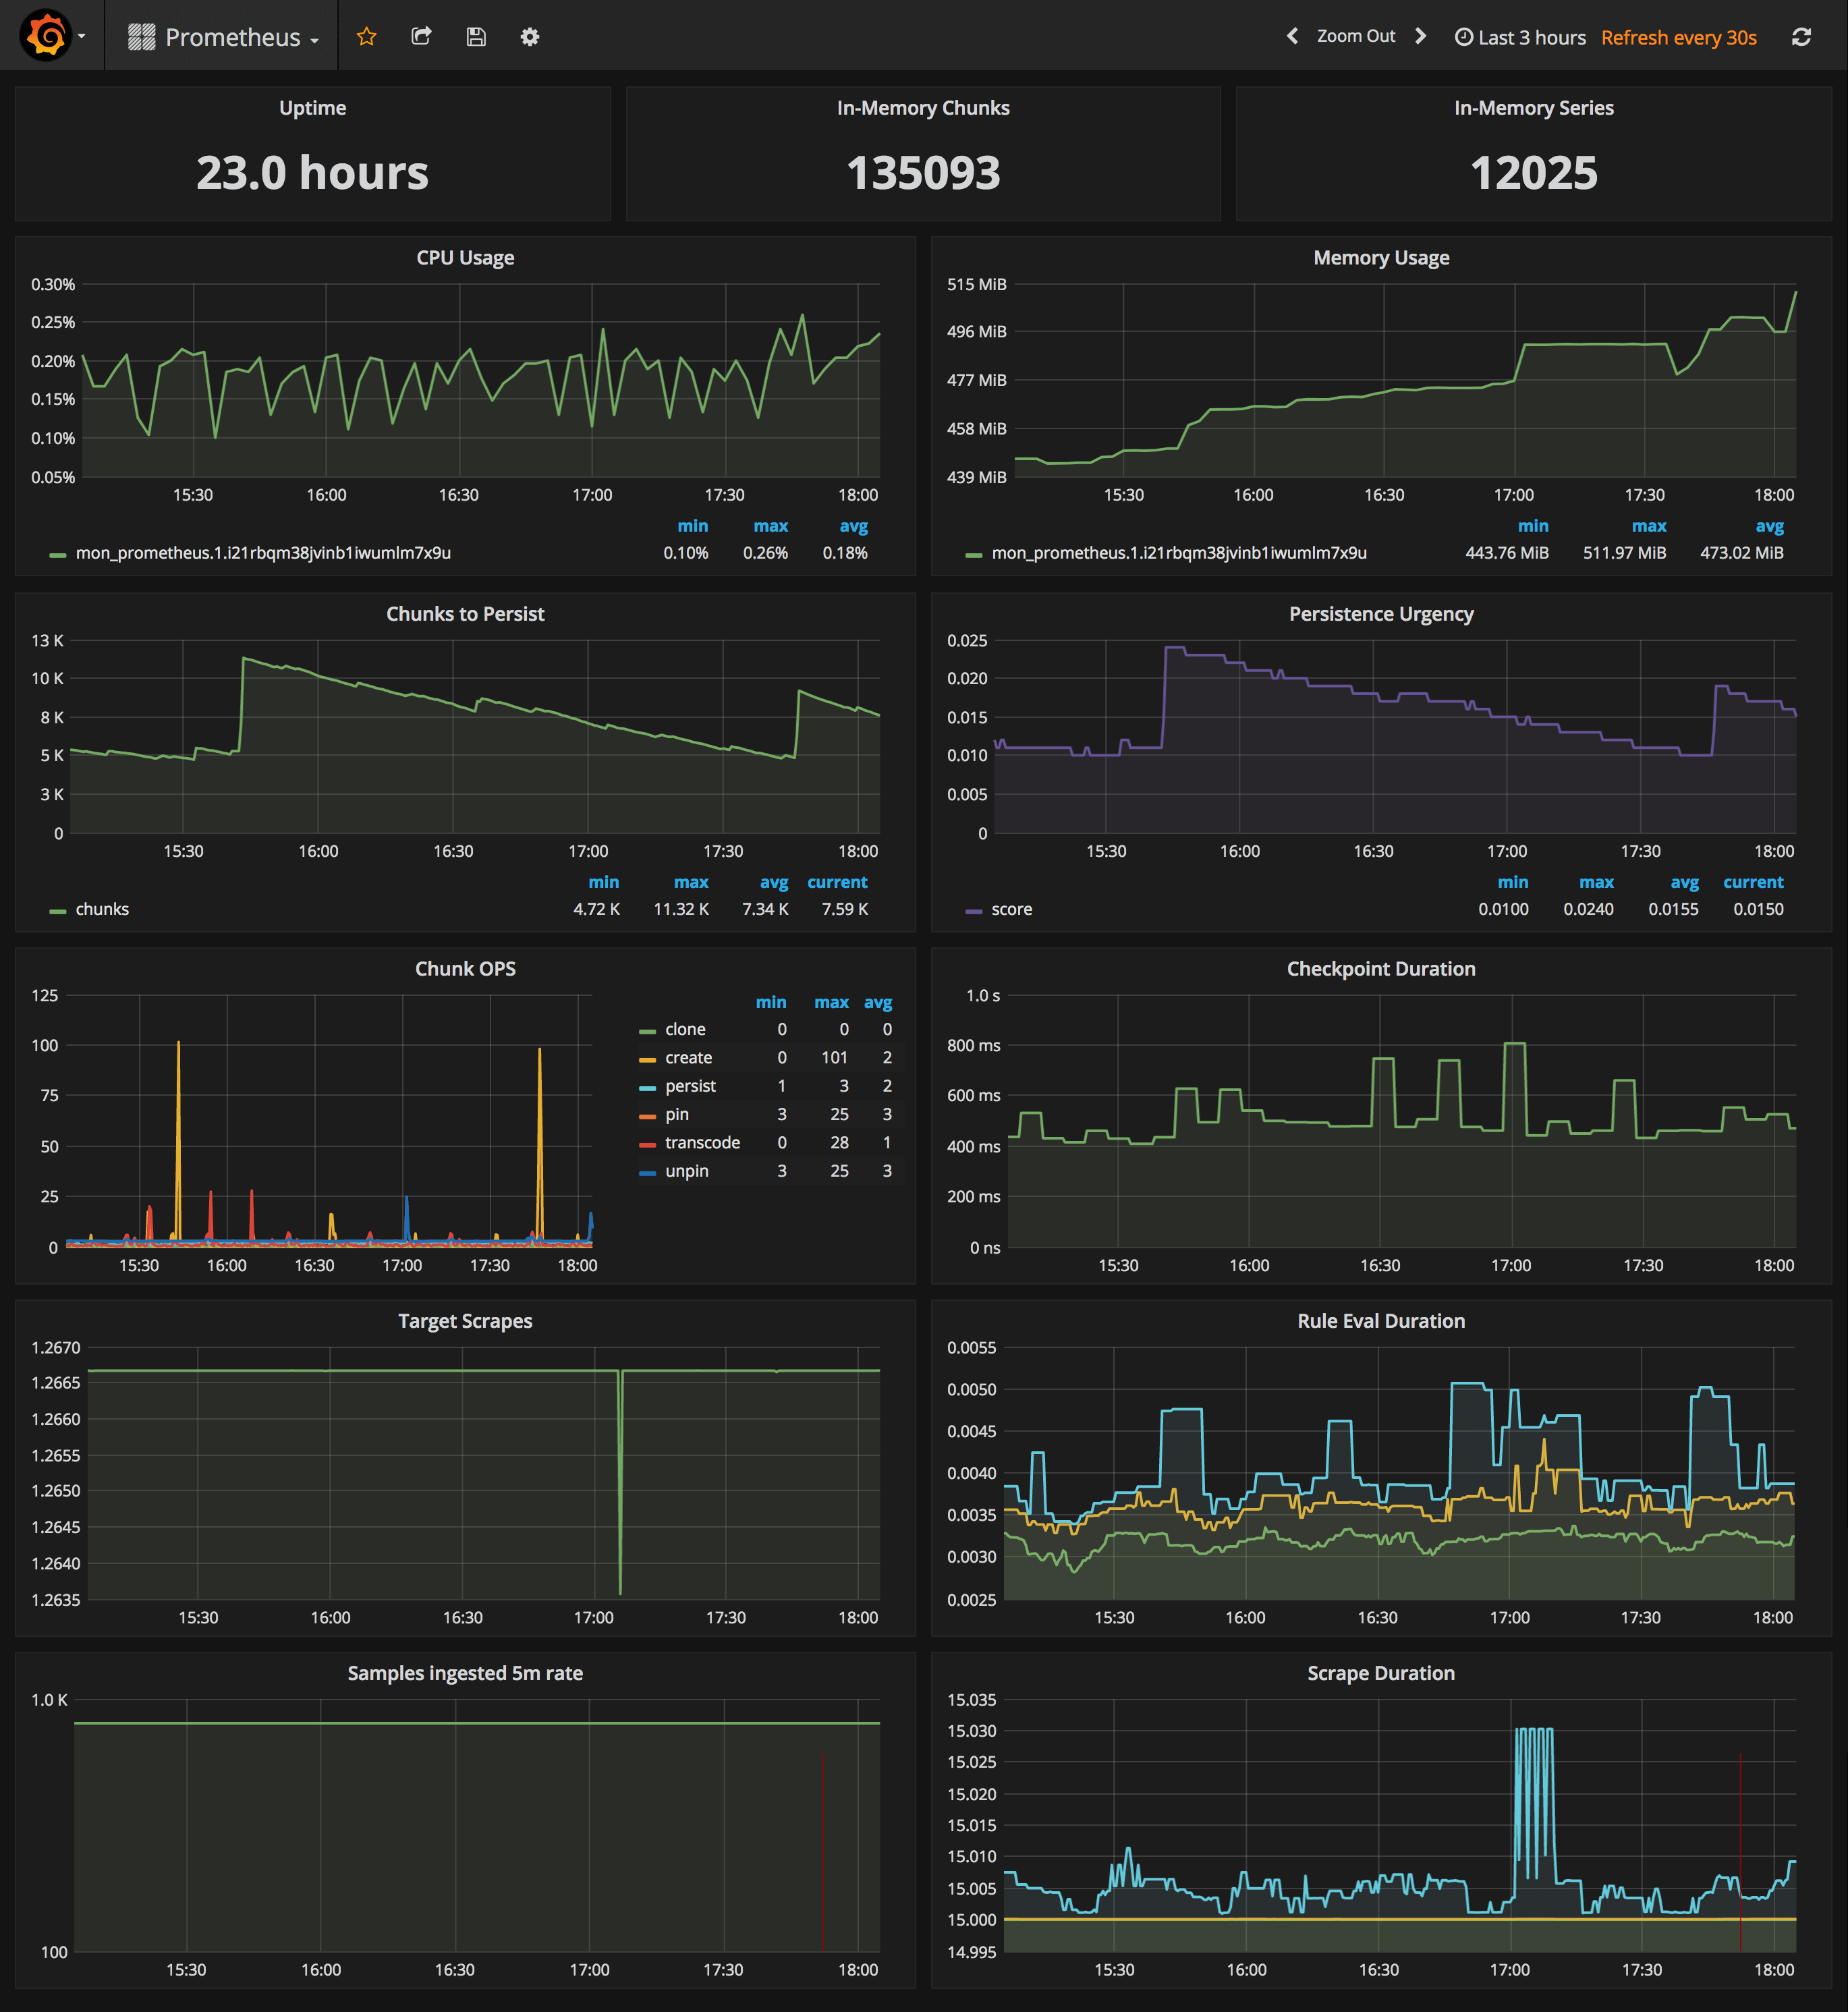
URL: http://<swarm-ip>:3000/dashboard/db/prometheus
- Uptime, local storage memory chunks and series
- CPU usage graph
- Memory usage graph
- Chunks to persist and persistence urgency graphs
- Chunks ops and checkpoint duration graphs
- Target scrapes, rule evaluation duration, samples ingested rate and scrape duration graphs
In order to collect metrics from Swarm nodes you need to deploy the exporters on each server. Using global services you don't have to manually deploy the exporters. When you scale up your cluster, Swarm will launch a cAdvisor, node-exporter and dockerd-exporter instance on the newly created nodes. All you need is an automated way for Prometheus to reach these instances.
Running Prometheus on the same overlay network as the exporter services allows you to use the DNS service discovery. Using the exporters service name, you can configure DNS discovery:
scrape_configs:
  - job_name: 'node-exporter'
    dns_sd_configs:
    - names:
      - 'tasks.node-exporter'
      type: 'A'
      port: 9100
  - job_name: 'cadvisor'
    dns_sd_configs:
    - names:
      - 'tasks.cadvisor'
      type: 'A'
      port: 8080
  - job_name: 'dockerd-exporter'
    dns_sd_configs:
    - names:
      - 'tasks.dockerd-exporter'
      type: 'A'
      port: 9323
When Prometheus runs the DNS lookup, Docker Swarm will return a list of IPs for each task. Using these IPs, Prometheus will bypass the Swarm load-balancer and will be able to scrape each exporter instance.
The problem with this approach is that you will not be able to tell which exporter runs on which node. Your Swarm nodes' real IPs are different from the exporters IPs since exporters IPs are dynamically assigned by Docker and are part of the overlay network. Swarm doesn't provide any records for the tasks DNS, besides the overlay IP. If Swarm provides SRV records with the nodes hostname or IP, you can re-label the source and overwrite the overlay IP with the real IP.
In order to tell which host a node-exporter instance is running, I had to create a prom file inside the node-exporter containing the hostname and the Docker Swarm node ID.
When a node-exporter container starts node-meta.prom is generated with the following content:
"node_meta{node_id=\"$NODE_ID\", node_name=\"$NODE_NAME\"} 1"The node ID value is supplied via {{.Node.ID}} and the node name is extracted from the /etc/hostname
file that is mounted inside the node-exporter container.
  node-exporter:
    image: stefanprodan/swarmprom-node-exporter
    environment:
      - NODE_ID={{.Node.ID}}
    volumes:
      - /etc/hostname:/etc/nodename
    command:
      - '-collector.textfile.directory=/etc/node-exporter/'
Using the textfile command, you can instruct node-exporter to collect the node_meta metric.
Now that you have a metric containing the Docker Swarm node ID and name, you can use it in promql queries.
Let's say you want to find the available memory on each node, normally you would write something like this:
sum(node_memory_MemAvailable) by (instance)

{instance="10.0.0.5:9100"} 889450496
{instance="10.0.0.13:9100"} 1404162048
{instance="10.0.0.15:9100"} 1406574592
The above result is not very helpful since you can't tell what Swarm node is behind the instance IP. So let's write that query taking into account the node_meta metric:
sum(node_memory_MemAvailable * on(instance) group_left(node_id, node_name) node_meta) by (node_id, node_name)

{node_id="wrdvtftteo0uaekmdq4dxrn14",node_name="swarm-manager-1"} 889450496
{node_id="moggm3uaq8tax9ptr1if89pi7",node_name="swarm-worker-1"} 1404162048
{node_id="vkdfx99mm5u4xl2drqhnwtnsv",node_name="swarm-worker-2"} 1406574592
This is much better. Instead of overlay IPs, now I can see the actual Docker Swarm nodes ID and hostname. Knowing the hostname of your nodes is useful for alerting as well.
You can define an alert when available memory reaches 10%. You also will receive the hostname in the alert message and not some overlay IP that you can't correlate to a infrastructure item.
Maybe you are wondering why you need the node ID if you have the hostname. The node ID will help you match
node-exporter instances to cAdvisor instances. All metrics exported by cAdvisor have a label named container_label_com_docker_swarm_node_id,
and this label can be used to filter containers metrics by Swarm nodes.
Let's write a query to find out how many containers are running on a Swarm node.
Knowing from the node_meta metric all the nodes IDs you can define a filter with them in Grafana.
Assuming the filter is $node_id the container count query should look like this:
count(rate(container_last_seen{container_label_com_docker_swarm_node_id=~"$node_id"}[5m]))
Another use case for node ID is filtering the metrics provided by the Docker engine daemon.
Docker engine doesn't have a label with the node ID attached on every metric, but there is a swarm_node_info
metric that has this label. If you want to find out the number of failed health checks on a Swarm node
you would write a query like this:
sum(engine_daemon_health_checks_failed_total) * on(instance) group_left(node_id) swarm_node_info{node_id=~"$node_id"})
For now the engine metrics are still experimental. If you want to use dockerd-exporter you have to enable
the experimental feature and set the metrics address to 0.0.0.0:9323.
If you are running Docker with systemd create or edit /etc/systemd/system/docker.service.d/docker.conf file like so:
[Service]
ExecStart=
ExecStart=/usr/bin/dockerd \
  --storage-driver=overlay2 \
  --dns 8.8.4.4 --dns 8.8.8.8 \
  --experimental=true \
  --metrics-addr 0.0.0.0:9323
Apply the config changes with systemctl daemon-reload && systemctl restart docker and
check if the docker_gwbridge ip address is 172.18.0.1:
ip -o addr show docker_gwbridgeReplace 172.18.0.1 with your docker_gwbridge address in the compose file:
  dockerd-exporter:
    image: stefanprodan/caddy
    environment:
      - DOCKER_GWBRIDGE_IP=172.18.0.1