Scalable video conferencing on Kubernetes.
The whole setup is based on Kubernetes YAML files and patches for these files. It makes use of kustomize to customize the raw YAMLs for each environment.
(Almost) every directory in the directory tree (depicted below) contains a kustomize.yaml file which defines resources (and possibly patches).
|-- base
|   |-- jitsi
|   |-- jitsi-shard
|   |   `-- jvb
|   `-- ops
|       |-- cert-manager
|       |-- dashboard
|       |-- ingress-nginx
|       |-- loadbalancer
|       |-- logging
|       |-- metacontroller
|       |-- monitoring
|       `-- reflector
`-- overlays
    |-- development
    |   |-- jitsi-base
    |   |-- ops
    |   |-- shard-0
    |   `-- shard-1
    `-- production
        |-- jitsi-base
        |-- ops
        |-- shard-0
        `-- shard-1
- kubectl/v1.17.2+
- kustomize/v3.5.4 WARNING: newer versions of kustomize currently don't work due to changes regarding remote sources
To install the full setup go to either overlays/development or
overlays/production and run
$ kustomize build . | kubectl apply -f -This deploys a Jitsi setup consisting of two shards. A shard is a complete replica of a Jitsi setup that is used in
parallel to other shards to load-balance and for high availability. More shards can be added following the documentation
in docs/architecture/architecture.md. The setup was tested against a managed
Kubernetes cluster (v1.17.2) running on IONOS Cloud.
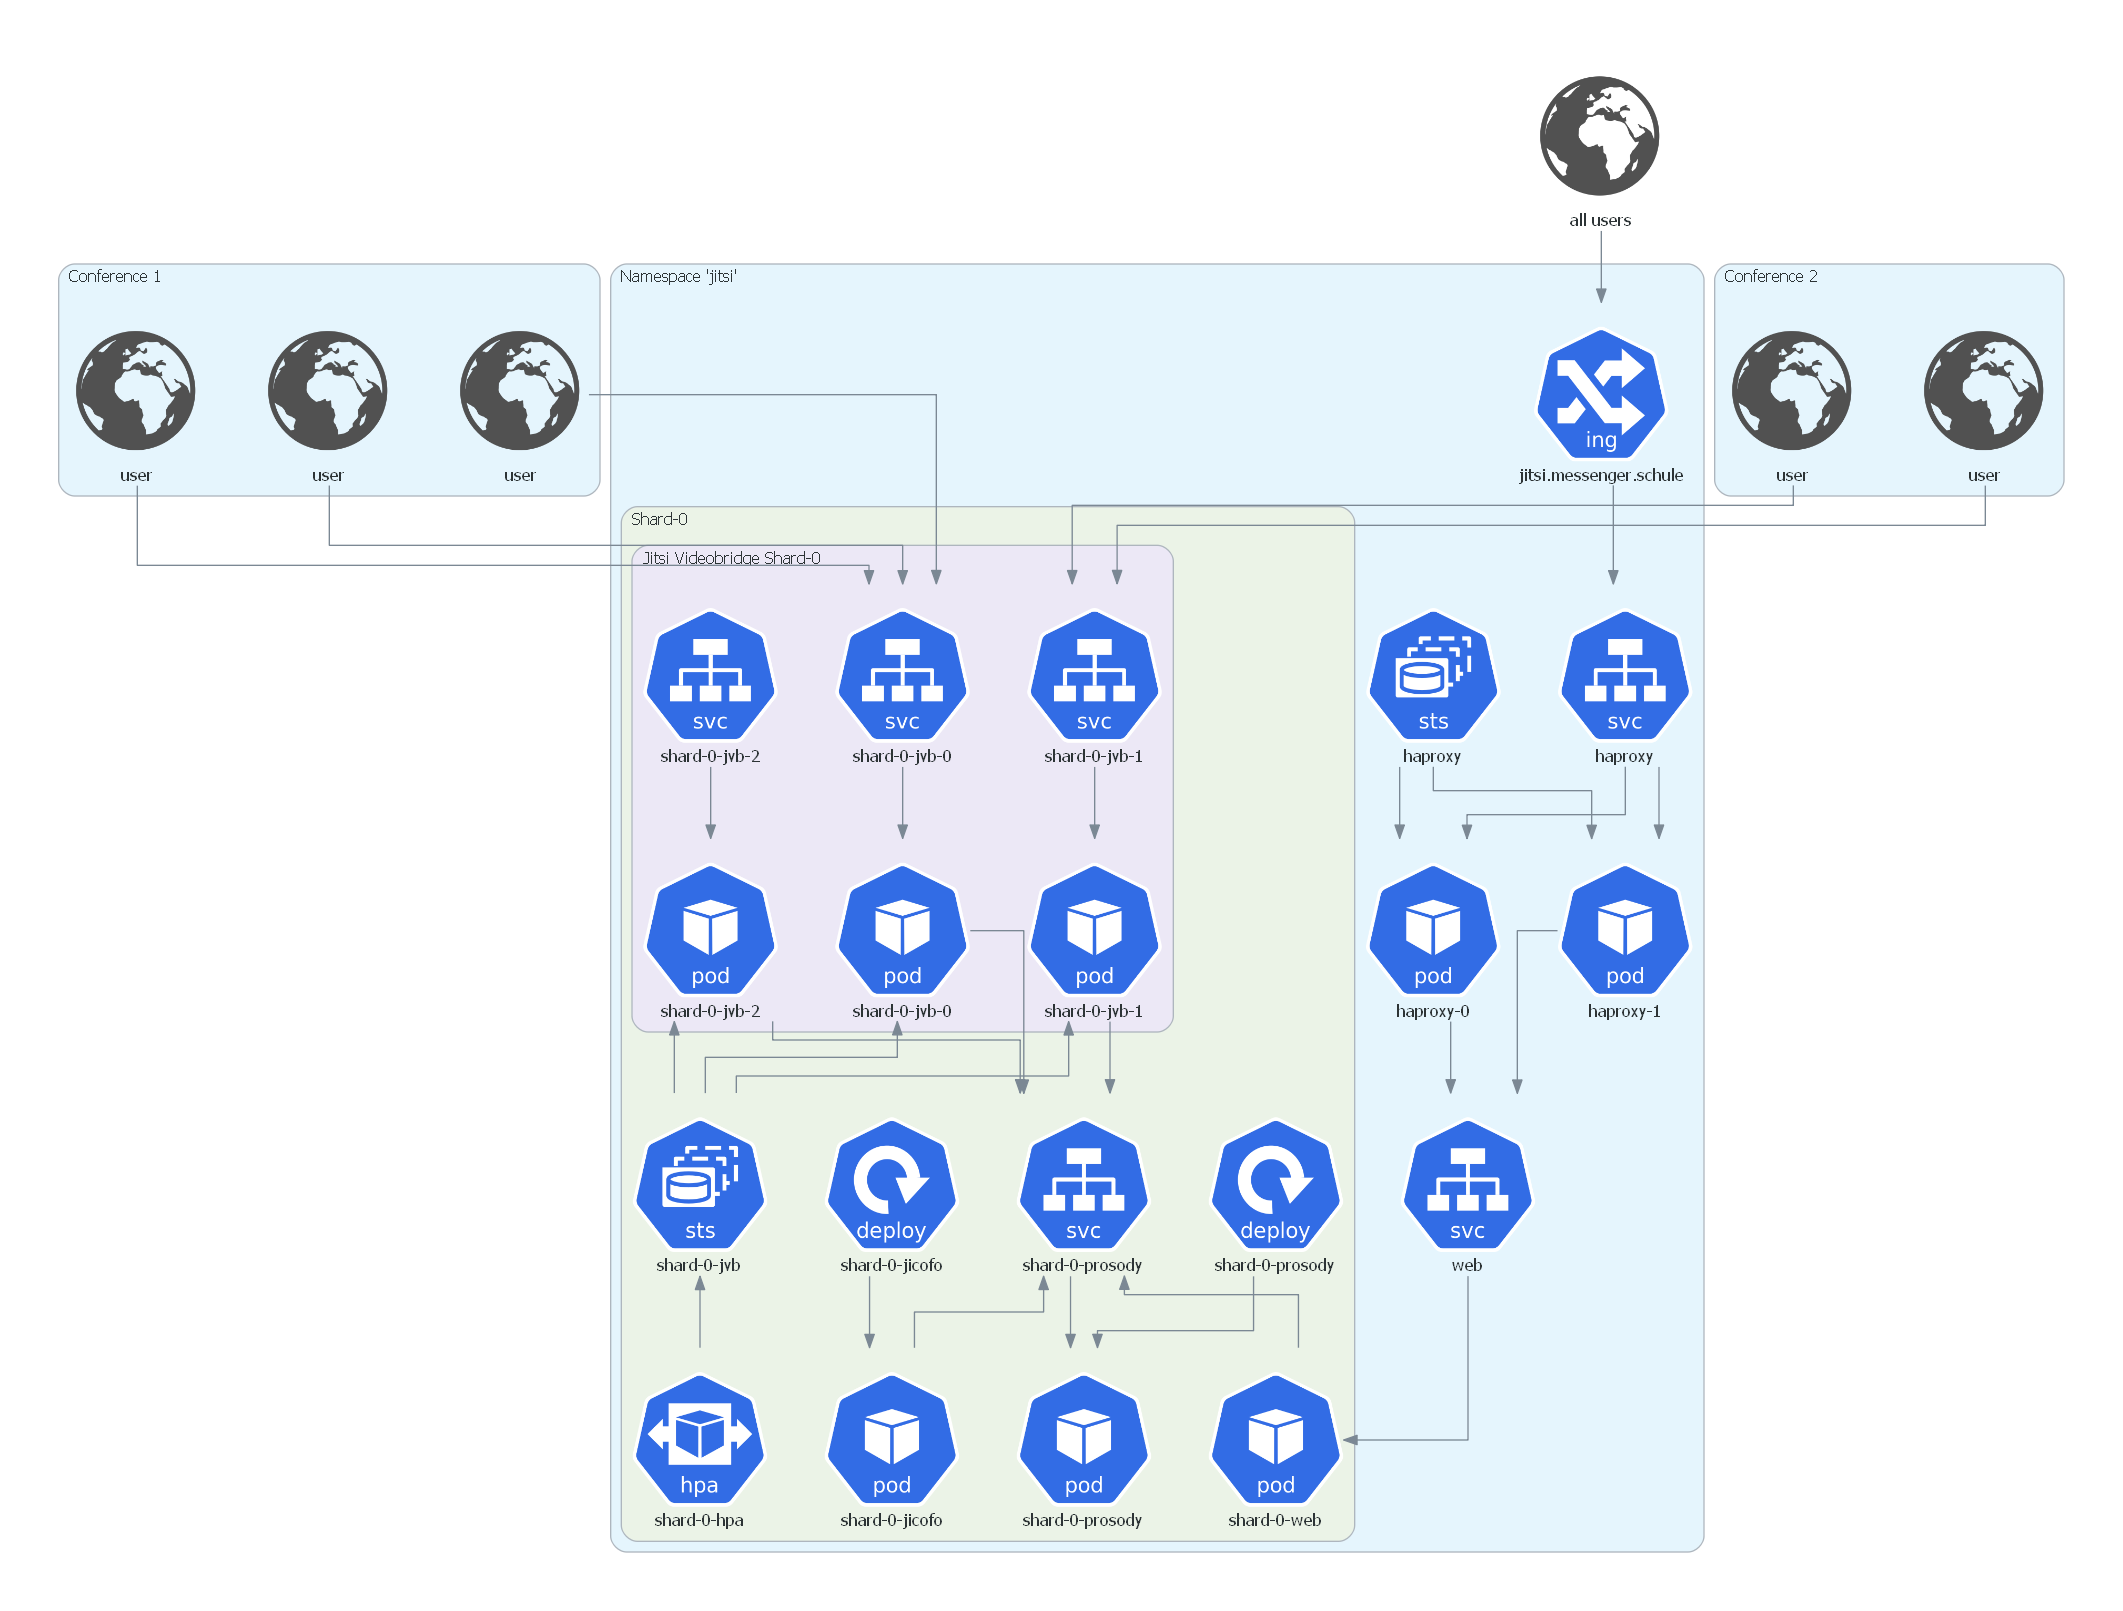
The Jitsi Kubernetes namespace has the following architecture:
The setup shown above contains only a single shard (for visual clarity). Subsequent shards would be attached to the web service. A more detailed explanation of the system architecture with multiple shards can be found in docs/architecture/architecture.md.
Load testing is based on jitsi-meet-torture which is a Java application that connects to a Jitsi instance as a user and shows a predefined video along with an audio stream by using a Selenium Chrome instance. To run multiple test users in multiple conferences a Selenium hub set up with docker-compose is used.
Terraform scripts that set up the test servers with an existing image can be found under loadtest.
An init script is used to provision the necessary tools to that image. This image also needs SSH
access set up with public key authentication.
After starting a number of load test servers, the load test can be started by using the loadtest/run_loadtest.sh
script (locally). Results can be found in docs/loadtests/loadtestresults.md.
To access the installed Kubernetes Dashboard execute
$ kubectl proxyand then go to http://localhost:8001/api/v1/namespaces/kubernetes-dashboard/services/https:kubernetes-dashboard:/proxy/.
The login token can be received by executing
kubectl -n kubernetes-dashboard describe secret $(kubectl -n kubernetes-dashboard get secret | grep admin-user | awk '{print $1}')Kibana is not accessible from the Internet and must be forwarded to your local machine via kubectl by executing
$ kubectl port-forward -n logging svc/kibana-kb-http 5601:5601After that you will be able to access Kibana via https://localhost:5601/.
The default login password (user elastic) can be received with
$ kubectl get secret -n logging elasticsearch-es-elastic-user -o=jsonpath='{.data.elastic}' | base64 --decode; echoThe same procedure can be used to access Prometheus or Alertmanager.
The monitoring stack that is set up by this project is currently also used by an affiliated project
for Big Blue Button. Therefore, some of the files here contain configurations to monitor
that setup. To exclude them delete all files starting with bbb- and remove the file names from the respective
kustomization.yaml files.
