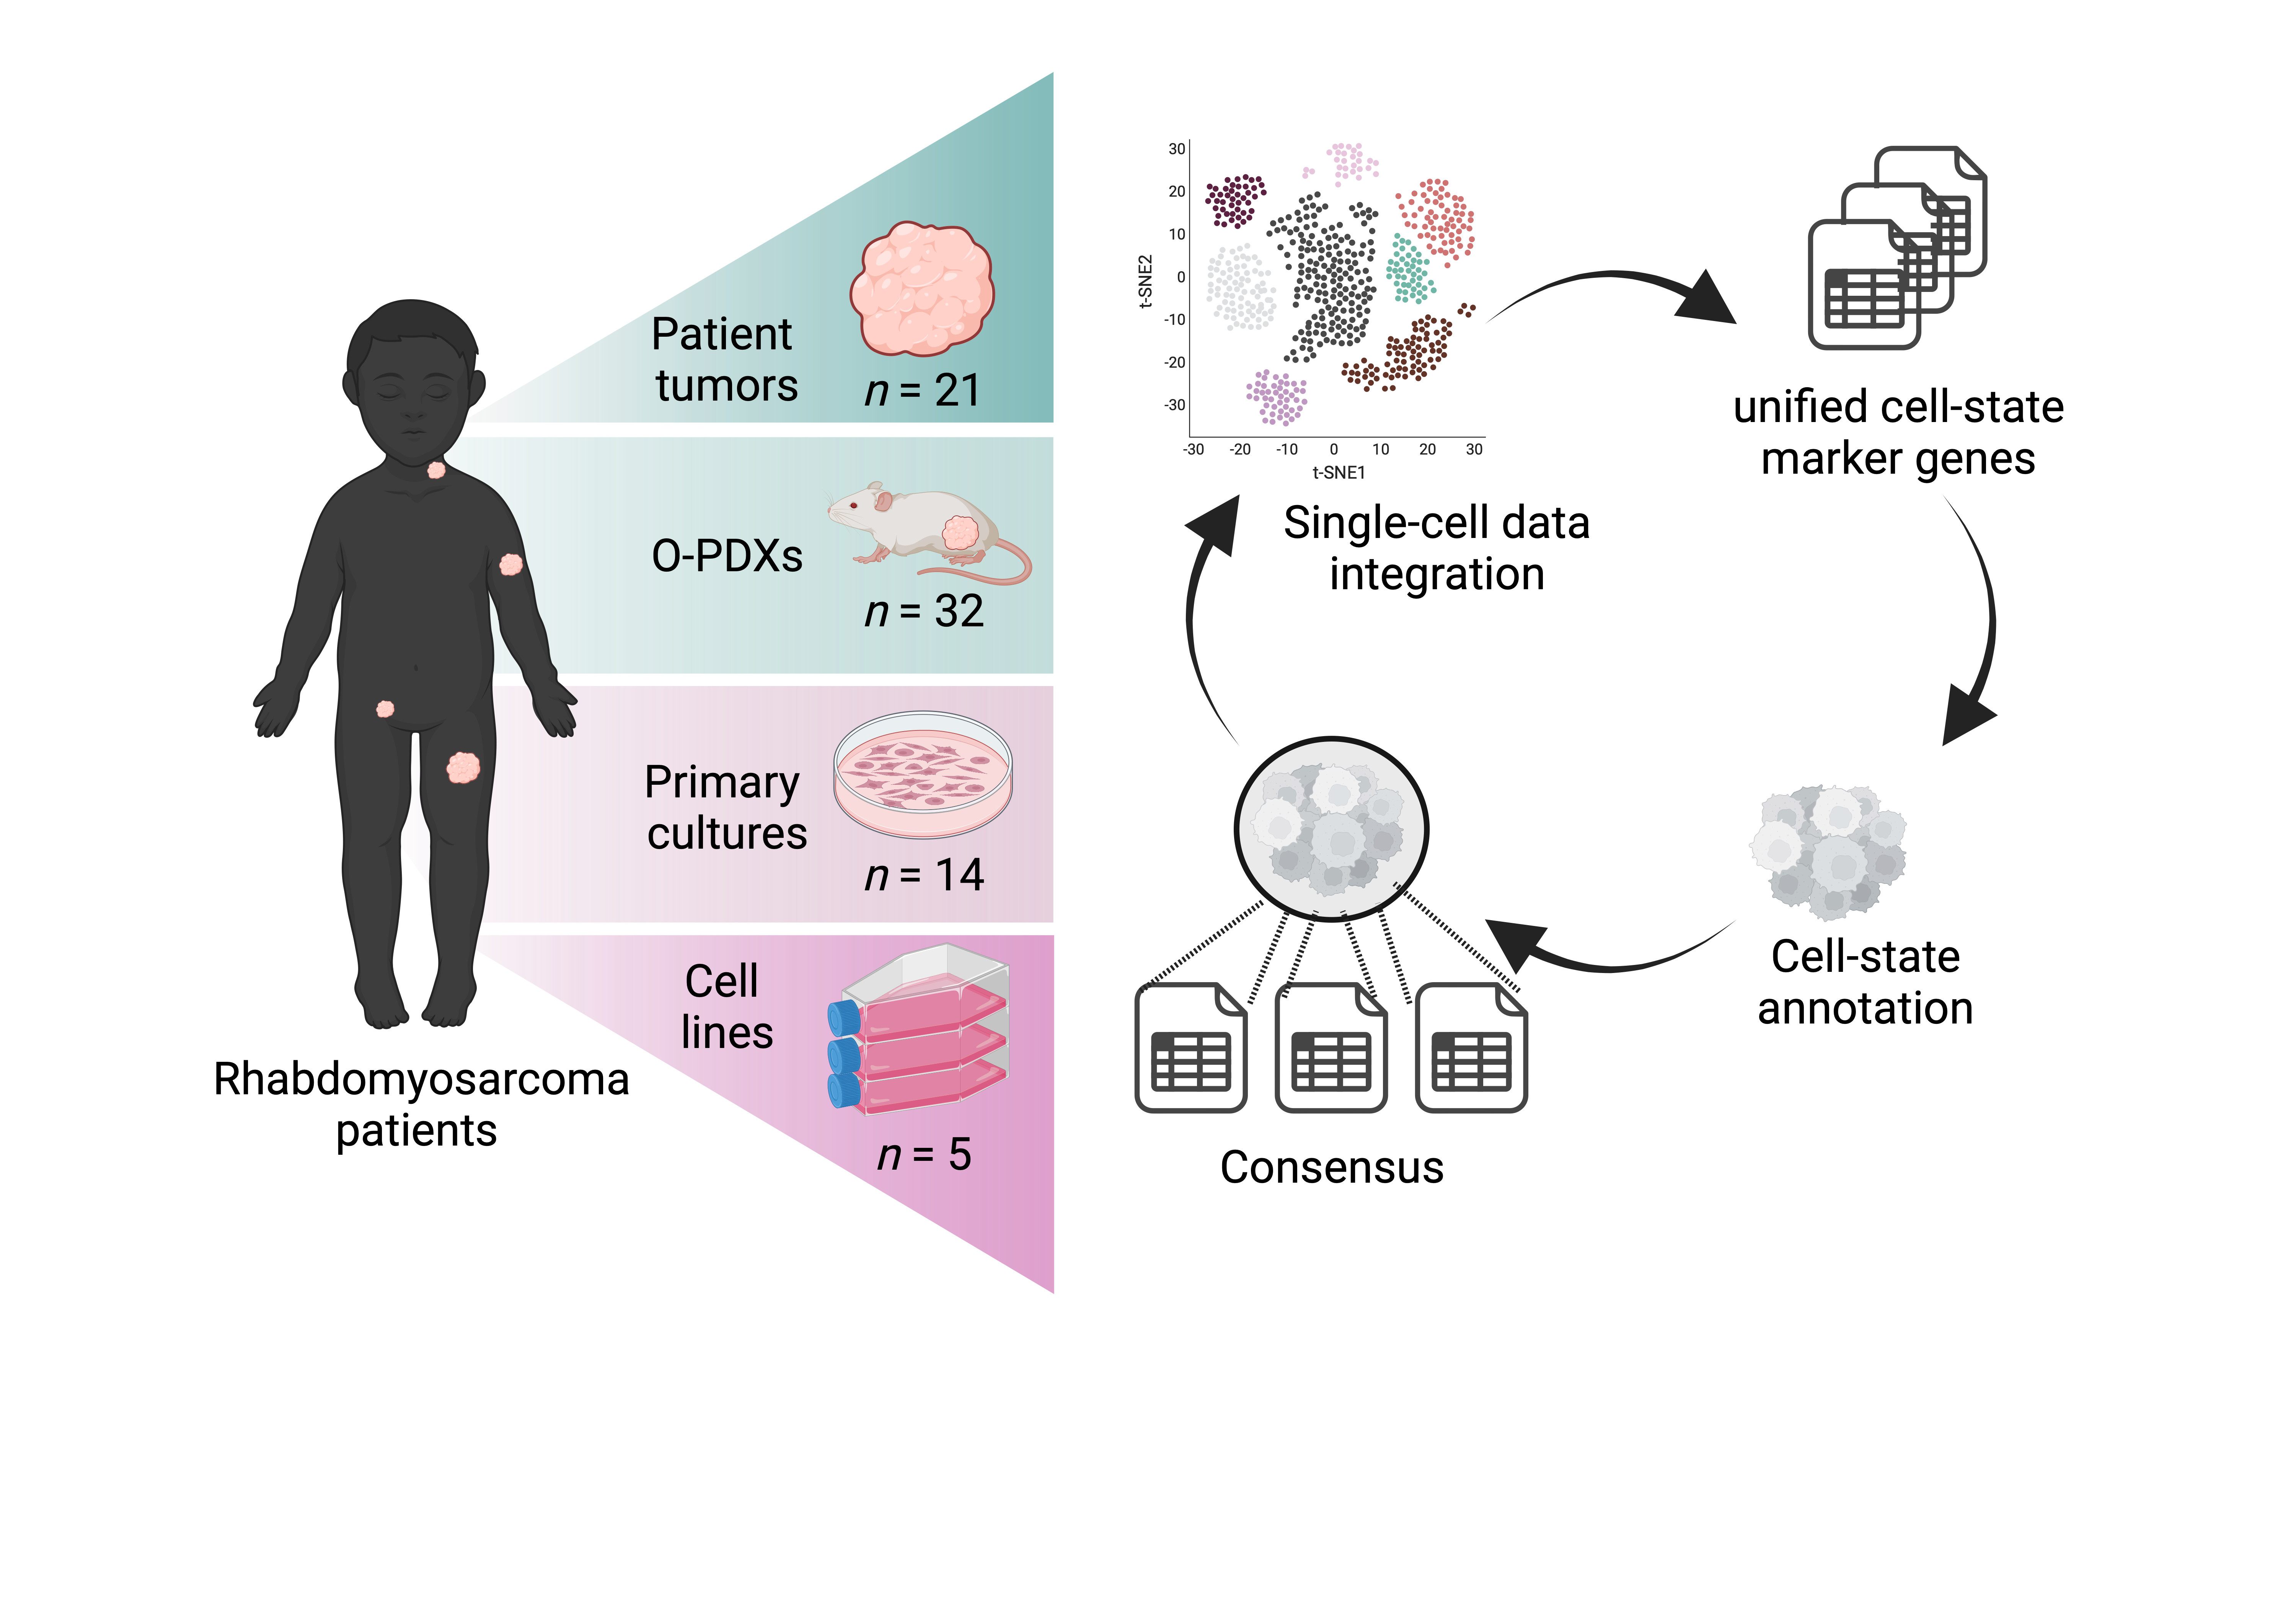
Steps used for this project
METADATA ANALYSIS OF ALL RMS SAMPLES (Fig. 1, Fig.2, Fig. 3)
0. Preprocessing
- use script
merging_datasets.Rinside the preprocessing folder to import the datasets, subset to:- import .rds files
- subset cells to random 1500 cells to speed up computational analysis
- for Patel et al. the files were mapped to both human and mouse genome; therefore human cells were filtered using 'Tumor' annotation, and only human genes ('hg19') were selected. Gene names were renamed to be consistent with the other publications
- add metadata
1. Merging all RMS datasets from different publications
- use script
merging_datasets.Rinside the preprocessing folder to import the datasets, subset to combine datasets combined using 'merge' function. No regression applied
2. Analyze objects without regressing out inter-sample differences
- use
1_Integration_no_regression.Rscript, to create UMAP plots of samples before regression
3. Integrate objects using RPCA to remove inter-sample differences
- use
2_Integration_all.Rscript to remove inter-sample differences (stored in 'name' metacolumn). The script uses RPCA correction (Fig. 1)
4. Score cells using metaprograms identified in the original publications
- use
3_Scoring.Rscript to score RPCA-integrated object for cell cycle and metaprogram scores
5. Downstream analysis of RPCA-integrated object
-
- use
4_Analysis_all.Rto: - define high- vs low-cycling cells based on S.scores and G2M.scores
- run PCA and UMAP
- identify Louvain clusters, their markers, and assigns them names
- use
6. Visualization plots of RPCA-integrated object
-
Use
5_Plots_all.Rto visualize UMAPS, heatmap, etc.
METADATA ANALYSIS OF MOLECULARLY-DEFINED RMS SUBTYPE (FN-RMS, FP-RMS PAX3::FOXO1, FP-RMS PAX7::FOXO1) (Fig. 4)
0. Preprocessing
- use script
merging_datasets.Rinside the preprocessing folder to import the datasets, subset to:- import .rds files
- subset cells to random 1500 cells to speed up computational analysis
- for Patel et al. the files were mapped to both human and mouse genome; therefore human cells were filtered using 'Tumor' annotation, and only human genes ('hg19') were selected. Gene names were renamed to be consistent with the other publications
- add metadata
1. Merging all RMS datasets from different publications
- use script
merging_datasets.Rinside the preprocessing folder to import the datasets, subset to combine datasets combined using 'merge' function. No regression applied
2. Integrate objects using RPCA to remove inter-sample differences and score them
- use
2_Integration_FP-RMS_P3F1.R,2_Integration_FP-RMS_P7F1.R,2_Integration_FN-RMS.Rscripts to:- subset combined dataset based on molecular subtype
- integrate objects using RPCA correction to remove sample differences
- the scripts automatically scores the objects for module scores
3. Downstream analysis of RPCA-integrated object
-
- use
4_Analysis_FP-RMS_P3F1.R,4_Analysis_FP-RMS_P7F1.R,4_Analysis_FN-RMS.Rto: - define high- vs low-cycling cells based on S.scores and G2M.scores
- run PCA and UMAP
- identify Louvain clusters, their markers, and assigns them names
- use
4. Visualization plots of RPCA-integrated object
- Use
5_Plots_FP-RMS_P3F1.R,5_Plots_FP-RMS_P7F1.R,5_Plots_FN-RMS.Rto visualize UMAPS, heatmap, etc.
5. Visualize overlap between marker genes across different molecular subgroups (Fig. 3B)
-
Use
correlation_signatures.Rscript to identify overlapping genes across cell states from different RMS subtypes and to plot Fig. S3B
ANALYSIS OF RMS DUPLICATE SAMPLES SEQUENCED ACROSS DIFFERENT LABS
-
use
6_Analysis_matched_samplesscript, which:- imports integrated RMS object (from Fig. 1) and subsets it to pairs of interest
- visualizes distribution of samples on UMAP and bar plot of cell proportions
ANNOTATION OF RMS TUMOR DATASET BASED ON DEVELOPMENTAL SCRNASEQ DATA (Fig. 4)
Scripts are stored under developmental_reference folder
Raw data from Xi et al. Dev. Cell. 2020 have been downloaded from: https://cells.ucsc.edu/?ds=skeletal-muscle
1. Cleanup of Xi et al. Dev. Cell 2020 dataset
- use
1_read_Xi_dev_muscle.R, which:- imports dataframes
- performs Seurat pipeline for downstream analyses
2. Transfer annotations from developmental dataset onto tumors
- use
2_Labeltransfer_dev_muscle.Rscript, which uses SingleR to transfer either developmental time point or annotation onto RMS tumors
3. Plot distribution across developmental time points
-
use
3_Barplot_distribution.Rscript to import metaata saved from step above, and to plot Fig. 4E, 4F
ANALYSIS OF RMS PATIENT SAMPLE PAIRS OBTAINED DURING DIAGNOSTIC BIOPSY AND DELAYED RESECTION (Fig. 5)
Scripts are stored under FFPE folder
Score dataset with signature modules and plot scores
- use
1_Scoring_FFPE_Patient.Rscript
ANALYSIS OF PDX BIOPSY SAMPLES FROM SJRHB013759_X1 OBTAINED DURING THERAPY (Fig. 5)
Scripts are stored under PDX_treatment folder
2.Score dataset with signature modules and plot scores
- use
Scoring_SJRHB013759_X14.Rscript
