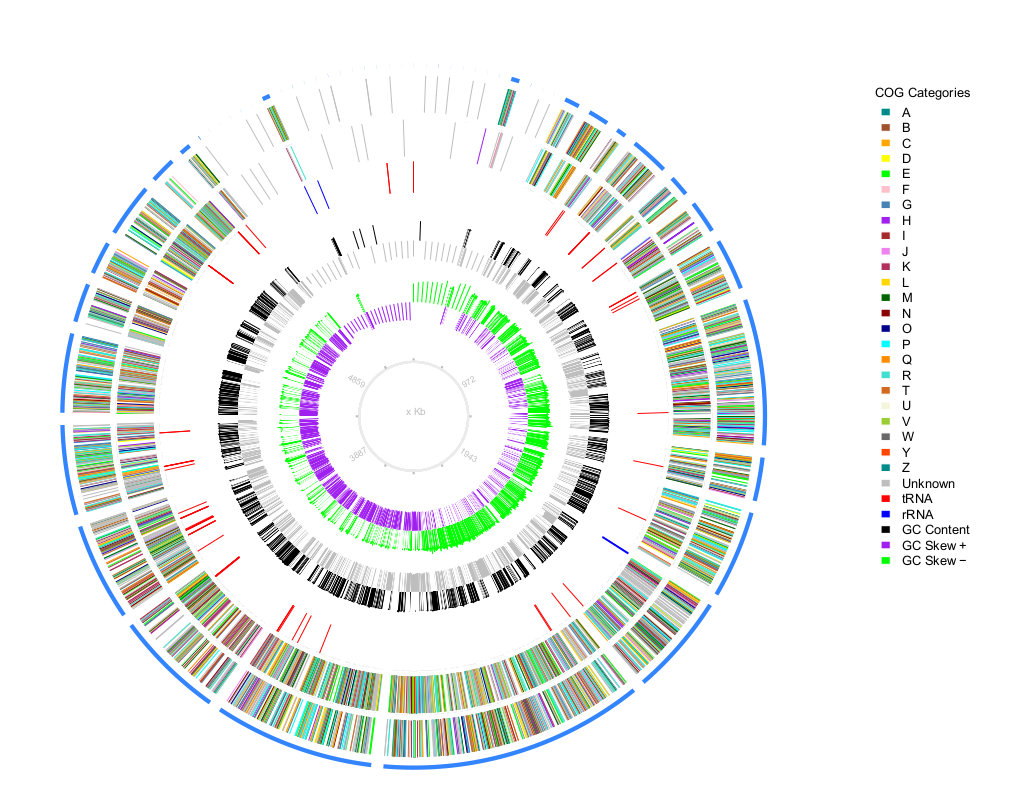
plotMyGBK is a easy to use tool that use a genbank file to retrieve you a nice circular chart
plotMyGBK have minimal use:
python plotMyGBK.py -g mygenbank.gbk
and a complete use:
python plotMyGBK.py -g mygenbank.gbk -c annotationFile.tsv -w 3000 -s 1500 -l 500
- -g is the genbank file
- -c annotation file from prokka that contain the COG annotation (or something with that format).
- -w Windows size, to computing GC content and GC skew set the windows size, default:3000
- -s Step size, size in bp to move windows (-w), default:1500
- -l Filter Contigs, show only contigs that have more than 500bp
Since your gbk, plotMyGBK will generate a folder called results_GBKNAME.faa where GBKNAME is the genbank file, this folder contain several files like faa, fna, parsed rpsblast results, other files necessaries to plot and last the plot in pdf format.
- Ying Hu Chunhua Yan yanch@mail.nih.gov (2015). OmicCircos: High-quality circular visualization of omics data. R package version 1.8.1.
- The script will plot at least all contigs, this is ideal for prokaryotes gbk files where there are few contigs (~100 or less), more than that might not look nicely.
