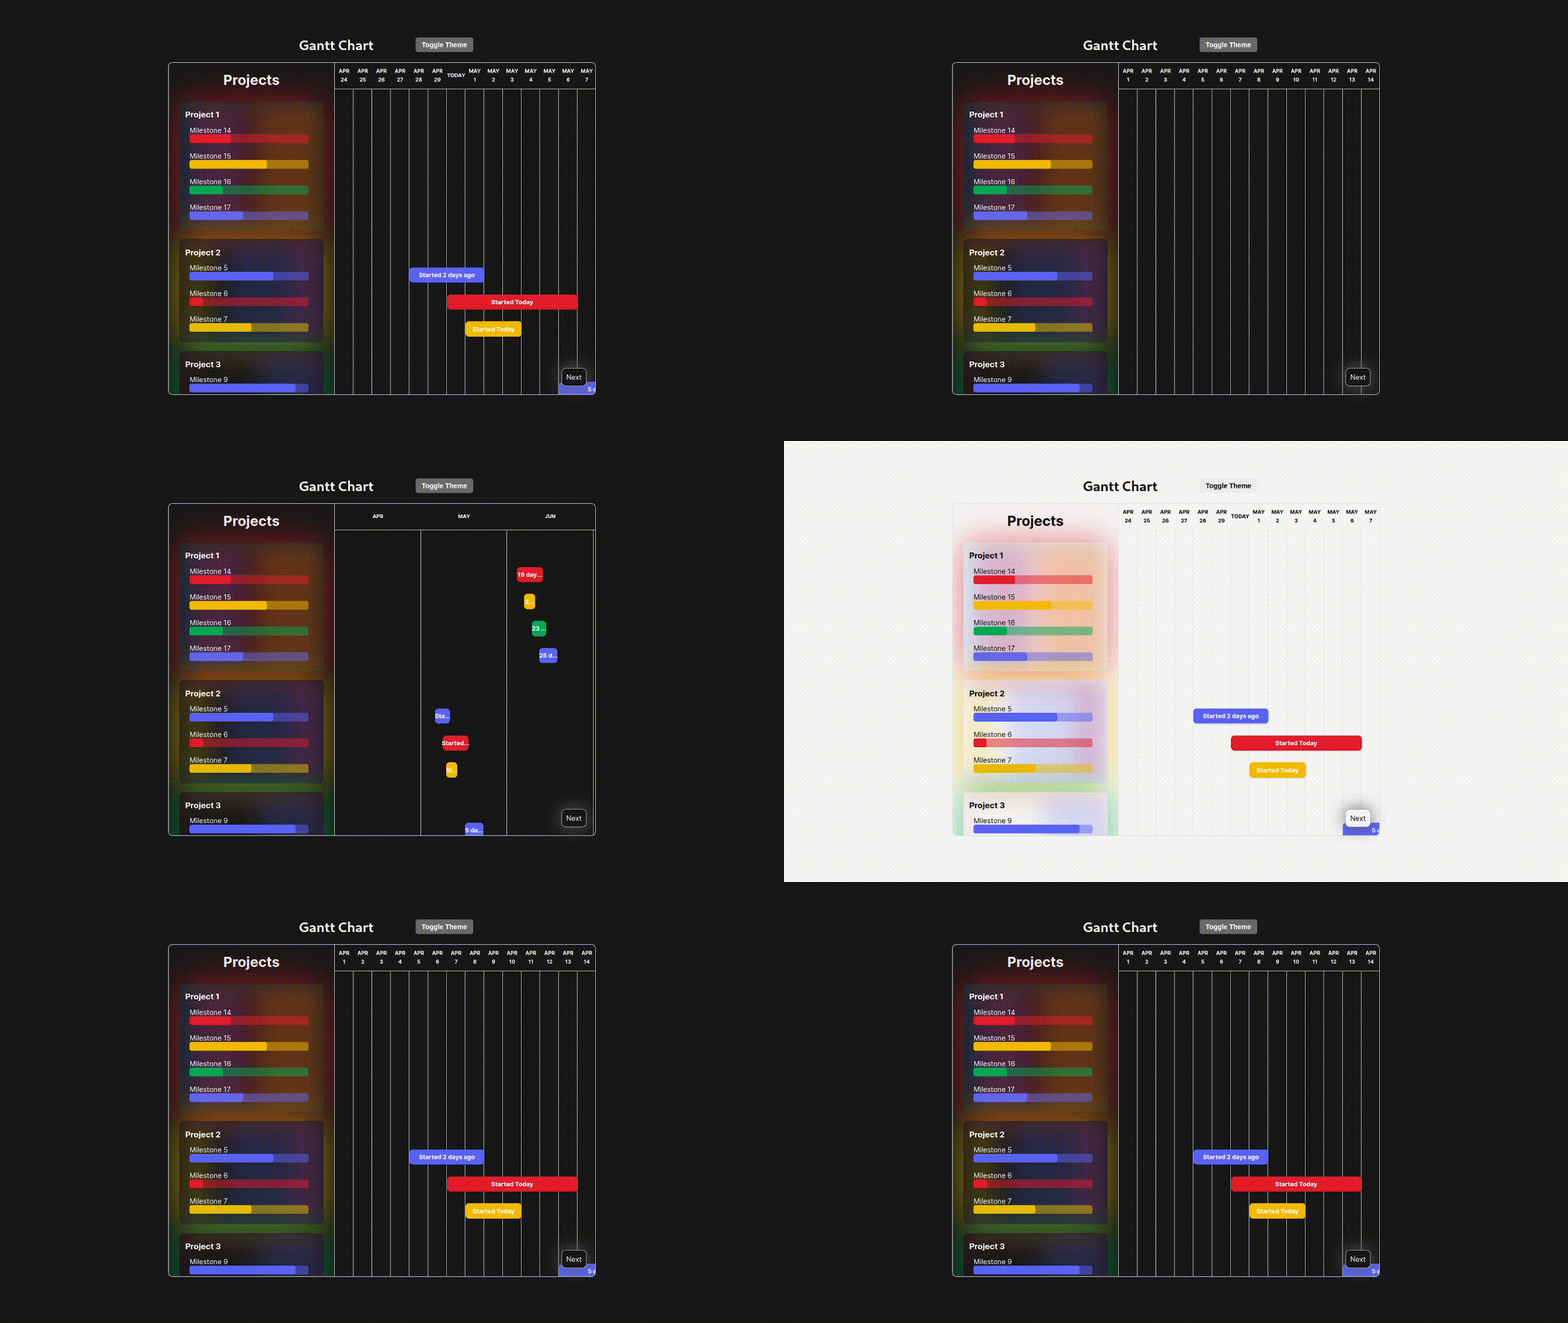
This project demonstrates how to create a simple Gantt chart from scratch. The Gantt chart is a popular project management tool that visually represents tasks and their timeframes in a horizontal bar chart format.
Follow these instructions to set up the project and run it on your local machine.
- Node.js version 12.0.0 or higher
- NPM version 6.0.0 or higher
- Clone the repository:
git clone https://github.com/yourusername/gantt-chart-react.git- Change to the project directory:
cd gantt-chart-react- Install the dependencies:
npm install- Start the development server:
npm startThe application should now be running on http://localhost:3000/.
The GanttChartComponent in src/components/GanttChartComponent/ renders the Gantt chart. You can modify the data array to include your own projects and milestones. Each data object should have the following format:
{
    name: string,
    projectColor: string,
    milestones: [
        {
            name: string,
            startDate: string,
            duration: number,
            primaryColor: string,
            secondaryColor: string,
            tertiaryColor: string,
            progress: number
        }
    ]
}
Example:
[
  {
    name: "Project 1",
    projectColor: "#DB443799",
    milestones: [
      {
        id: 14,
        name: "Milestone 14",
        startDate: "2023-05-20",
        duration: 7,
        primaryColor: "#DB4437",
        secondaryColor: "#DB443780",
        tertiaryColor: "#DB443733",
        progress: 35
      }
    ]
  },
  {
    name: "Project 2",
    projectColor: "#F4B40099",
    milestones: [
      {
        id: 5,
        name: "Milestone 5",
        startDate: "2023-04-28",
        duration: 4,
        primaryColor: "#4285F4",
        secondaryColor: "#4285F480",
        tertiaryColor: "#4285F433",
        progress: 70
      },
      {
        id: 6,
        name: "Milestone 6",
        startDate: "2023-04-30",
        duration: 7,
        primaryColor: "#DB4437",
        secondaryColor: "#DB443780",
        tertiaryColor: "#DB443733",
        progress: 11
      }
    ]
  }
];
To create the Gantt chart, simply import the GanttChart component from src/components/GanttChart:
import GanttChart from "src/components/GanttChart";You can further customize the appearance and functionality of the Gantt chart by modifying the properties of the GanttChart component.
Pull requests are welcome. For major changes, please open an issue first to discuss what you would like to change.
This project is licensed under the MIT License.
