Waris Gill, Ali Anwar, and Muhammad Ali Gulzar. Feddebug: Systematic debugging for federated learning applications. In Proceedings of the 45th International Conference on Software Engineering (ICSE '23). Association for Computing Machinery, New York, NY, USA.
The ArXiv version of the manuscript is avaibable at : FedDebug
For any question regarding FedDebug's artifact should be directed to Waris Gill at waris@vt.edu
FedDebug enables interactive and automated fault localization in Federation Learning (FL) applications. It adapts conventional debugging practices in FL with its breakpoint and fix & replay featur and it offers a novel differential testing technique to automatically identify the precise faulty clients. FedDebug tool artifact comprises a two-step process.
- Section 1: Usage and Example -- Interactive Debugging Constructs integrated with IBMFL framework via FL simulation in a Docker Image
- Section 2: Usage and Example -- Automated Faulty Client Localization via Google Colab Notebooks
- Section 3: Replication -- Reproducing Experimental Results via Google Colab Notebooks
FedDebug's interactive debugging module takes inspiration from traditional debuggers, such as gdb, and enables real-time interactive debugging on a simulation of a live FL application.
Below, we provide step-by-step walkthrough of FedDebug's interactive debugging features in IBMFL. For ease of installation, we offer pre-configured Docker Image of FedDebug enabled IBMFL.
Note: IBM uses term
partyto represent end devices and inFedDebugwe have usedclient(i.e.,partyandclientrefers the same end organizations and users.)
Go to debugging constructs directory (cd debugging-constructs). Please type "docker build -t ibmfl .". It will build docker form the Dockerfile. To run and interact with ibmfl docker type the following command docker run -it ibmfl. It will start the docker and now you can interact with it. Type ls in the docker shell to display the current directory content to check whether everything is installed correctly. You can check more about dockers on the following link Docker Tutorial.
cd debugging-constructs
docker build -t ibmfl .
docker run -it ibmfl
ls
In this tutorial, we will be using Tmux to simulate a distributed FL environment in Docker, representing both FL clients and aggregator. Tmux is a terminal multiplexer that allows you to split your terminal screen horizontally. Tmux allows us to interact with the client and aggregator side of IBMFL and seemlessly move between those two interfaces. To start tmux, simply type 'tmux' in the terminal. You can check more about tmux on this link Tmux Quick Tutorial.
To split the screen horizontally, type in a tmux session Ctrl + b followed by shift + " . It will split the screen into two terminals.
You can move between terminals (panes) by pressing Ctrl + b followed by the up and down arrows keys.
In one of the tmux terminals, type python sim_agg.py to run the aggregator.

After running this command, you will see the following output: "Press key to continue." Right now, do not press any key and move to another tmux terminal.
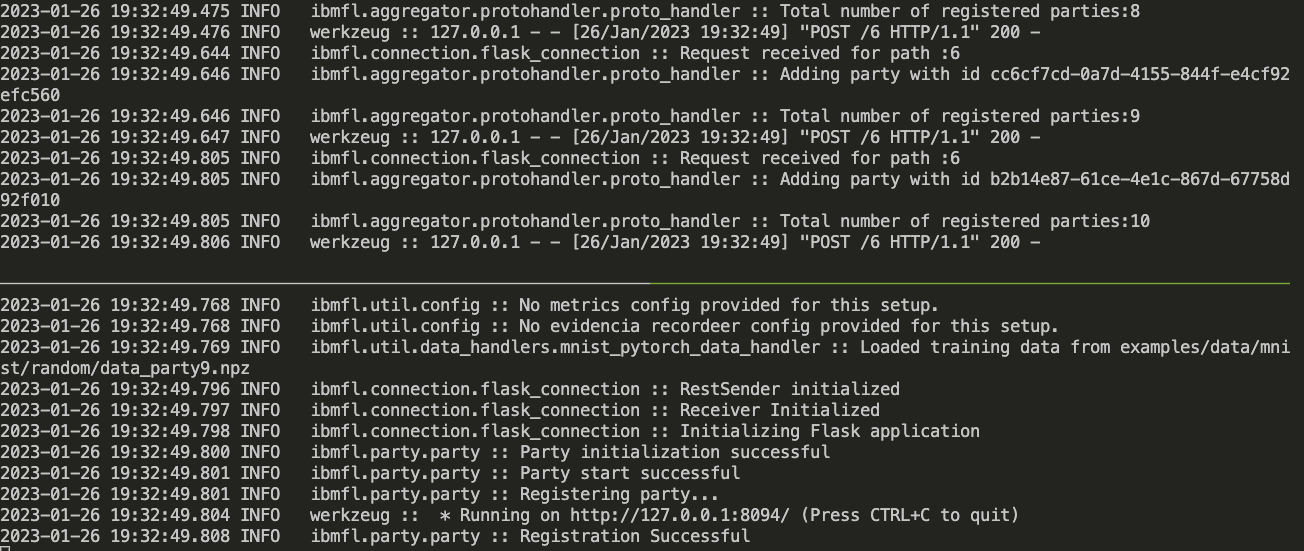
In the second terminal, type python sim_party.py. This will start the ten parties and connect them to the second aggregator.
 After running this command, you will see the following output:
Move back to the aggregator terminal and press enter key. This will start the training from the aggregator for 10 rounds with 10 clients. Currently, breakpoint is set at round 5, so the terminal will stop displaying logs after round 5 and you will see the following output:
Note: you can change the breakpoint round id in sim_agg.py
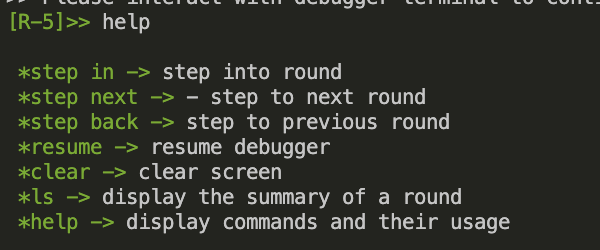
help: You can type help to see all the commands available at the round level in the debugger.
ls: The ls command at the round level will display generic information about the round.
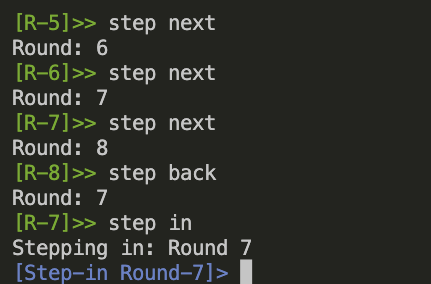
step next, step back, and step in: You can also use the step next, step back, and step in commands to navigate through the rounds.
After step in you can also type help to see the commands available inside a round.
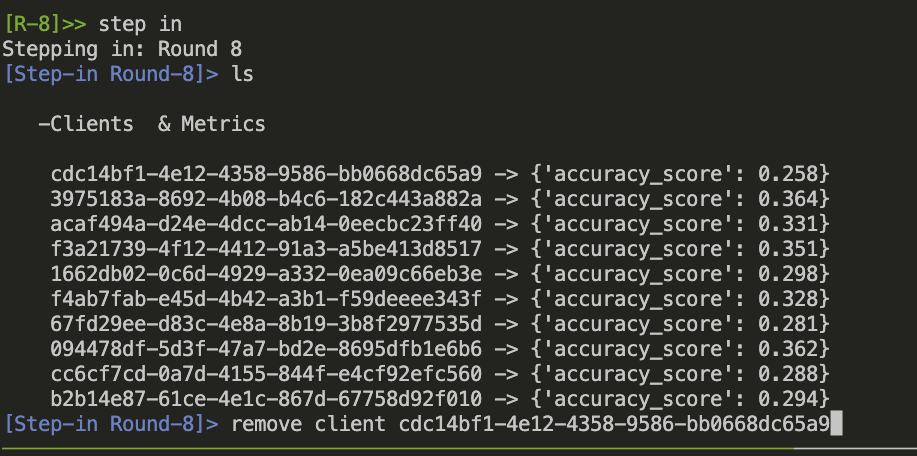
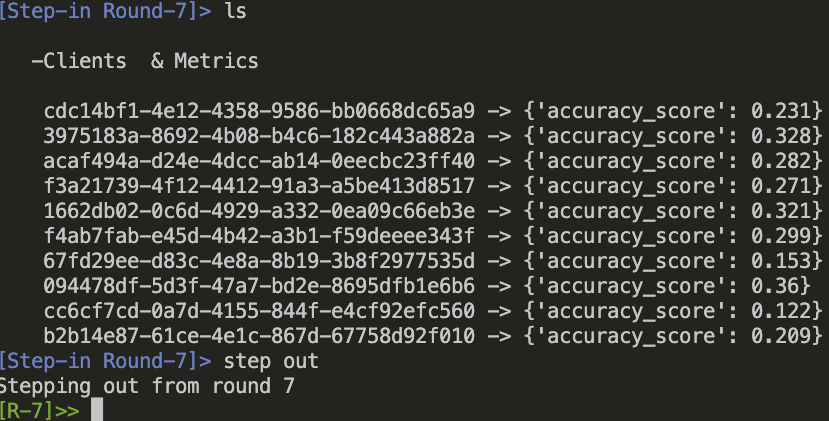
ls: You can use the ls command inside a round to display all the clients in the round with their accuracies.
agg: Similarly can also use the agg to partially aggregate the models from a subset of clients for the partial evaluation to inspect their performance.
Note: We have replace step in command inside the round with agg to avoid any confusion with step in command of rounds.
step out: To leave a round, you can also use the step out command to step out of a round.
remove client <client id>: Suppose that you identify a faulty client in round 8, you can remove its contribution from the round using the remove client <client id> command.
This will resume the training from round 9 instead of round 5, and the faulty client will not be included from round 8.
**Note: After removing the client, the training is complete. **
To check the functionality of resume command, restart the aggregator (python sim_agg.py) and clients ((python sim_party.py)) as explained above. Perform some actions (e.g., step in, step out, ls etc ), except remove client. Suppose that there is no faulty client and you want resume the training without any further debugging. You can type resume to resume training and you will see that the aggregator immediately displays the the output of all the rounds without any retraining.
At a given faulty round in an FL campaign, FedDebug can automatically identify faulty clients without needing test data or labels. The following steps provide a walk-through of this feature using both reconfigurable computational notebooks as well as local python setup.
Make sure you configure the notebook with GPU: Click Edit->notebook settings->hardware accelerator->GPU
Copy & paste the following commands in the first cell of notebook (e.g., artifact.ipynb) on Google Colab.
!pip install pytorch-lightning
!pip install matplotlib
!pip install diskcache
!pip install dotmap
!pip install torch torchvision torchaudio
!git clone https://github.com/SEED-VT/FedDebug.git
# appending the path
import sys
sys.path.append("FedDebug/fault-localization/")
Now you can run the artifact.ipynb (). You can run notebooks containing
FedDebug code with the above instructions. Note: You can uncomment the commands instead of copy & pasting if above commands are already in the given notebook.
The notebook is configured to use the following default settings, where the first client (client ID 0) is faulty (with noisy labels that distort the global FL model).
args.model = "resnet50" # [resnet18, resnet34, resnet50, densenet121, vgg16]
args.epochs = 2  # range 10-25
args.dataset = "cifar10" # ['cifar10', 'femnist']
args.clients = 5 # keep under 30 clients and use Resnet18, Resnet34, or Densenet to evaluate on Colab
args.faulty_clients_ids = "0" # can be multiple clients separated by comma e.g. "0,1,2"  but keep under args.clients clients and at max less than 7
args.noise_rate = 1  # noise rate 0 to 1
args.sampling = "iid" # [iid, "niid"]
Once the entire notebook is executed, the logs report the progress and eventually print the faulty client's id. This is printed in the form +++ Faulty Clients {0} where 0 is the client ID for each auto-generated input (default is 10). It also reports the final localization accuracy.
-
Create a conda environment for example:
conda create --name feddebug -
Activate environment:
conda activate feddebug -
Install necessary packages:
pip install pytorch-lightning
pip install matplotlib
pip install diskcache
pip install dotmap
pip install jupyterlab
pip install torch torchvision torchaudio
pip install jupyterlab
- Clone
FedDebugrepository and switch to it.
git clone https://github.com/SEED-VT/FedDebug.git
cd FedDebug/fault-localization
Note: Make sure you are in project directory
~/FedDebug/fault-localization.
- Run
jupyter-labcommand infault-localizationdirectory. It will open the jupyter-notebook in the project directory. Open and runartifact.ipynb. This should work without any errors.
See INSTALL.md for further instructions on how to setup your environment for fault localization.
Note: To run locally, make sure you have an NVIDIA GPU in your machine.
cifar10 and feminist data are downloaded automatically when running an evaluation script.
resnet18, resnet34, resnet50, vgg16, and Densenet121 are CNN model architectures used in evaluation.
We provide a single notebook artifact.ipynb () with all controlling arguments to evaluate any experimental settings. It can be executed on
Google Colab but keep clients under 30. Colab has limited computation power and RAM.
args.model = "resnet50" # [resnet18, resnet34, resnet50, densenet121, vgg16]
args.epochs = 2 # range 10-25
args.dataset = "cifar10" # ['cifar10', 'femnist']
args.clients = 5 # keep under 30 clients and use Resnet18, Resnet34, or Densenet to evaluate on Colab
args.faulty_clients_ids = "0" # can be multiple clients separated by comma e.g. "0,1,2" but keep under args.clients clients and at max less than 7
args.noise_rate = 1 # noise rate 0.1 to 1
args.sampling = "iid" # [iid, "niid"]
Although artifact.ipynb is sufficient to evaluate any configuration of FedDebug, we further extended it to reproduce the major results with just a single click on Google Colab except the scalability result Reproduce_Figure9.ipynb. You can reproduce the scalability result on a local machine which has enough resources to train 400 models.
Note: We have scaled down the the experiments (e.g., reduce the number of epochs, small number of clients, etc) to assist reviewers to quickly validate the fundamentals of
FedDebugand fit withGoogle Colabresources. However, you are welcome to test it with any valid FL configuration. Furthermore, if you see an unexpected result, please increase the number ofepochsto the value mention inSection V: Evaluationsand readSection V.D Threat To Validity section.
-
Reproduce_Figure4-Figure7.ipynb: Figure 4 shows that lower
noise ratedoes not impact the performance of the global model and only highnoise ratedegrade its performance. Although low noise rates do not deteriorate global model significantly,Figure 7shows thatFedDebughas the capability to localize thefaulty clientswith low noise rate. -
Reproduce_Figure9.ipynb: In several prior work simulations, researchers have use a very few clients to participate in a round (usually 10~clients). We challenged our approach to consider hundreds of clients to participate in a round and this notebook shows the result of this evaluation. This notebook cannot run on free available resources of theGoogle Colab. We conducted this experiment on an AMD 16-core processor, with 128 GB RAM and an NVIDIA Tesla T4 GPU. -
Reproduce_Figure10.ipynb: This notebook reproduces the results of
Figure 10which shows theFedDebugperformance on different neuron activation thresholds. We found activation threshold less than 0.01 to perform well across all the experiments. By default,FedDebuguses neuron activation threshold of0.003. -
Reproduce_Table1-Table2.ipynb: Table 1 and Table 2 show the performance of
FedDebugin IID and Non-IID data distribution settings. This notebook contains the representative settings of these two tables. Feel free to test other configurations as well.


