- In this project, some climate analysis is done for a trip to a long holiday vacation in Honolulu, Hawaii! And the following steps were taken:

In this analysis, Python, SQLAlchemy and Matplotlib are used for the data exploration of your climate database.
- First, use a database, hawaii.sqlite file and then
- Choose a start date and end date for the trip
- Use SQLAlchemy create_engine to connect to the sqlite database using SQLAlchemy.
- Use SQLAlchemy automap_base() to Reflect the tables into classes and save a reference to these classes
-
Design a query to retrieve the last 12 months of precipitation data.
-
Select only the
dateandprcpvalues. -
Load the query results into a Pandas DataFrame and set the index to the date column.
-
Sort the DataFrame values by
date. -
Plot the results using the DataFrame
plotmethod.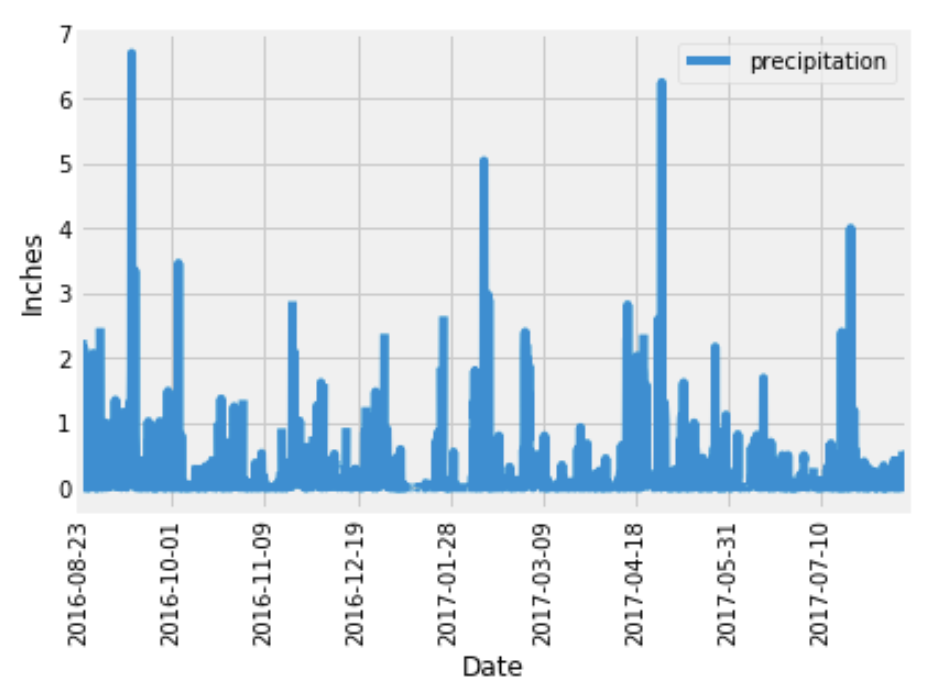
-
Use Pandas to print the summary statistics for the precipitation data.

-
Design a query to calculate the total number of stations.
-
Design a query to find the most active stations.
-
List the stations and observation counts in descending order.
-
Which station has the highest number of observations?
-
-
Design a query to retrieve the last 12 months of temperature observation data (TOBS).
-
Filter by the station with the highest number of observations.
-
Plot the results as a histogram with
bins=12.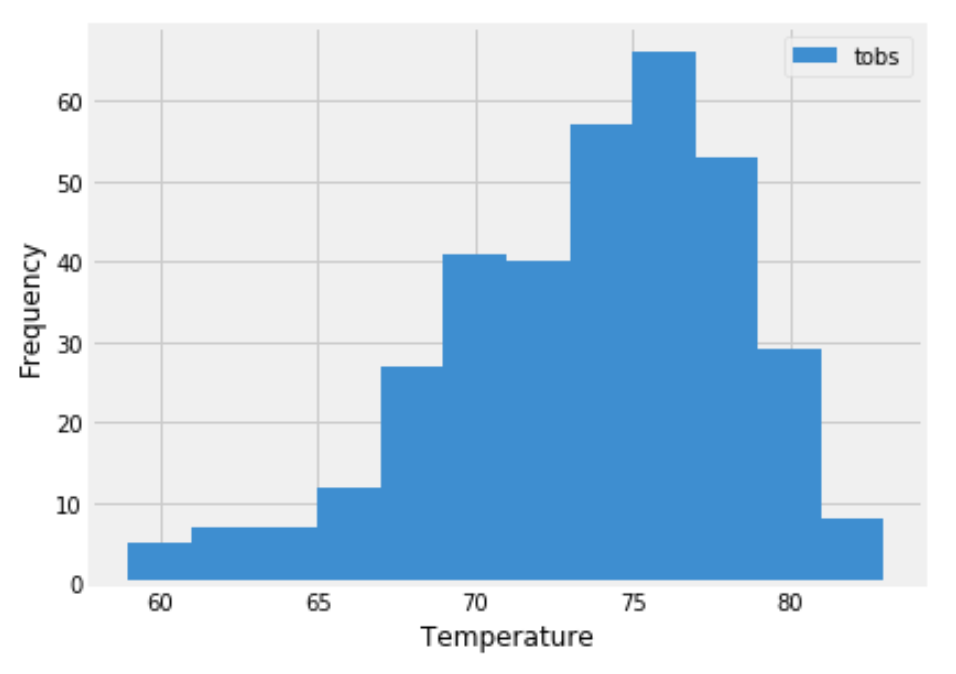
-

Design a Flask API based on the queries.
-
/-
Home page.
-
List all routes that are available.
-
-
/api/v1.0/precipitation-
Convert the query results to a dictionary using
dateas the key andprcpas the value. -
Return the JSON representation of your dictionary.
-
-
/api/v1.0/stations- Return a JSON list of stations from the dataset.
-
/api/v1.0/tobs-
Query the dates and temperature observations of the most active station for the last year of data.
-
Return a JSON list of temperature observations (TOBS) for the previous year.
-
-
/api/v1.0/<start>and/api/v1.0/<start>/<end>-
Return a JSON list of the minimum temperature, the average temperature, and the max temperature for a given start or start-end range.
-
When given the start only, calculate
TMIN,TAVG, andTMAXfor all dates greater than and equal to the start date. -
When given the start and the end date, calculate the
TMIN,TAVG, andTMAXfor dates between the start and end date inclusive.
-
-
Hawaii is reputed to enjoy mild weather all year. Is there a meaningful difference between the temperature in, for example, June and December?
-
Use SQLAlchemy or pandas's read_csv().
-
Identify the average temperature in June at all stations across all available years in the dataset as well as for December temperature.
-
Use the t-test to determine whether the difference in the means and why?, if there any statistically significant.
-
Use the
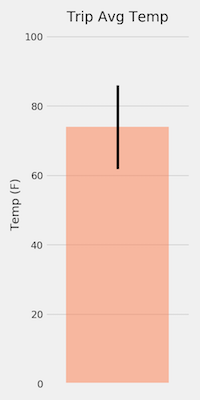
calc_tempsfunction to calculate the min, avg, and max temperatures for your trip using the matching dates from the previous year (i.e., use "2017-01-01" if your trip start date was "2018-01-01"). -
Plot the min, avg, and max temperature from your previous query as a bar chart.
-
Use the average temperature as the bar height.
-
Use the peak-to-peak (TMAX-TMIN) value as the y error bar (YERR).
-

-
Calculate the rainfall per weather station using the previous year's matching dates.
-
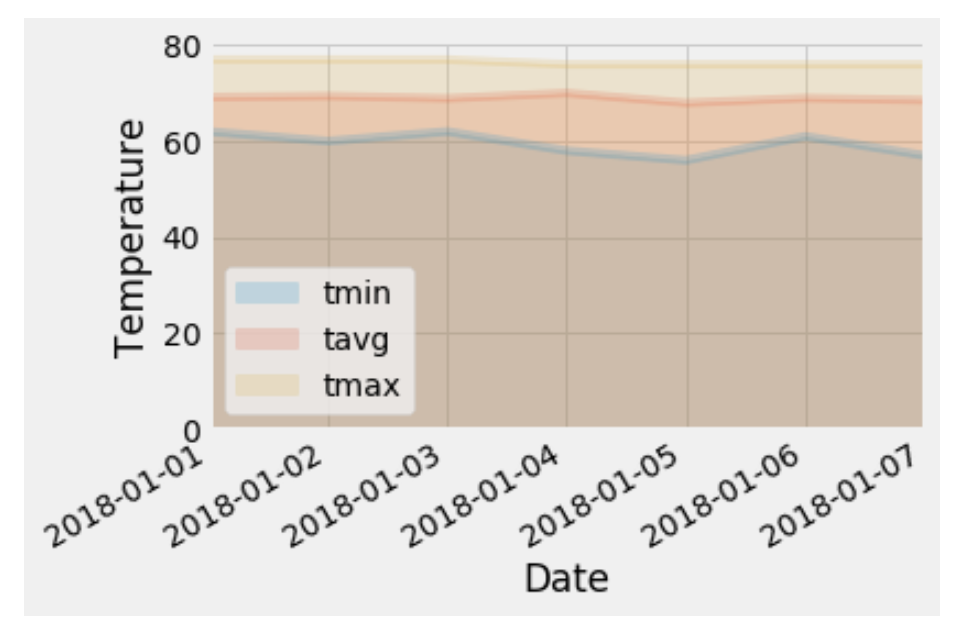
Calculate the daily normals. Normals are the averages for the min, avg, and max temperatures.
-
Create a list of dates for your trip in the format
%m-%d. Use thedaily_normalsfunction to calculate the normals for each date string and append the results to a list. -
Load the list of daily normals into a Pandas DataFrame and set the index equal to the date.
-
Use Pandas to plot an area plot (
stacked=False) for the daily normals.