MVC1_R provides a clean and intuitive interface for performing first order multivariate calibration on NIR spectroscopic data.
It's written as a web app in R shiny and free under the MIT License. You can install on R shiny server or try it here first.
The process of analysis is divided into four sections which must be completed
from left to right. Each tab provides a list of options to choose from, after
which you should click on the Apply changes button on the bottom to update
the state of the program.
The changes applied can be viewed on the right, and you can choose to view a plot of the data or the raw numbers in a table.
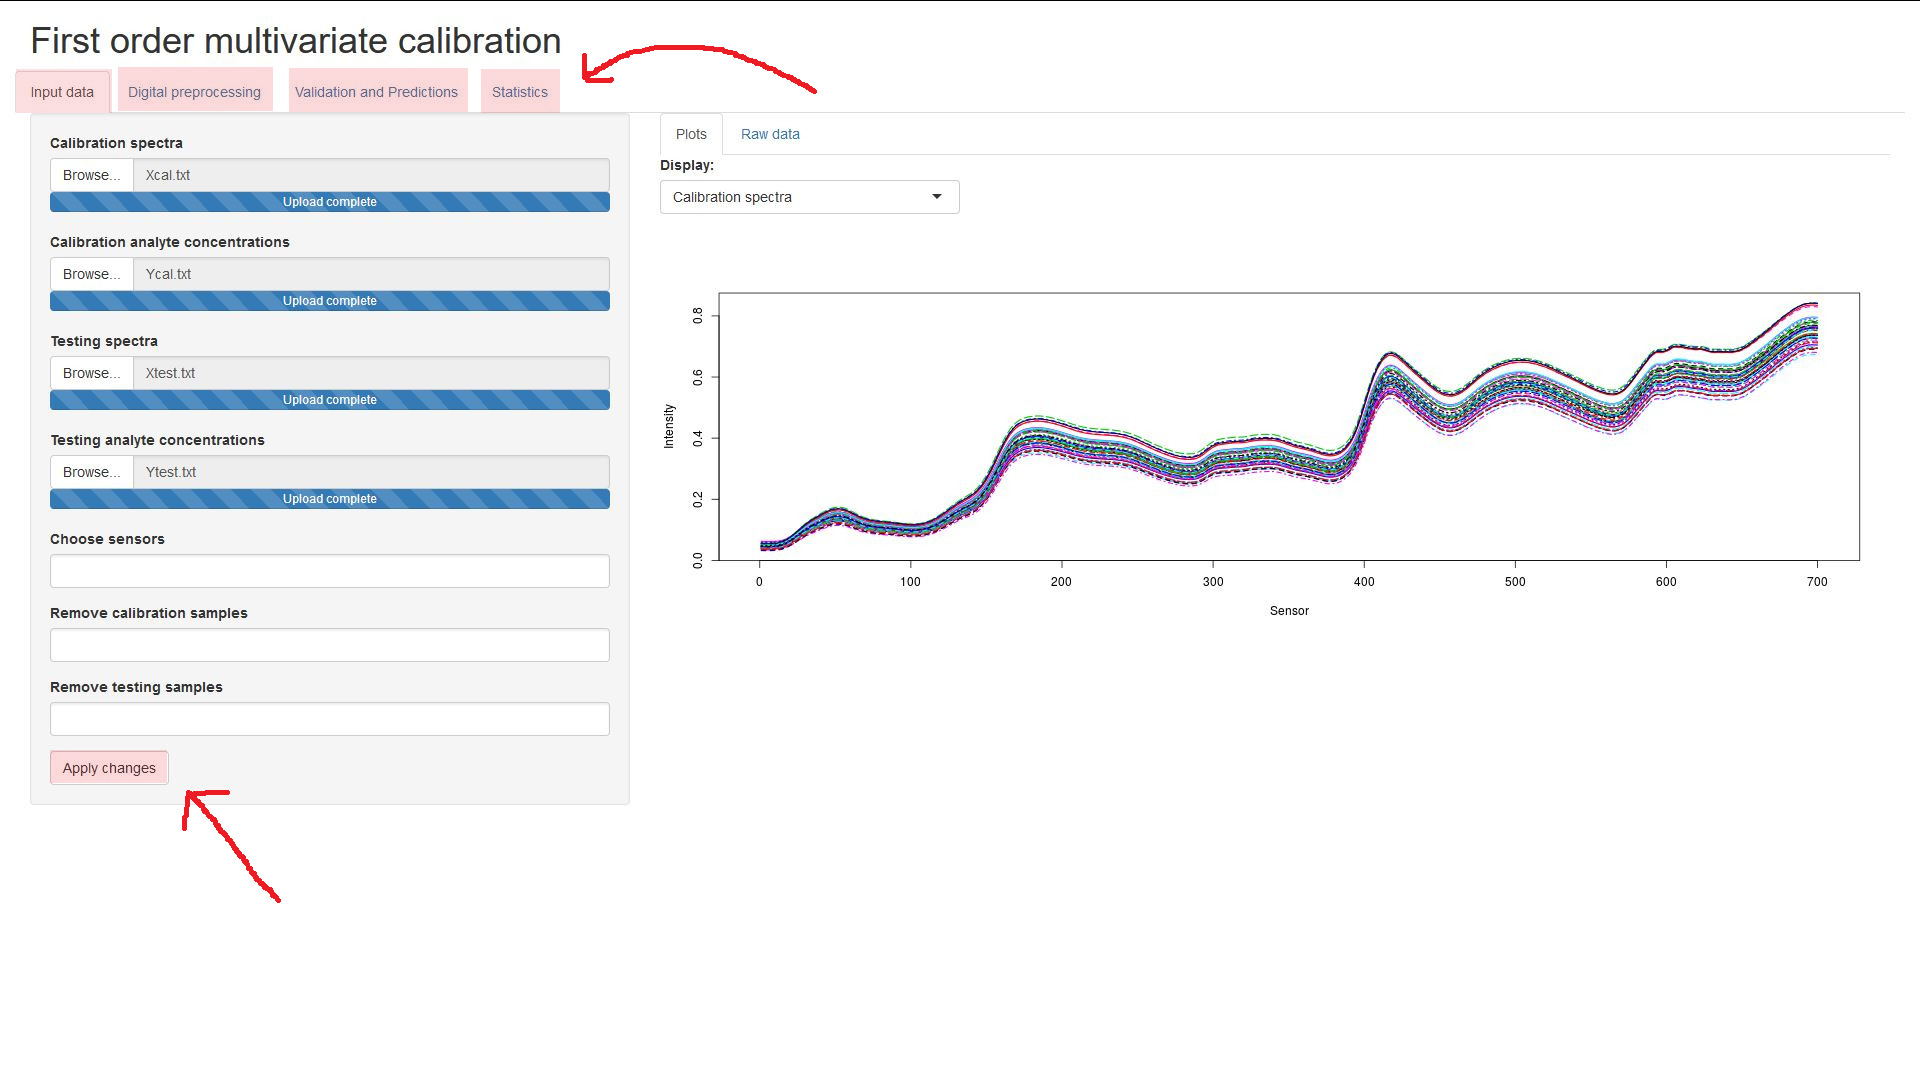
The input files are expected to be in a column-wise format, top-to-bottom and left-to-right. The sample spectra should be columns of values, the leftmost column being from the first sample. The sample concentrations should be arranged as a column of values, the topmost value being from the first sample.


A subset of the sensors from the spectra can be selected, written as a list of
pairs of numbers, representing the (closed) intervals of sensors to be kept.
Input must consist of only integers, without commas or brackets.
For example, the values 1 5 10 15 would select the sensors from the ranges
[1;5] and [10;15].
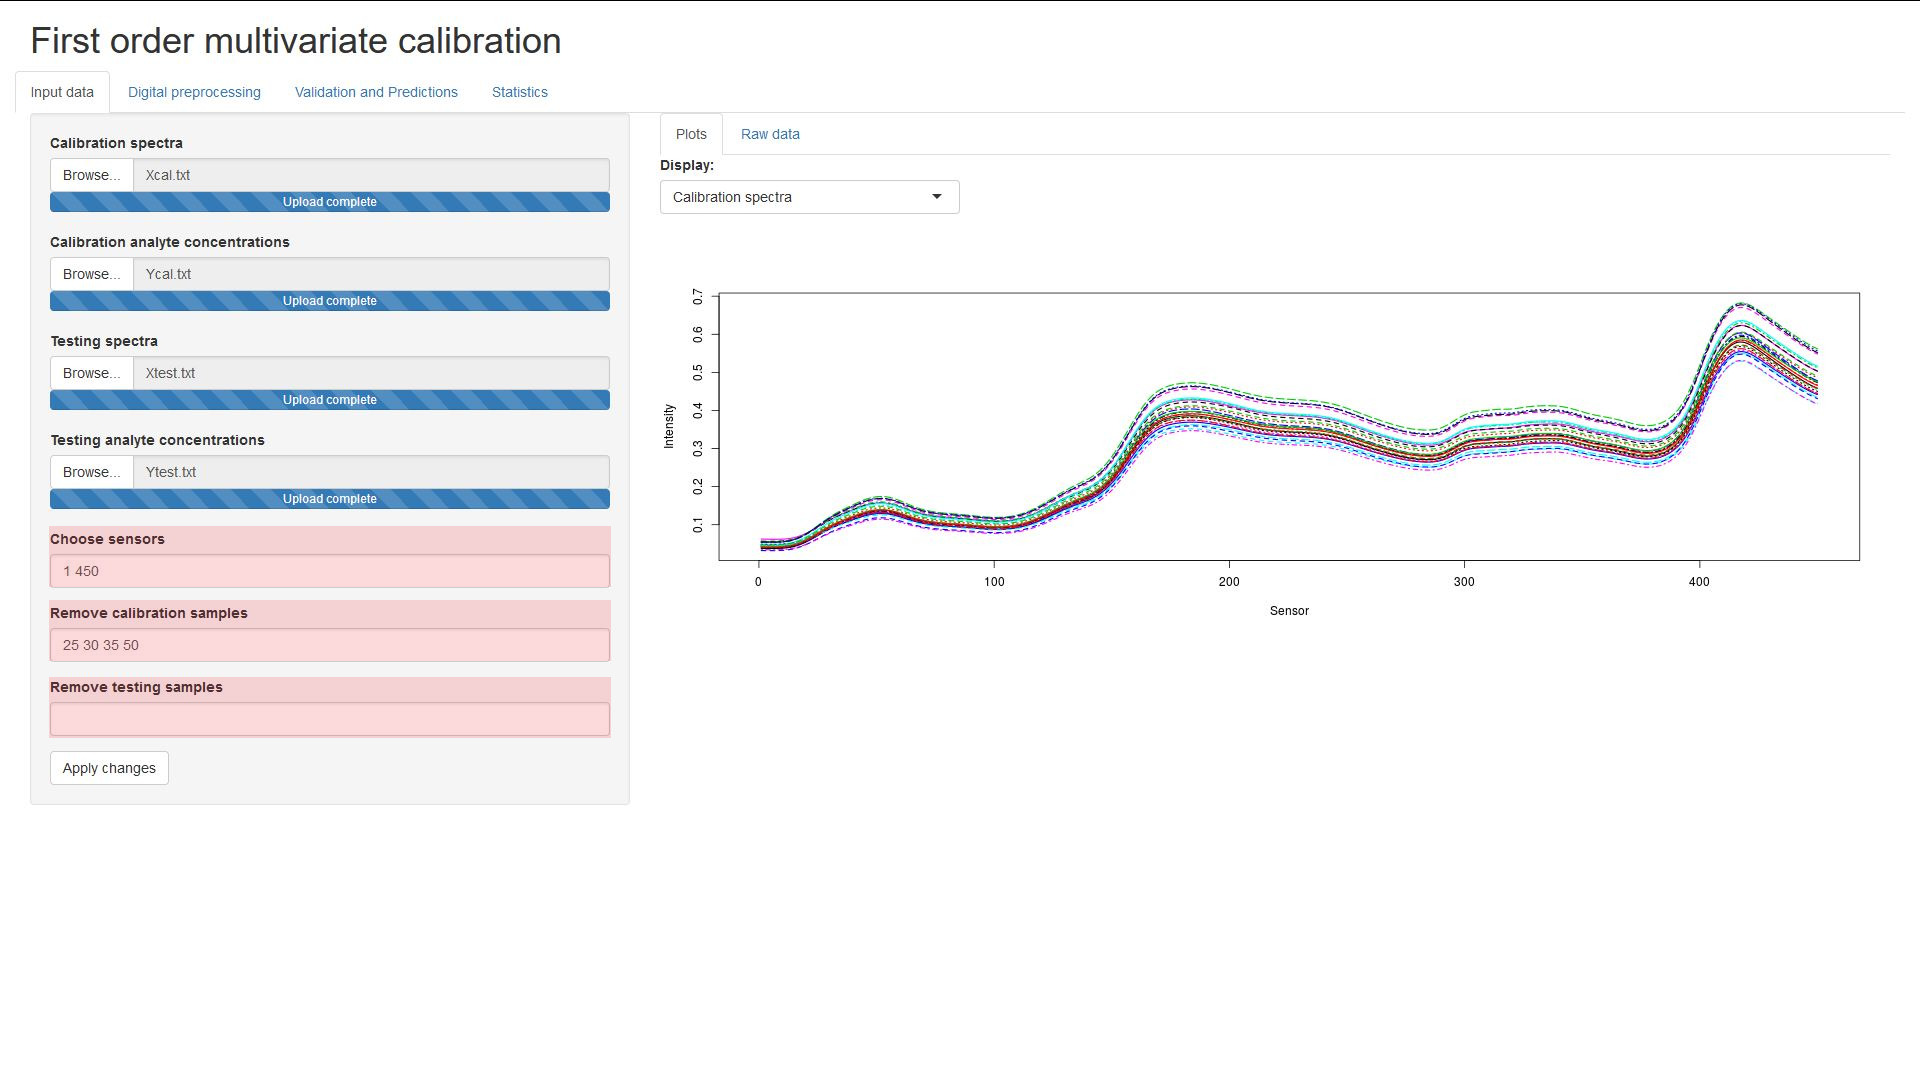
The input format is the same as when selecting sensors, you can remove samples by providing value ranges.
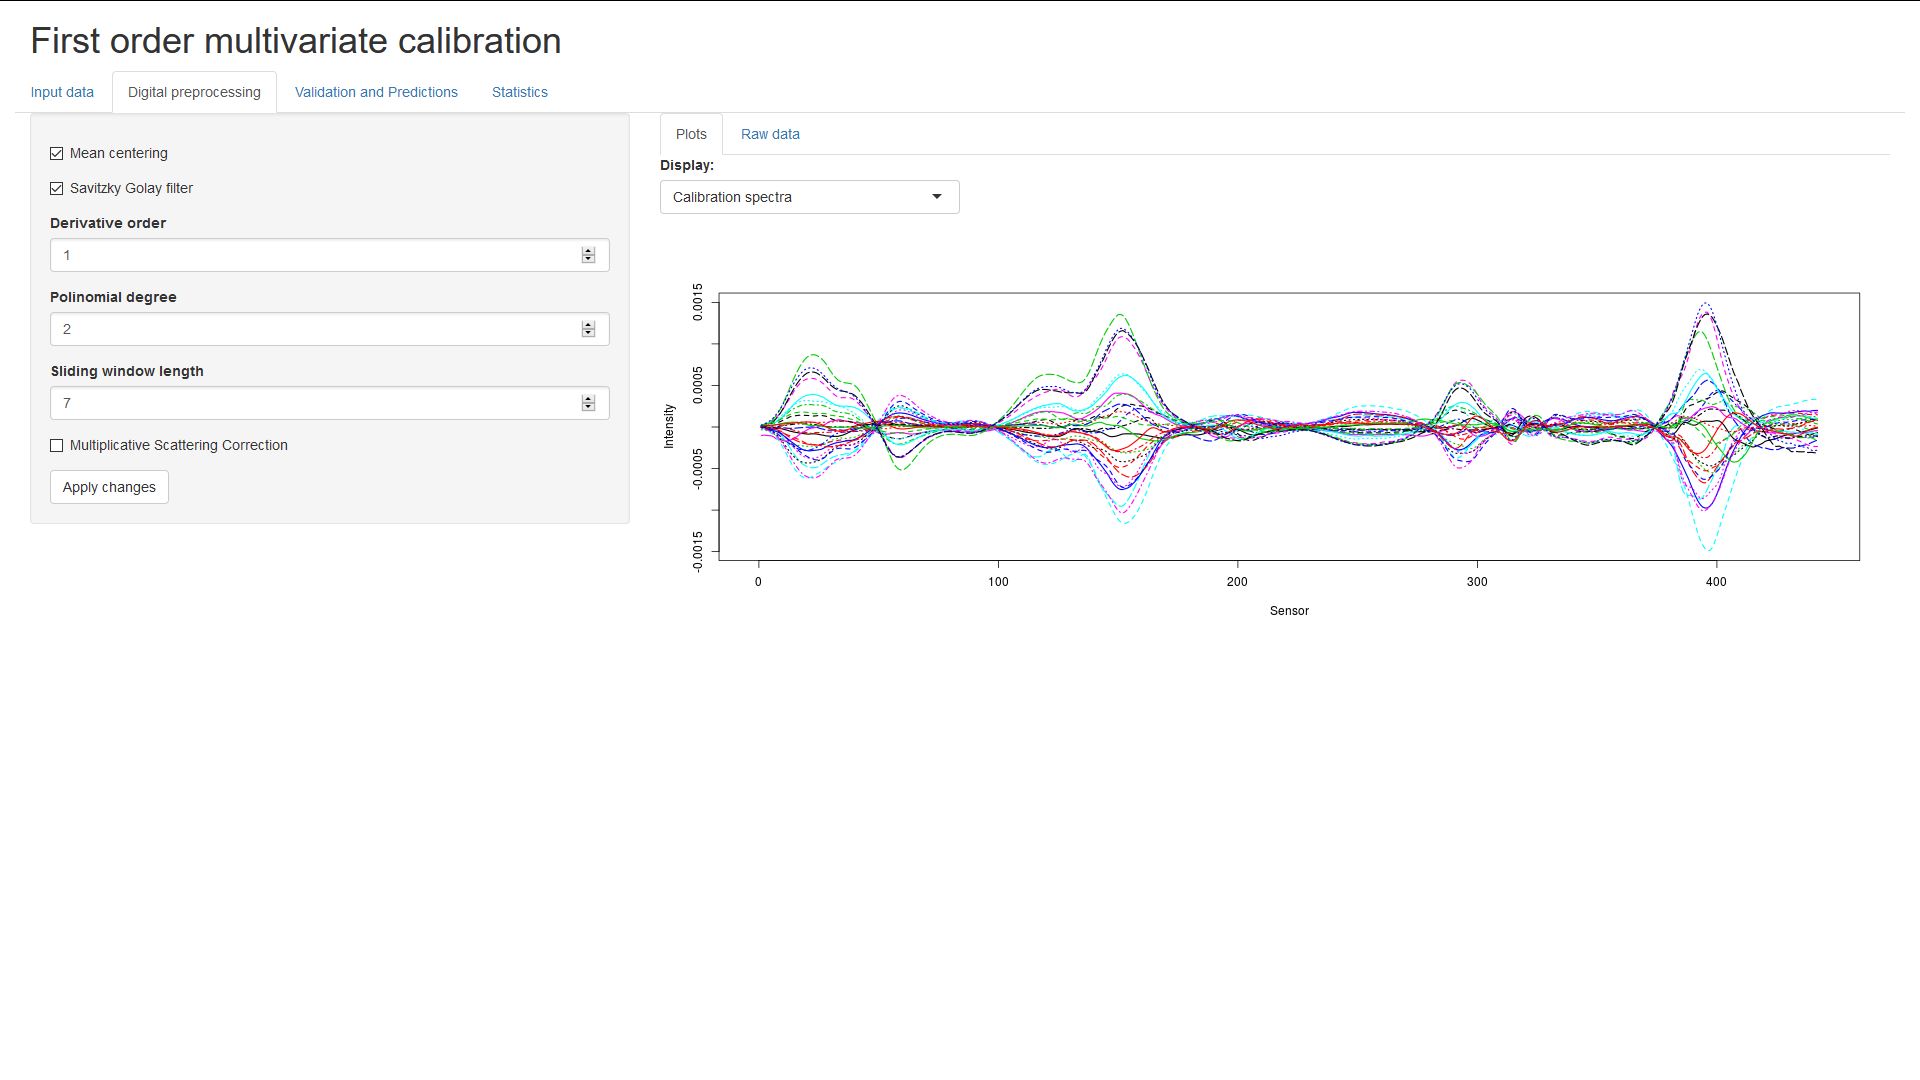
Methods of digital preprocessing can be selected by ticking the checkboxes.
(Remember to click on Apply changes!)
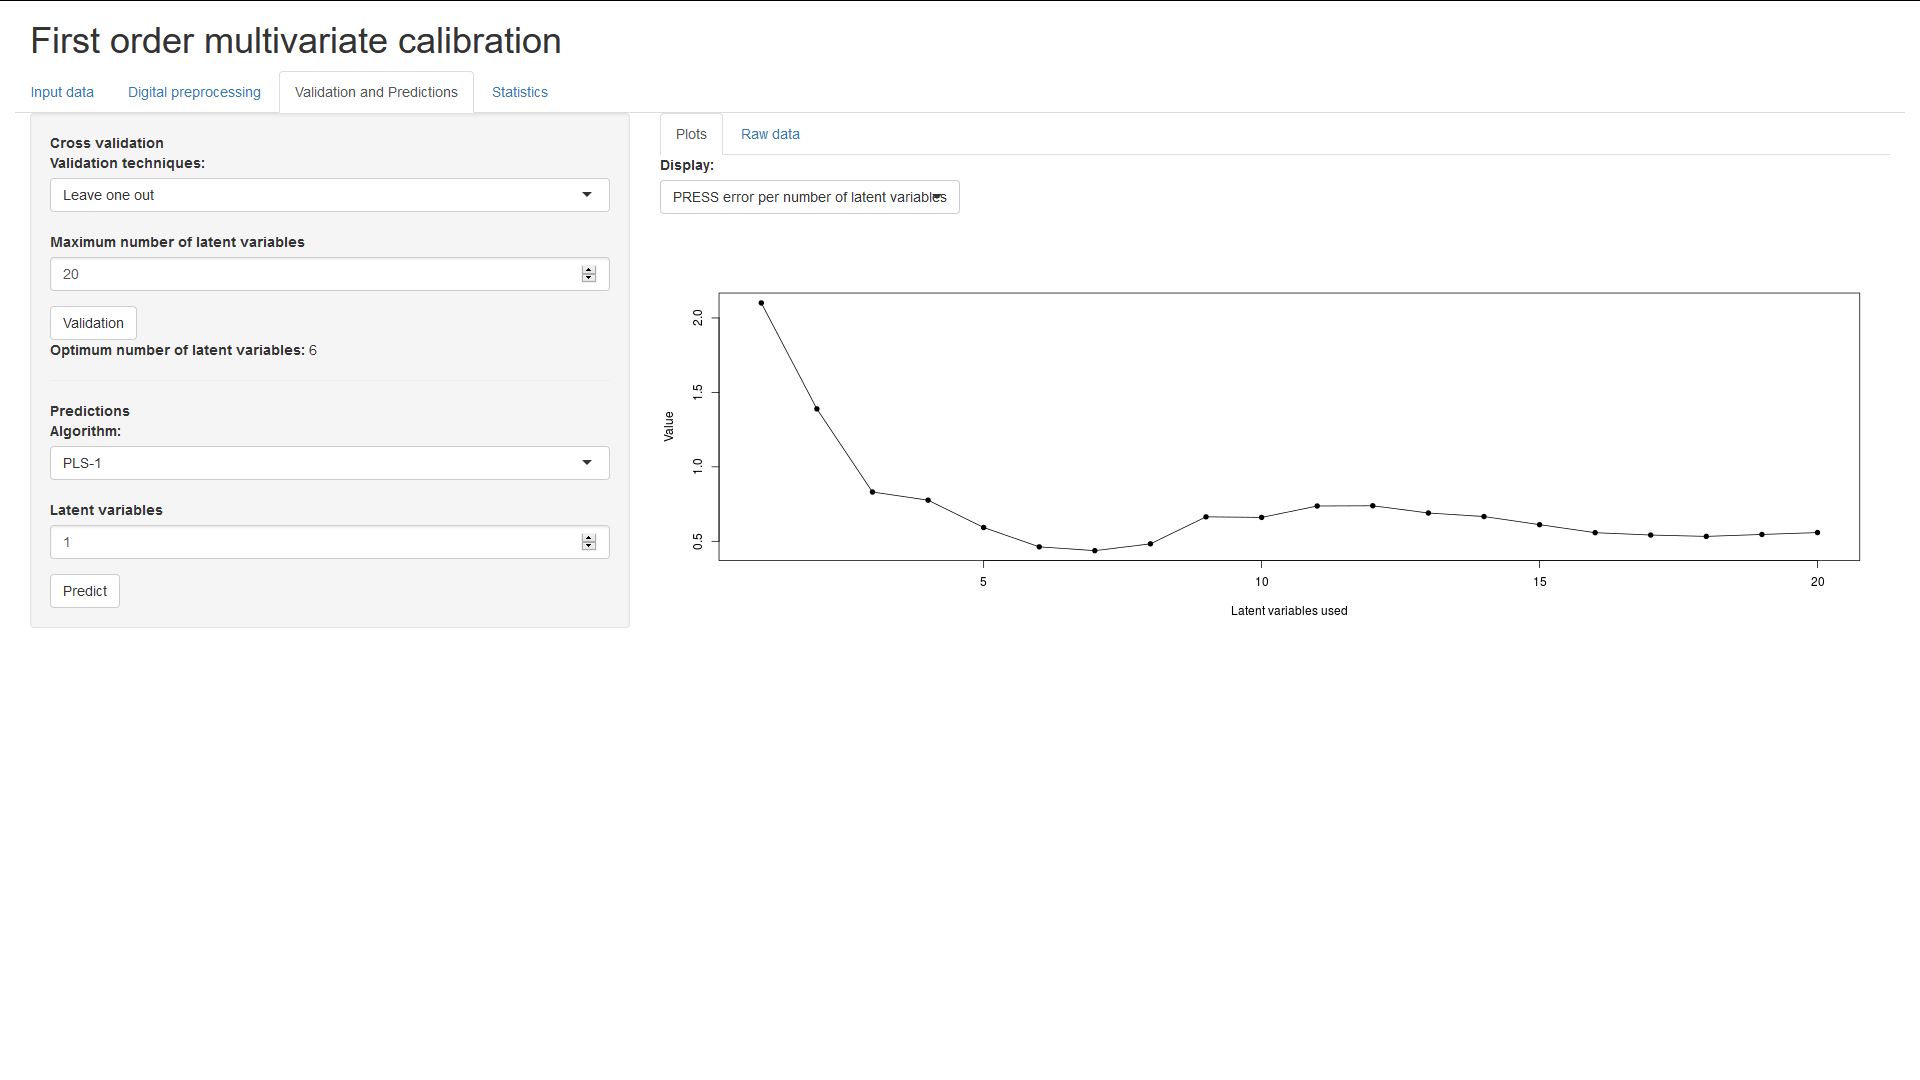
Here, you can choose a maximum number of latent variables and perform cross-validation. This will compute the PRESS error, the F statistic and it's associated probability, for each number of latent variables from 1 to the upper limit.
The optimum number of latent variables thing will display the first amount of
latent variables for which the associated probability is less than 0.75 (this is
based on empirical results by Thomas and Haaland, 1988).
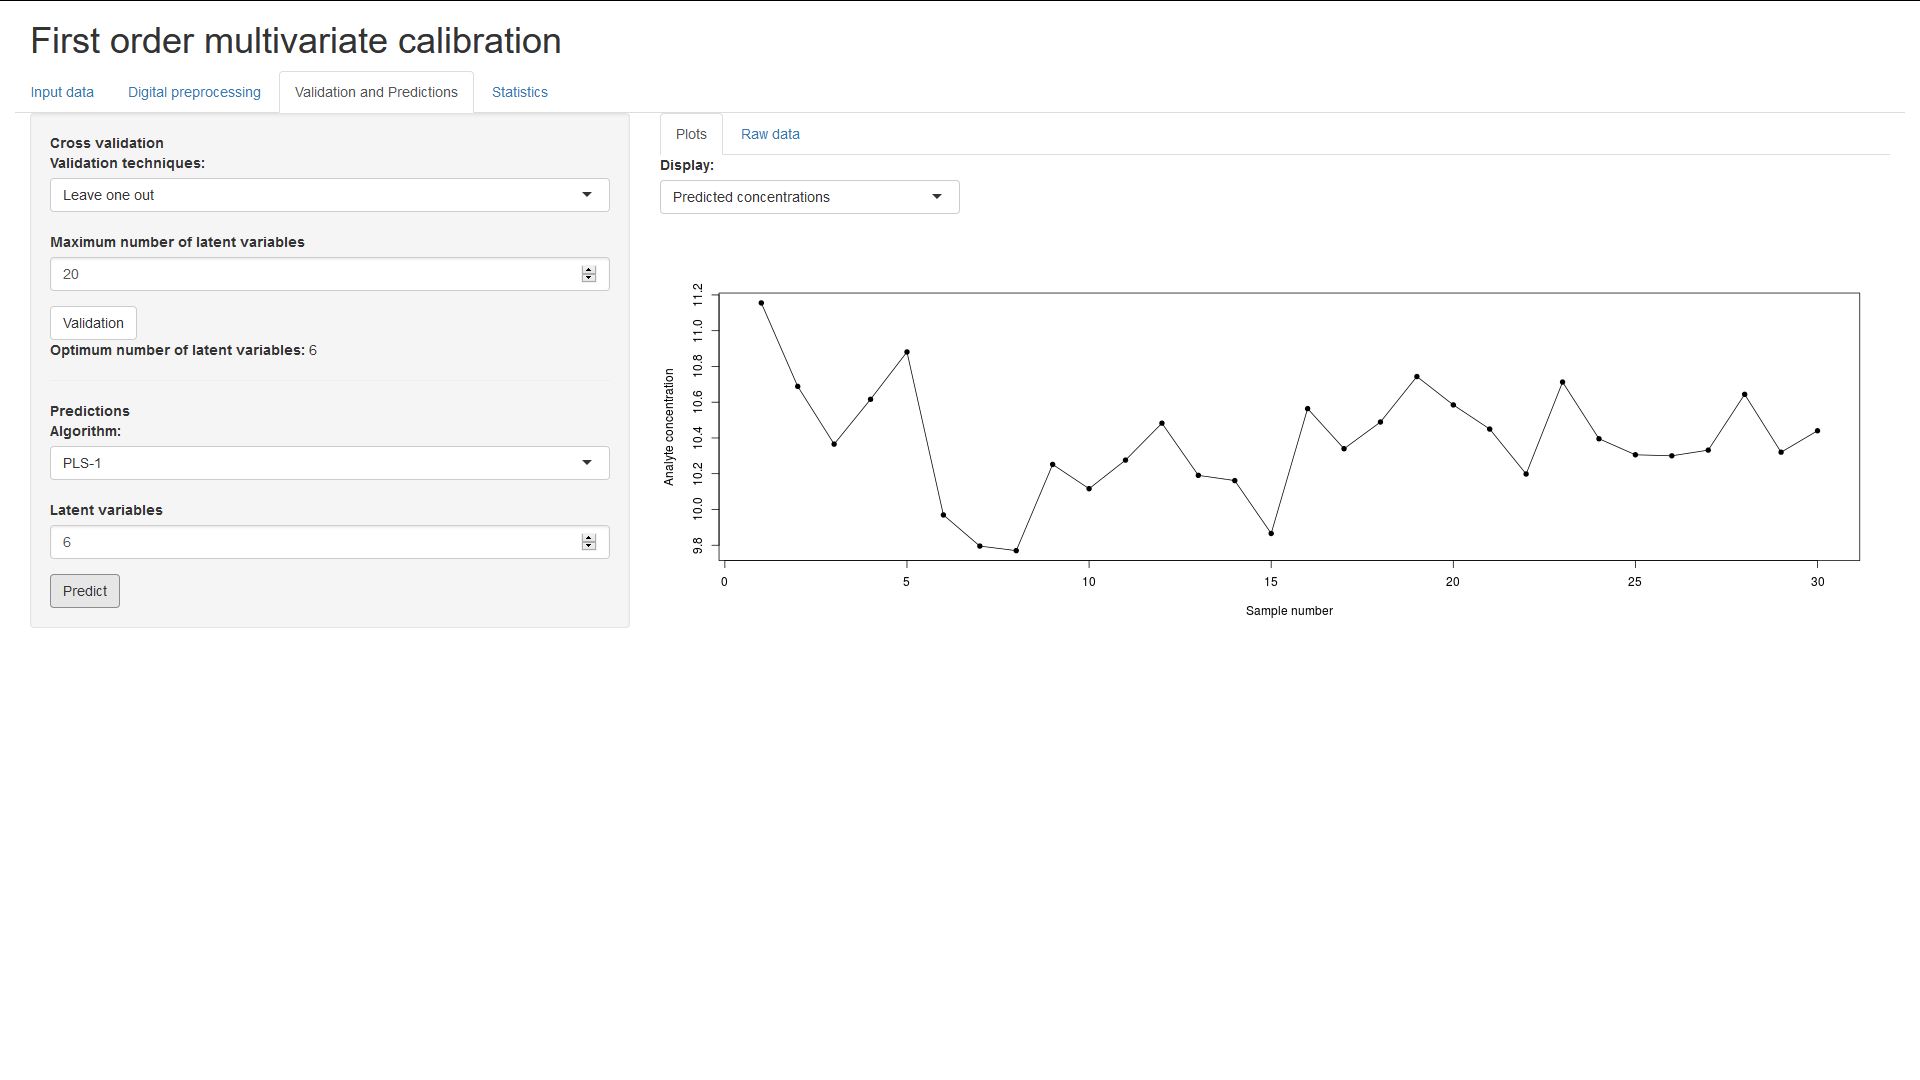
And on the bottom you can choose a number of latent variables to produce
regression coefficients and predict the analyte concentrations from the
validation data set.
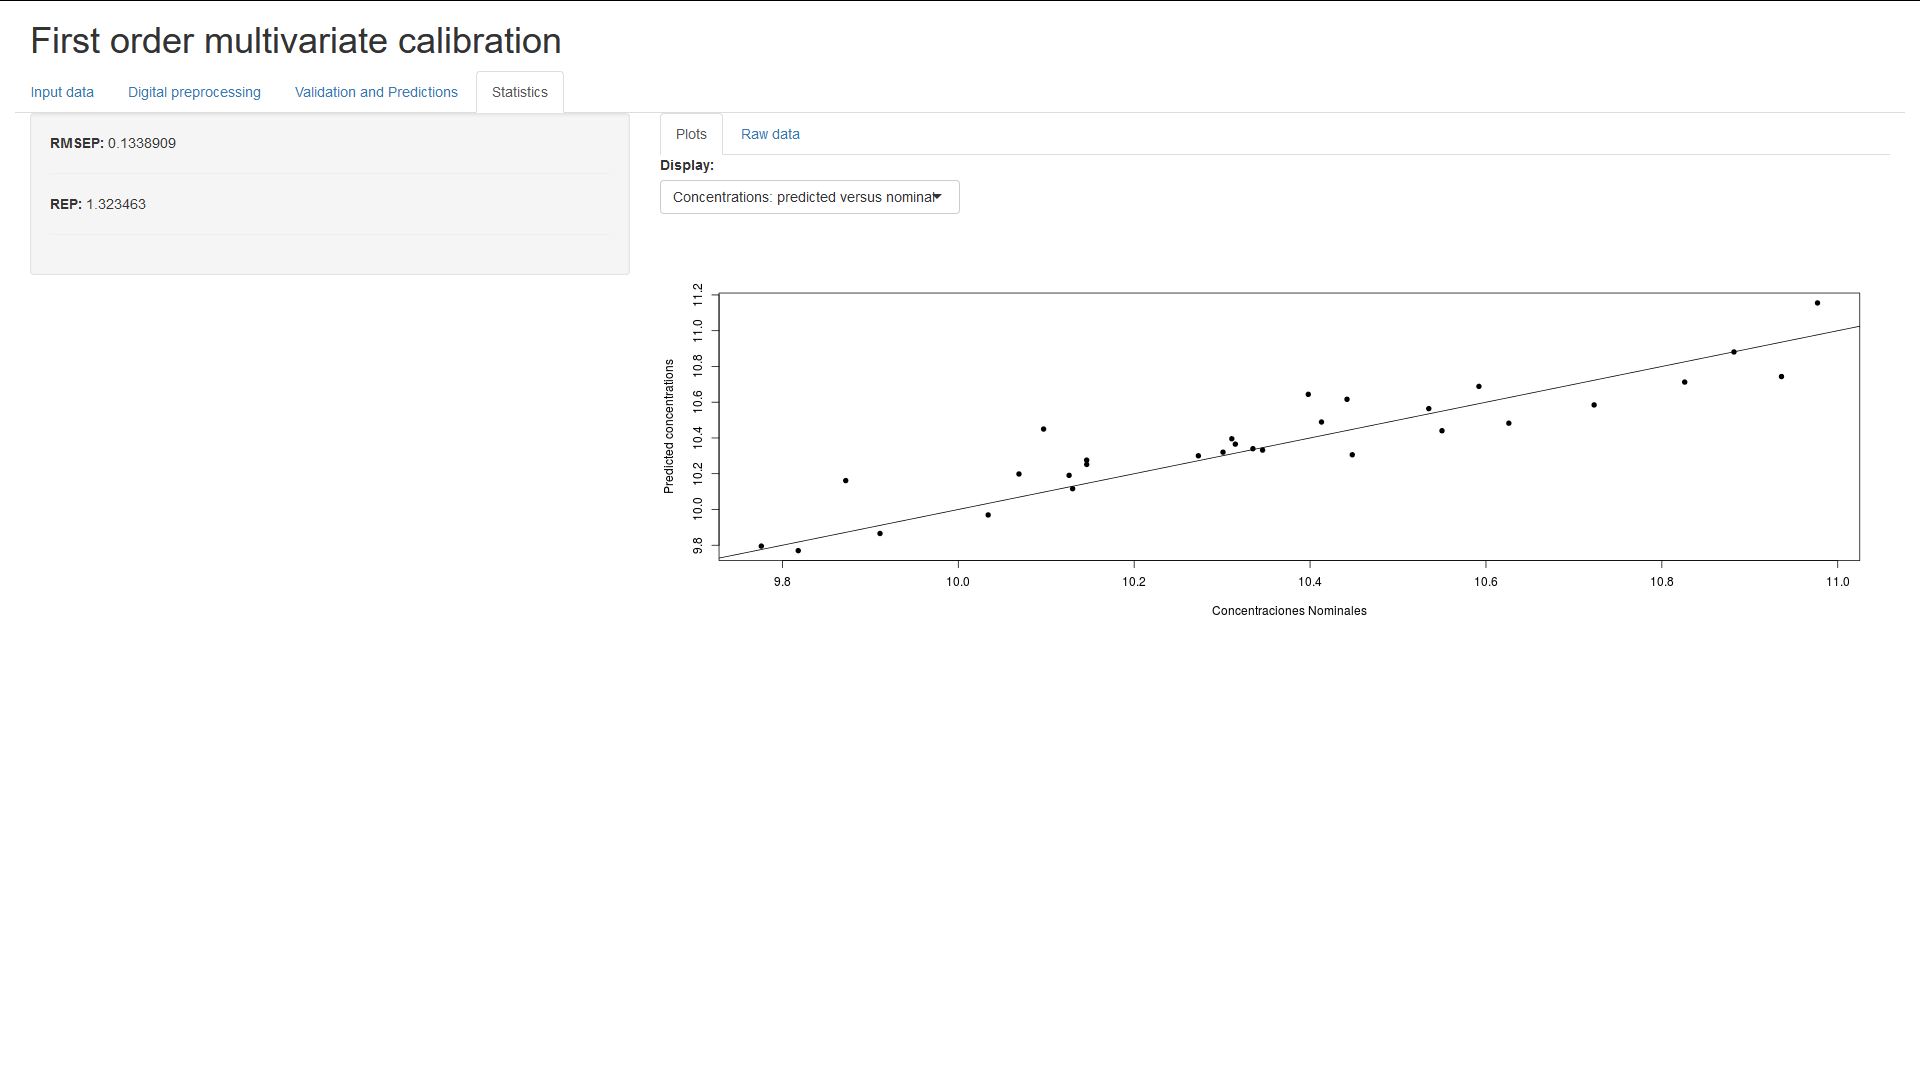
Finally, in this section the RMSEP (Root Mean Square Error of Prediction) and
REP (Relative Error of Prediction are shown). You can also see a linear fit plot
of the predicted and nominal concentrations, and the error of prediction for
each individual sample.