Web App for Real-Time Monitoring CAN Bus Data on a Raspberry Pi.
- Try
demo.pyon your PC first without a PI (see further instructions below)!!
This Web App is based on the Python-Dash by Plotly Framework. It is running multiple threads. The first thread reads in the Can-Bus data from the PiCAN2 Board into a global queue. The second thread takes values from the global queue and filters the CAN messages into different local queques. The third thread runs the dash-web app with multiple callbacks updating the values from local queques into live plotting visualizations.
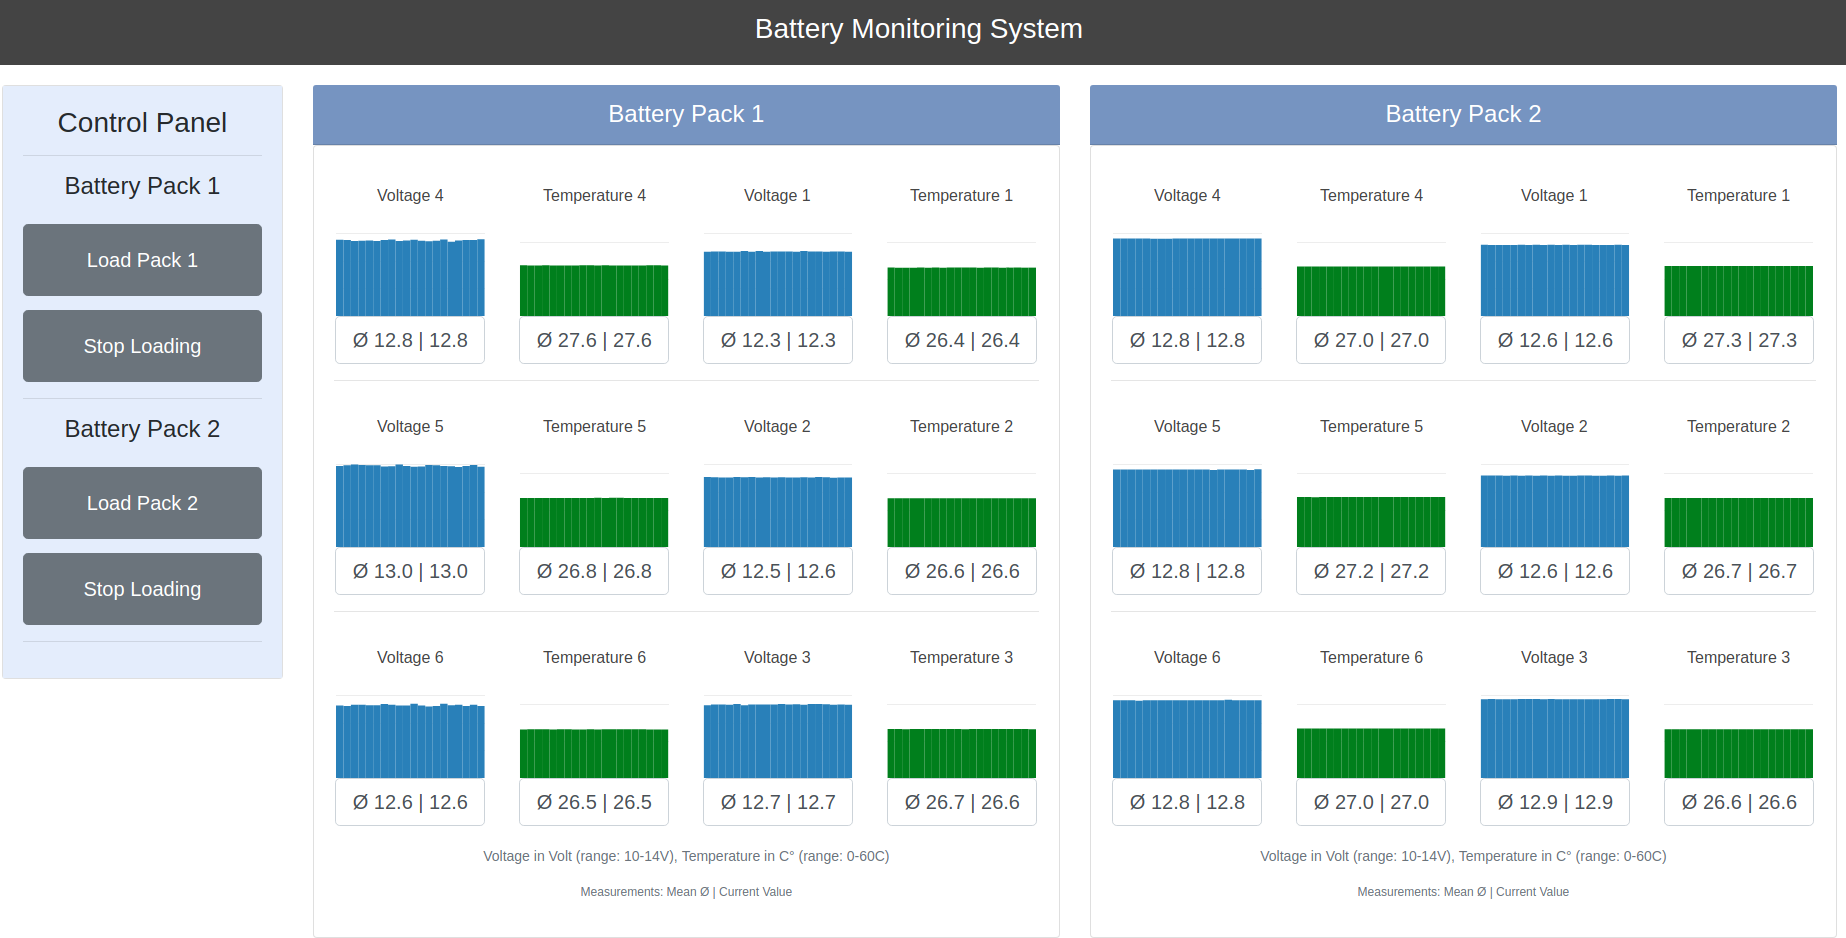
The app layout is build as Single Page Application (SPA). On the left side, there is a Control Panel with various buttons e.g. to charge or stop charging the battery pack. On the right side, you will find visualizations for cell temperatures and voltages.
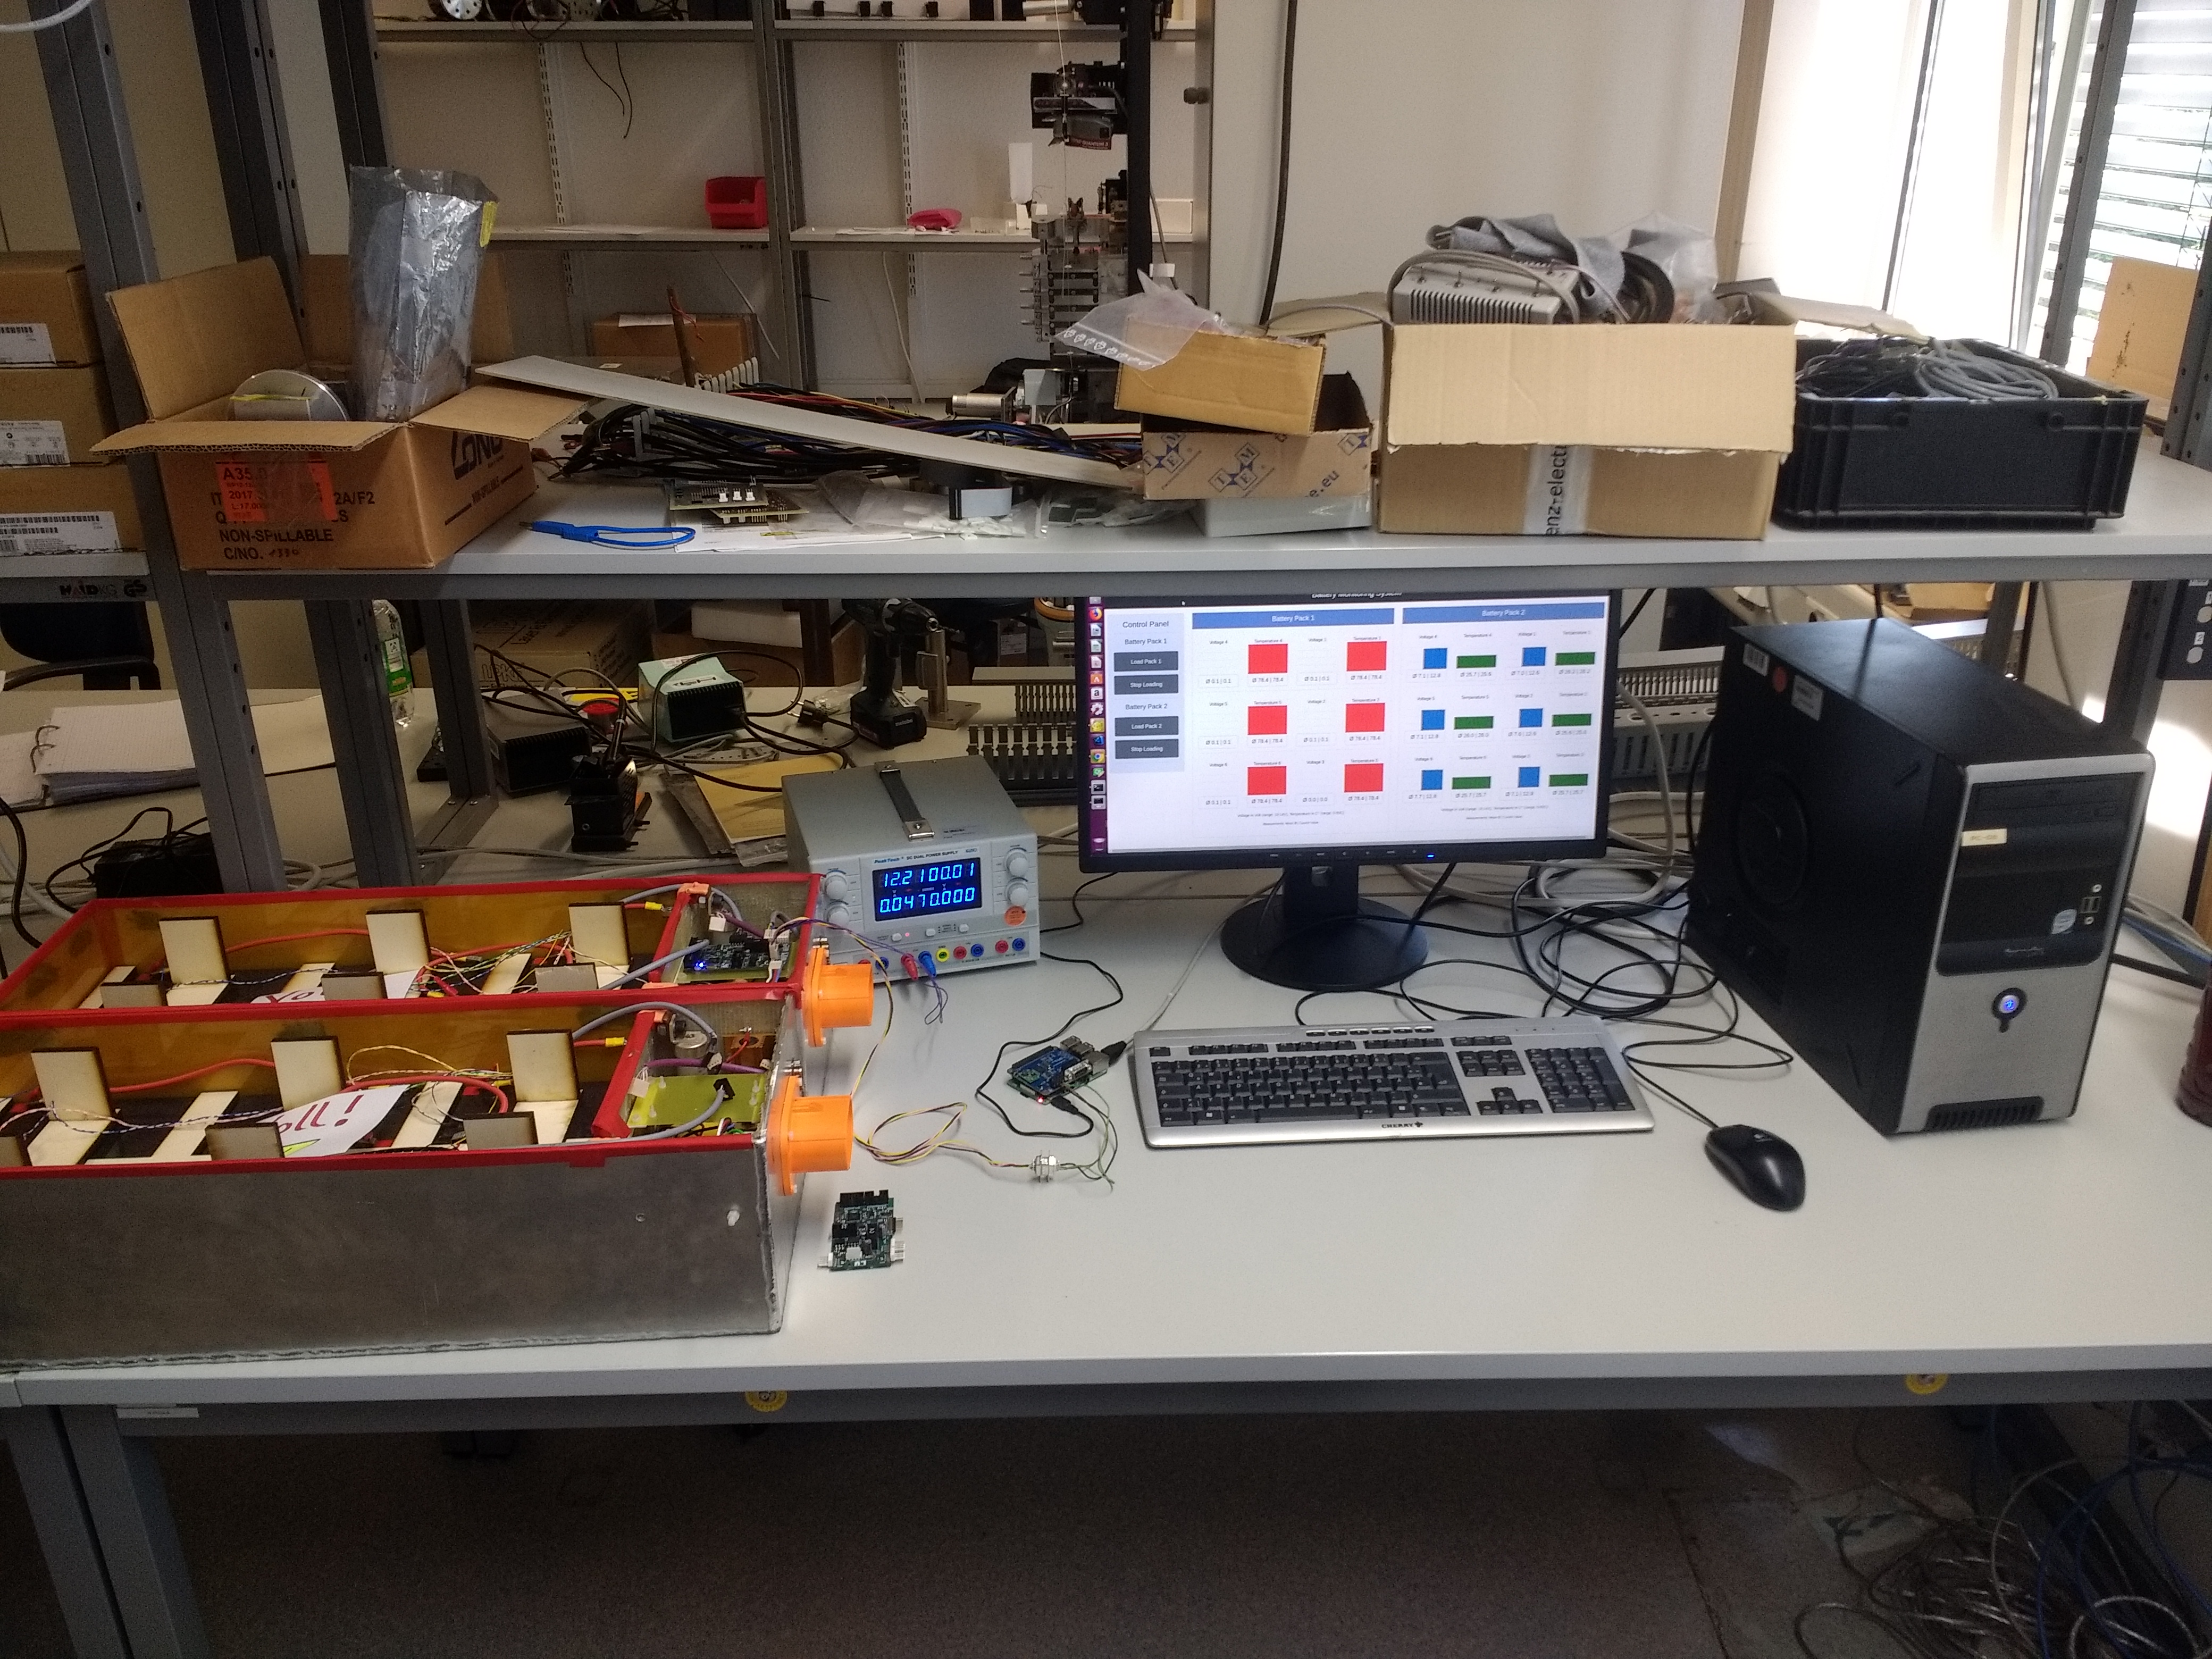
Here is an example of the complete Hardware Setup. There are two battery packs equipped with 6 battery cells each and a Battery Monitoring System (The green BMS are located at the top right yellow part of each pack next to the orange power connectors). Each BMS sends out Voltages and Temperatures via CAN bus to the RPi (The blue PI CAN board with the green RPI in the middle of the Picture). The Pi is connected to the internet (here gray cable: ethernet, alternatively use wlan) and the Battery Monitoring Web App is displayed in the browser of the host PC (screen on the right side). You can see live plotting of Voltages and Temperatures of the right Battery Pack (blue and green) while the left Battery Pack is currently disconnected (Error, red Values).
The good news, from the software side all you need Python (everything in one file)!!
First, install all Python dependencies in the requirements.txt file and upgrade plotly:
pip3 install -r requirements.txt && pip3 install plotly --upgrade
If you just interested to see the demo, run the command below. It will show you random plots without the PiCan Api. You can run the demo on your Host PC without need of a RPI. Just enter the IP of your PC at the end of the script, run the command below and open up a web-browser.
python3 demo.py
To run the full app on the RPI, you need the PiCan2 Board. Do the setup of the board interface first by following these instructions PiCan2 Installation.
After you setup the PiCan2 interface and you installed all dependencies on the RPI (see above), you need to open the script run_app.py and set the IP of your Raspberry Pi at the end of the script. Go to line 866 in run_app.py and set your IP e.g. IP = '192.168.200.1'. Finally, run the script with:
python3 run_app.py
Access your favorite browser in your local network by entering the IP and port number e.g. 192.168.200.1:9999.
Notice, dependent on the amount of your data, the PI might have performance issues to load the app fast. However, PCs in your network should be able to load the page without problems (The bottleneck are the update times of the callbacks. In case of problems, try to change them).

