A stochastic discrete spatiotemporal model of eco-evolutionary feedbacks in contact-networks.
Covid-19 pandemic as a model system to explore eco-evolutionary feedbacks. This is to say how ecological dynamics driven by connectivity dynamics (i.e. lockdowns) interact with new variants. The specific goal is to modeling mobility dynamics and age-dependent mortality rate at local regional and global scales (NODE: city, and country). Inference includes Susceptible (S), Infected (I), Recovered (R) and Deaths (D) counts for four different connectivity scenarios: isolated, fully connected, connectivity dynamics (i.e., lockdowns) and empirical mobility estimations.
https://github.com/SwissTPH/OpenCOVID
How do virulence-dispersion trade-offs along a gradient of connectivity dynamics change the number and patterns of infection waves and mortality rates?
- eSIRevo: Eco-evo dynamics (trade-offs virulence-dispersion rate plus connectivity rate).
- Parameters: mutation and virulence rates and gradient along dispersal rate --> virulence by matching
Hierarchical ABM :: Julia Agents.jl or EvoDynamics.jl :
https://github.com/JuliaDynamics/Agents.jl

https://github.com/kavir1698/EvoDynamics.jl

Bayesian Scientist:: Machine scientist -- code in python at https://bitbucket.org/rguimera/machine-scientist

Keywords:

SIR :: Agent-based, single trait, spatially explicit, evolving interaction trait: virus much higher than humans, age-structured,

Time-dependent state variables: interaction trait (matching process), susceptibles, infected, recovered
Eco-evolutionary spatial dynamics of contact networks: Covid-19 as a case study.
Eco-evo dynamics of hot- and cold- urban spots in the human-Covid-19 interaction
-
$S_{[t]i} = S{[t-1]i} - b(c)\times S{[t-1]i} \times I{[t-1]i} - m\times S{[t-1]{ji}} + m\times S{[t-1]{ij}} + s\times R{[t-1]i} - ds\times S{[t-1]_i}$
-
$I_{[t]i} = I{[t-1]i} + b(c)\times S{[t-1]i} \times I{[t-1]i} - a\times I{[t-1]i} - m\times I{[t-1]{ji}} + m\times I{[t-1]{ij}} - dI\times I{[t-1]_{i}}$
-
$R[t]i = R[t-1]i + a\times I[t-1]i - m\times I[t-1]{ji} + m\times I[t-1]{ij} - s\times R[t-1]{i} - dr\times R[t-1]_i$
- b: susceptible to infectious transmission rate
- c: susceptible to infectious contact rate
- m: migration rate to/from site j
- r: radius connecting sites i and j : sinusoidal function depending with radius, r, depending on Frequency (f) and Amplitude (w).
- v: virulence rate
- mu: mutation rate (how many mutations to produce a new variant?)
- s: recovered to susceptible rate
- a: infected to recovered rate
- d: death rate (ds, dI, dr)
- Process-based knowledge graph to explore populations of models. For example, the SIR equations per NODE described above can be generalized to have Sn nodes for the susceptible (i.e., age classes), In nodes for the infected, and Rn nodes for the recovered. In addition, there might be other node types, like exposed, unreported and reported infectious and hospitalized.
%https://stackoverflow.com/questions/14494747/how-to-add-images-to-readme-md-on-github

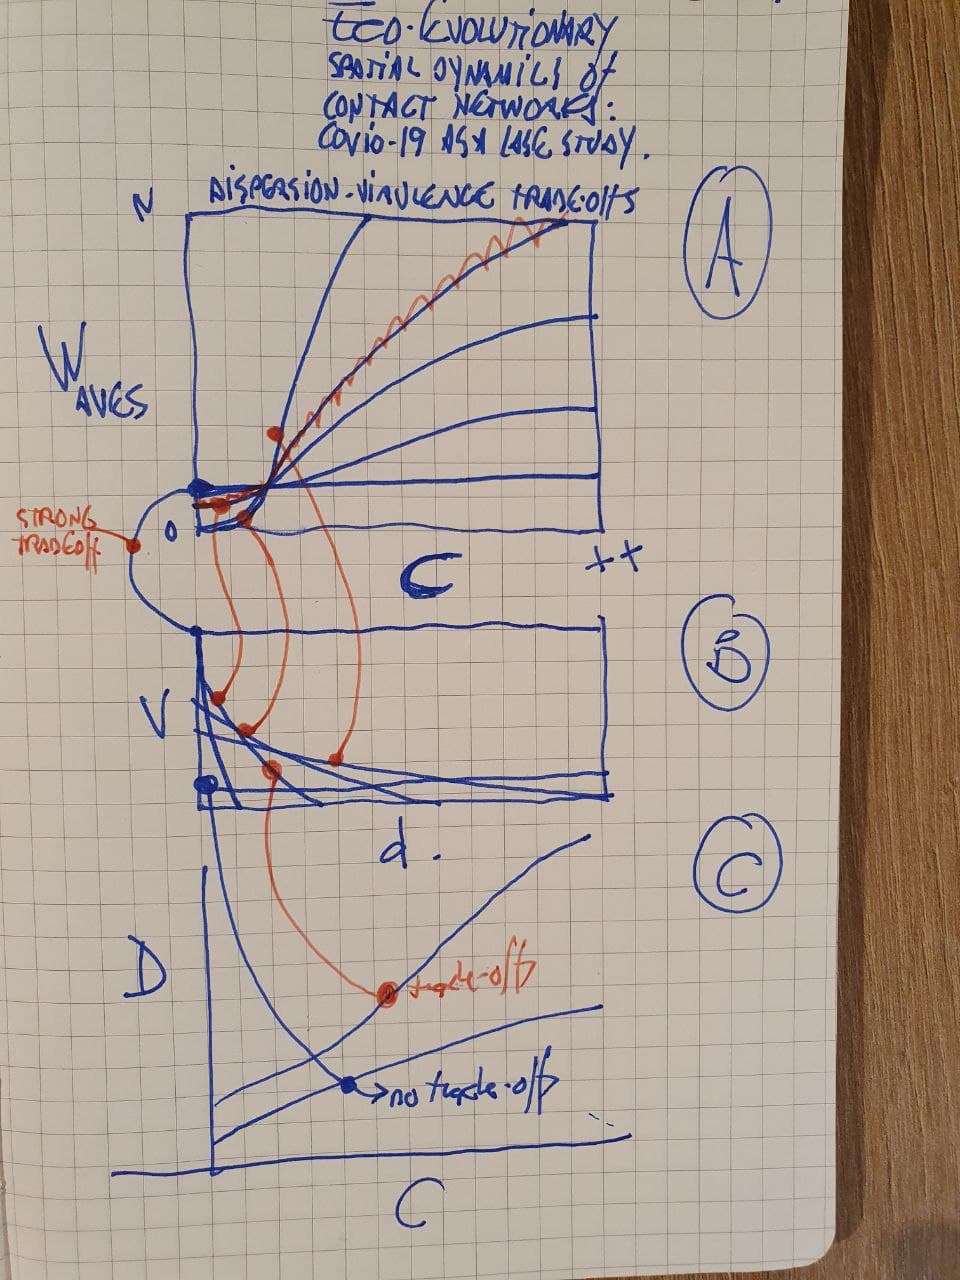
A. Infection waves as a function of connectivity under a virulence-dispersion trade-off. Infection waves are low at low connectivity. At high connectivity waves growth linearly?
B. Dispersal-virulence traded-off. Vertical lines show high virulence low dispersal while horizontal line virulence is independent of dispersal.
C. Death rate is low for age-class X with no trade-offs for the whole connectivity gradient, while it is high when trade-offs are incuded (red)