Robert01101101 / UnderstandingClimateChange

Data Visualization website developed for IAT 355. Using D3.js, different datasets related to the topic of climate change are visualized in a variety of ways.

Home Page:http://understandingclimatechange.rmichels.com/ccImpacts.html

Geek Repo:Geek Repo

Github PK Tool:Github PK Tool

Understanding Climate Change

Project Page

Website

About

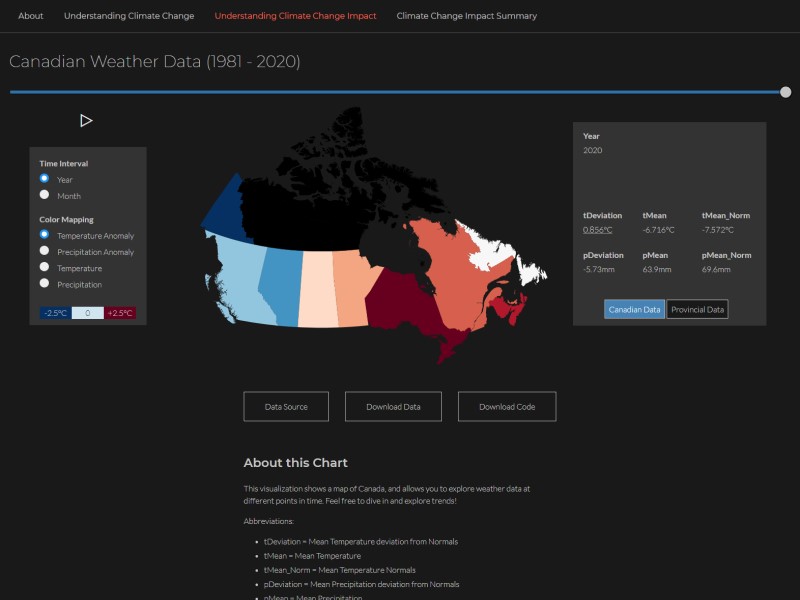
A website that uses D3.js to visually analyze climate change data. Data visualizations include line charts and stacked area charts of global climate change data, as well as a detailed choropleth map and other visualizations of Canadian weather data.

Screenshot

Contributors

  • Robert Michels
  • Radu Orlandea

References

  • Developed as part of the Introduction to Visual Analytics course IAT 355, at Simon Fraser University.

About

Data Visualization website developed for IAT 355. Using D3.js, different datasets related to the topic of climate change are visualized in a variety of ways.

http://understandingclimatechange.rmichels.com/ccImpacts.html

License:GNU General Public License v3.0


Languages

Language:JavaScript 62.5%Language:HTML 31.2%Language:CSS 6.4%