-
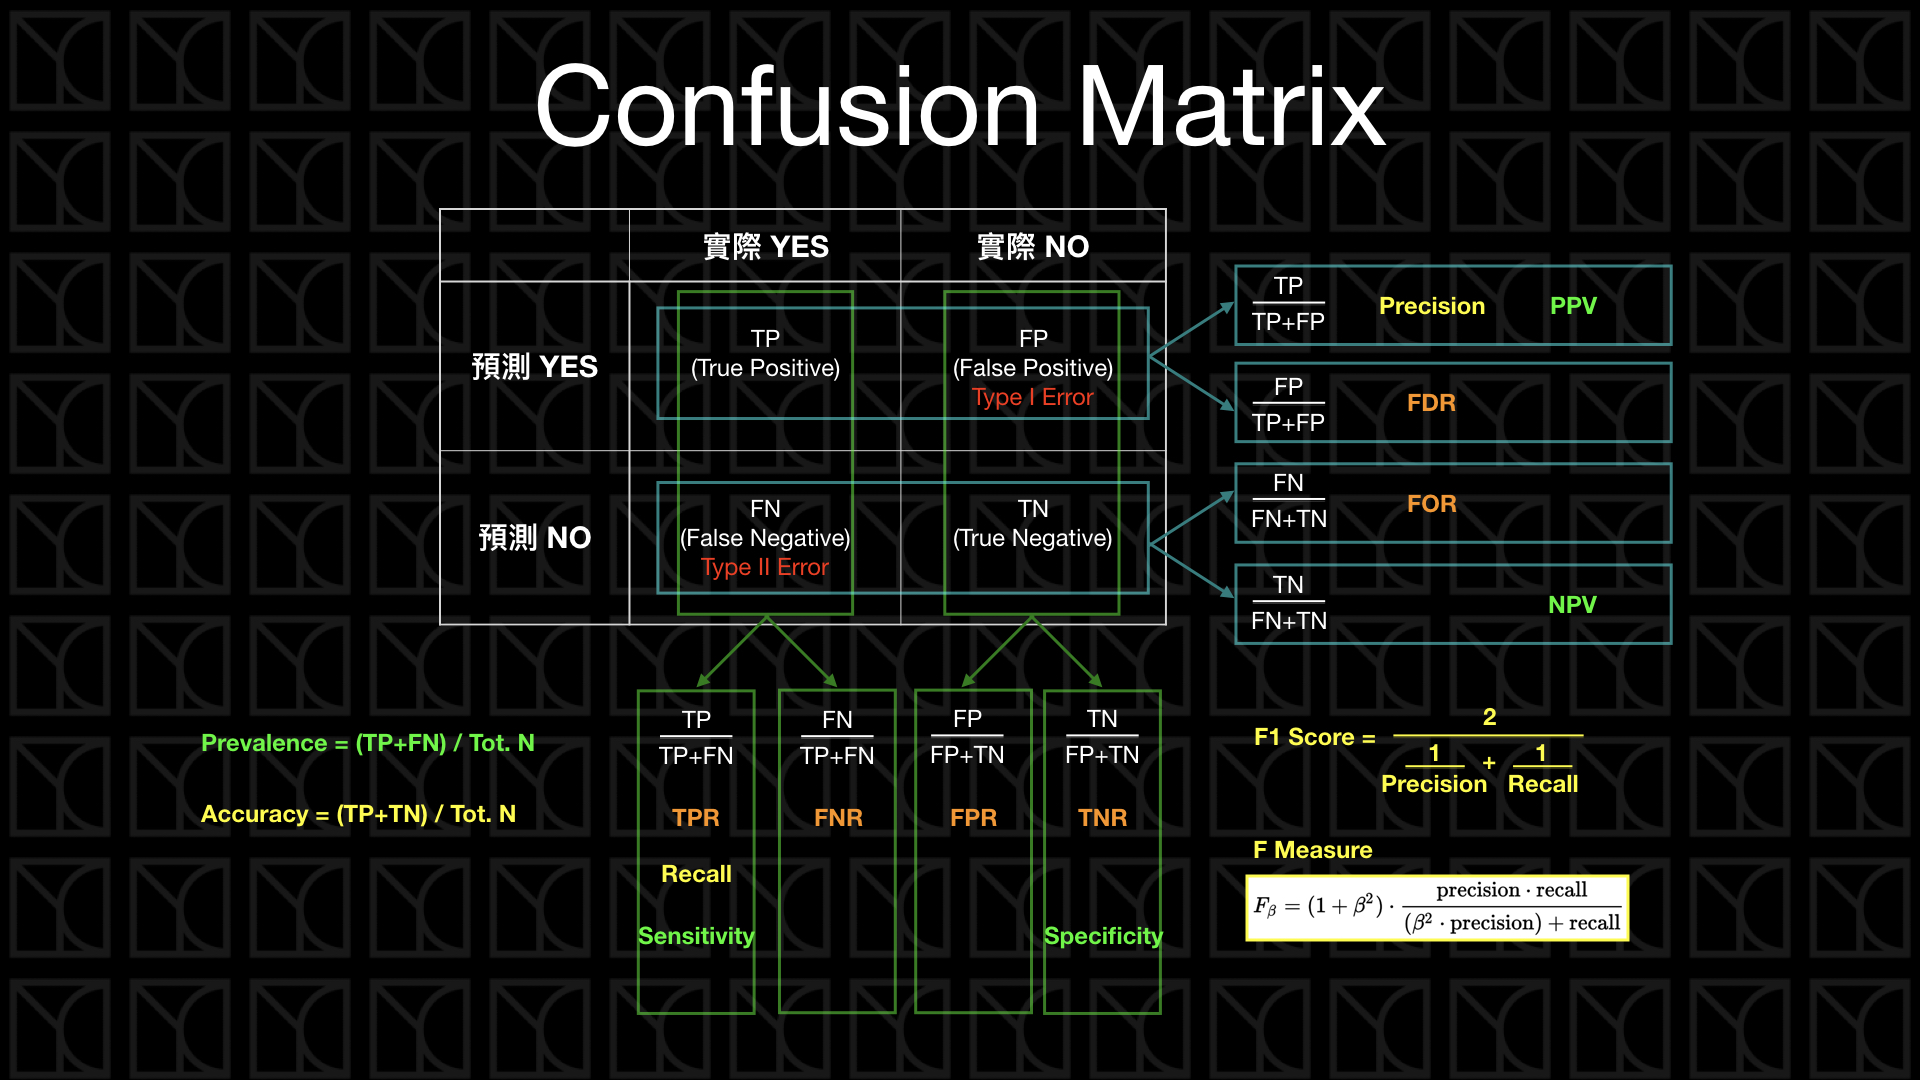
True Positive (TP): 預測為Positive,實際也為Positive
-
True Negative (TN): 預測為Negative,實際也為Negative
-
False Positive (FP): 預測為Positive,實際為Negative
-
False Negative (FN): 預測為Negative,實際為Positive
-
Accurancy is the proportion of true results (both true positive and true negative) among the total number of cases examined.
Accurancy = (TP + TN) / (TP + TN + FP + FN) -
Precision 是在預測正向的情形下,實際的「精準度」是多少
Precision = TP / (TP + FP) -
Recall是看在實際情形為正向的狀況下,預測「能召回多少」實際正向的答案
Recall, Sensitivity = TP / (TP + FN) -
Prevision和recall都不考慮True Negative,因為通常True Negative會是答對的Null Hypothesis
-
F1 score是precision和recall的調和平均數
F1 = 2 * (Precision * Recall) / (Precision + Recall) -
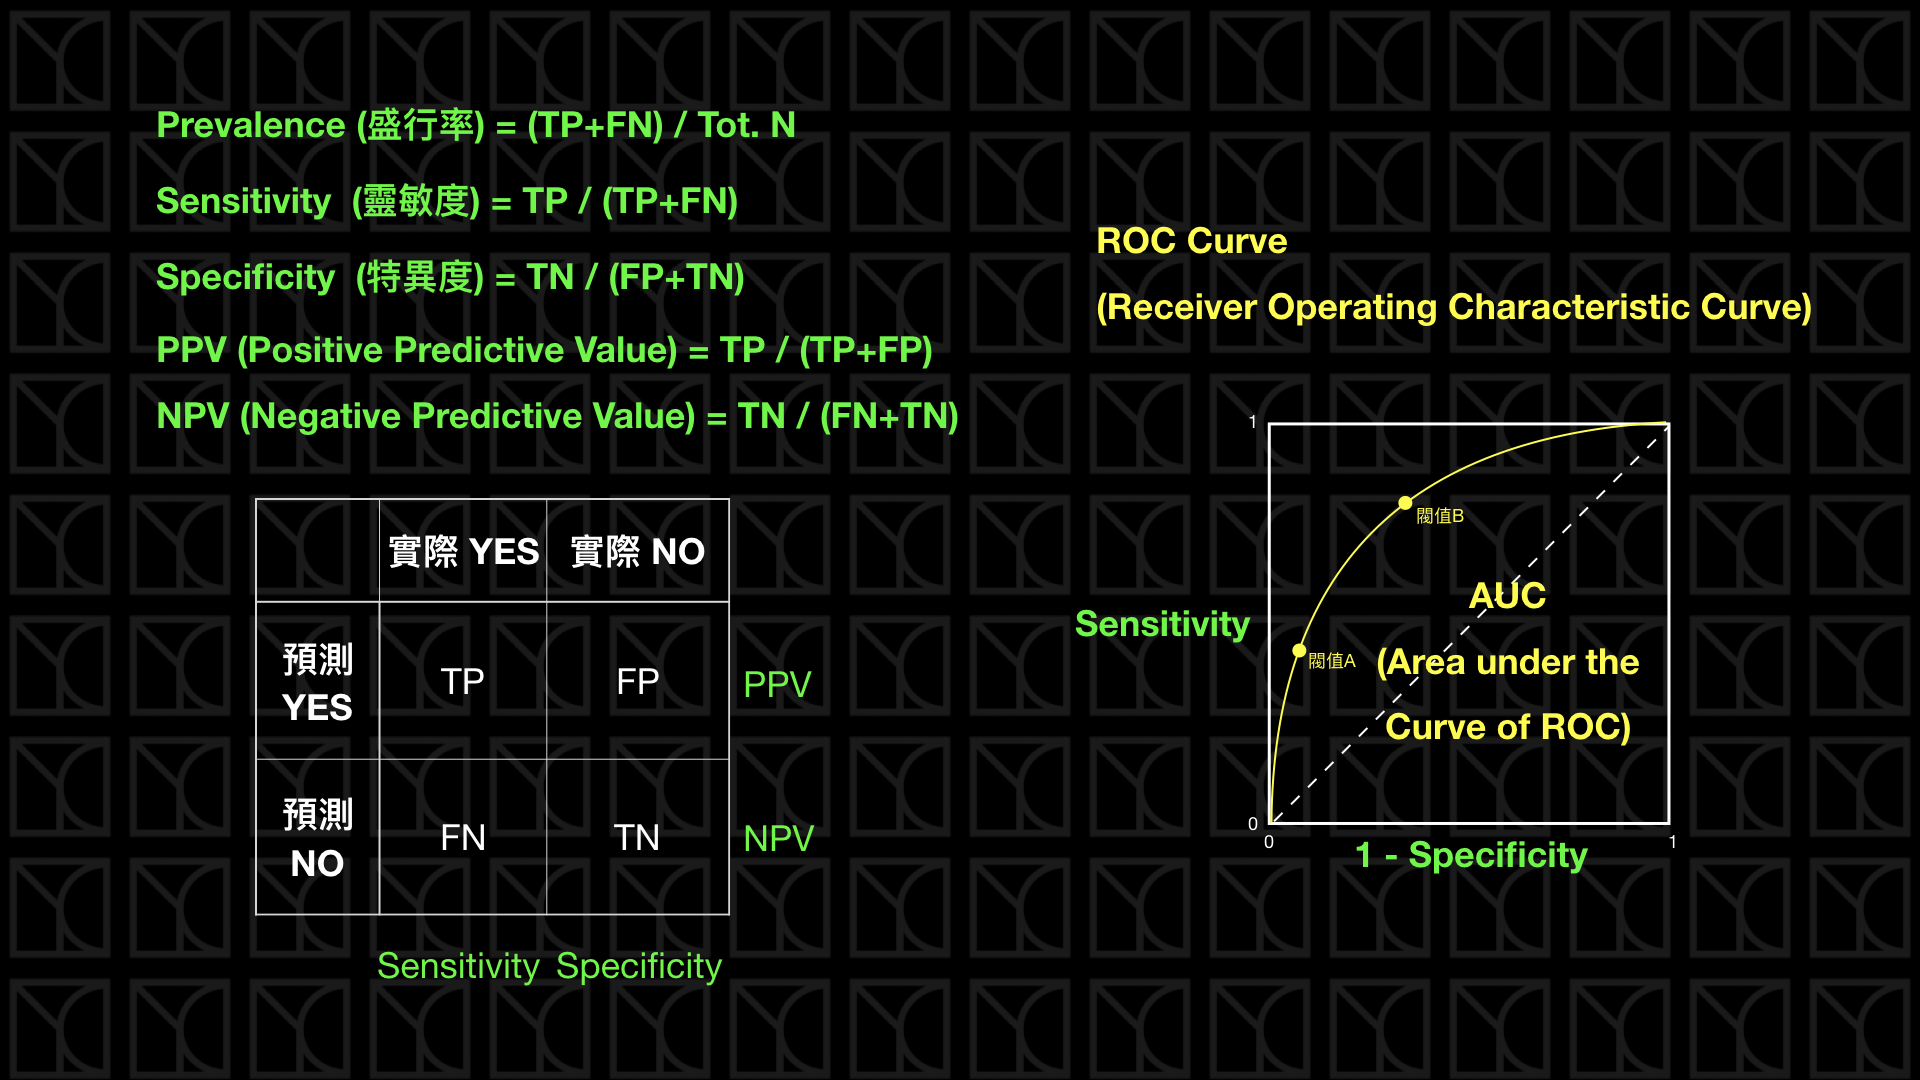
Sensitivity也就是recall,代表的是預測方法是否夠靈敏,可以將真正的positive結果預測出來
-
Specificity代表實際為negative的橘果多少被檢驗正確的
Specificity = TN / (TN + FP) -
Sensitivity和Specificity的值都是越高越好
-
Sensitivity和Specificity的分布情況可以畫成ROC Curve,而ROC Curve底下的面積稱為AUC,AUC越大越好。
- 圖片及文字參考自YC Note
- Log Likelihood是用來評估模型的好壞,值越大越
- Null model likelihood提供了一個基準,用於評估其他更複雜模型的擬合效果,如果模型的Log Likelihood比Null model likelihood還要低,那麼這個模型就是不好的。
- p-value越小越好,p < 0.05 reject null hypothesis
pnull <- sum(data$reference == "bad") / dim(data)[(1)]

loglikelihood_null <- sum(ifelse(data$reference == "bad", 1, 0)) * log(pnull) + sum(ifelse(data$reference == "bad", 0, 1)) * log(1 - pnull)
-
Deviance是Log Likelihood的一個變形,用來評估模型的擬合效果,值越小越好
deviance <- -2 * (loglikelihood - Null model likelihood )
-
Pseudo R2是用來評估模型的好壞,值介於0和1之間,越接近1代表模型越好
pseudoR2 <- 1 - deviance(model) / deviance(null model)
- Upload your code 'hw2.R' to GitHub and Gradescope.
- You should write a program with a function named 'calculate'.
calculate <- function(target, badthre, input, output) {
    .
    .
    .
}calculate("bad"|"good", threshold, "meth1 meth2 ... methx", "result.csv")- Read in multiple files
- Positive case defined by “target” parameter
- The threshold for determining a bad loan is defined by “badthre” parameter
- hw2_ref.R is for reference only
- The last column, pred.score, is the predicted probability of a "bad loan".
| persons | reference | pred.score |
|---|---|---|
| person1 | bad | 0.807018548483029 |
| person2 | bad | 0.740809247596189 |
| person3 | bad | 0.0944965328089893 |
| person4 | good | 0.148418645840138 |
- Find out which method performs the best regarding the metric.
- pseudo R2 = 1 - deviance(model)/deviance(null model) for S=0 where the null model
- the obvious guess: always return the proportion of "bad" loans no matter the input
| method | sensitivity | specificity | F1 | logLikelihood | pseudoR2 |
|---|---|---|---|---|---|
| method1 | 0.91 | 0.96 | 0.85 | -132 | 0.79 |
| method2 | 0.99 | 0.98 | 0.86 | -112 | 0.70 |
| best | method2 | method2 | method2 | method2 | method1 |
calculate("bad", 0.5, "examples/method1.csv examples/method2.csv", "examples/output1.csv")
calculate("bad", 0.4, "examples/method1.csv examples/method3.csv examples/method5.csv", "examples/output2.csv")
calculate("good", 0.6, "examples/method2.csv examples/method4.csv examples/method6.csv", "examples/output3.csv")- YC Note March 26, 2024.
- ChatGPT, "what are log likelihood, deviance, and pseudo R2 in R?" March 26, 2024.