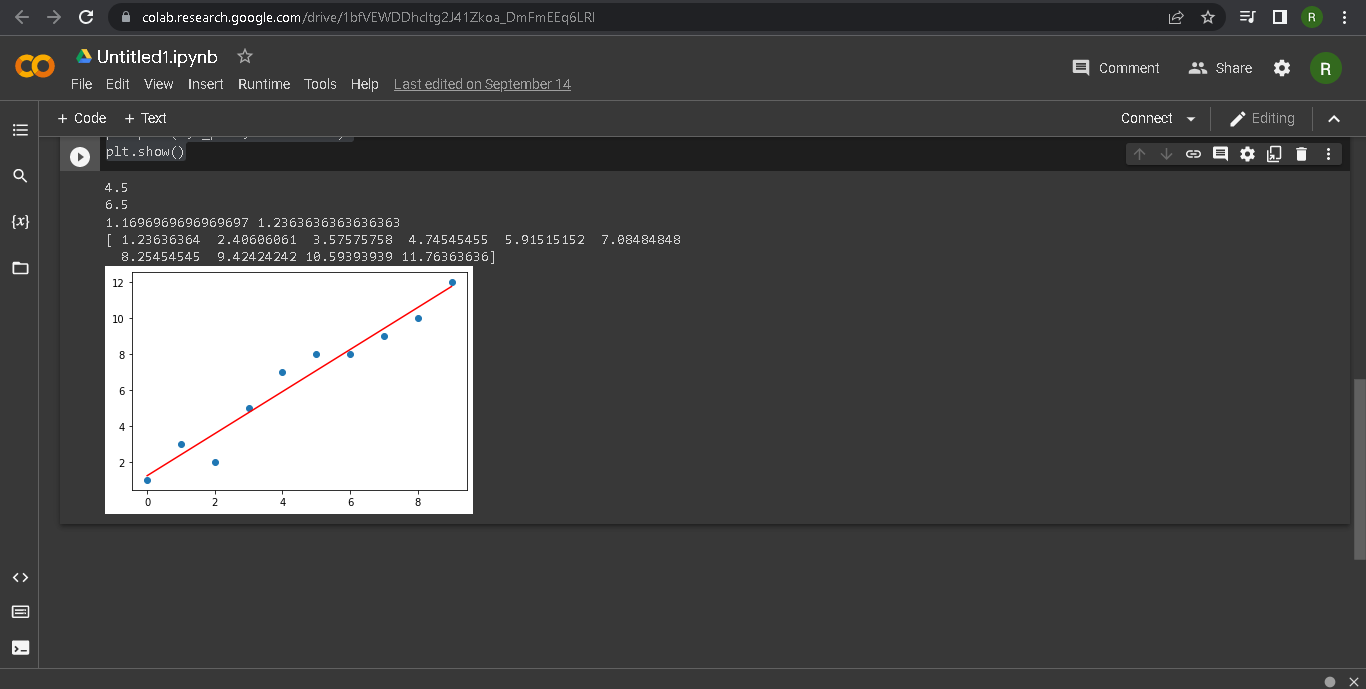
To implement univariate Linear Regression to fit a straight line using least squares.
- Hardware – PCs
- Anaconda – Python 3.7 Installation / Jupyter notebook
- Get the independent variable X and dependent variable Y.
- Calculate the mean of the X -values and the mean of the Y -values.
- Find the slope m of the line of best fit using the formula.
/*
Program to implement univariate Linear Regression to fit a straight line using least squares.
Developed by: Rishabendran R
RegisterNumber:  212219040121
*/
import numpy as np
import matplotlib.pyplot as plt

#assigning input

X = np.array([0,1,2,3,4,5,6,7,8,9])
Y = np.array([1,3,2,5,7,8,8,9,10,12])

#mean values input

X_mean = np.mean(X)
print(X_mean)
Y_mean = np.mean(Y)
print(Y_mean)

num = 0
denum = 0

for i in range(len(X)):
  num += (X[i]-X_mean)*(Y[i]-Y_mean)
  denum += (X[i]-X_mean)**2

#find m
m = num/denum

#find b
b = Y_mean - (m * X_mean)
print(m,b)

#find Y_pred
Y_pred = m*X+b
print(Y_pred)

#plot graph
plt.scatter(X,Y)
plt.plot(X,Y_pred,color="red")
plt.show()
Thus the univariate Linear Regression was implemented to fit a straight line using least squares using python programming.


