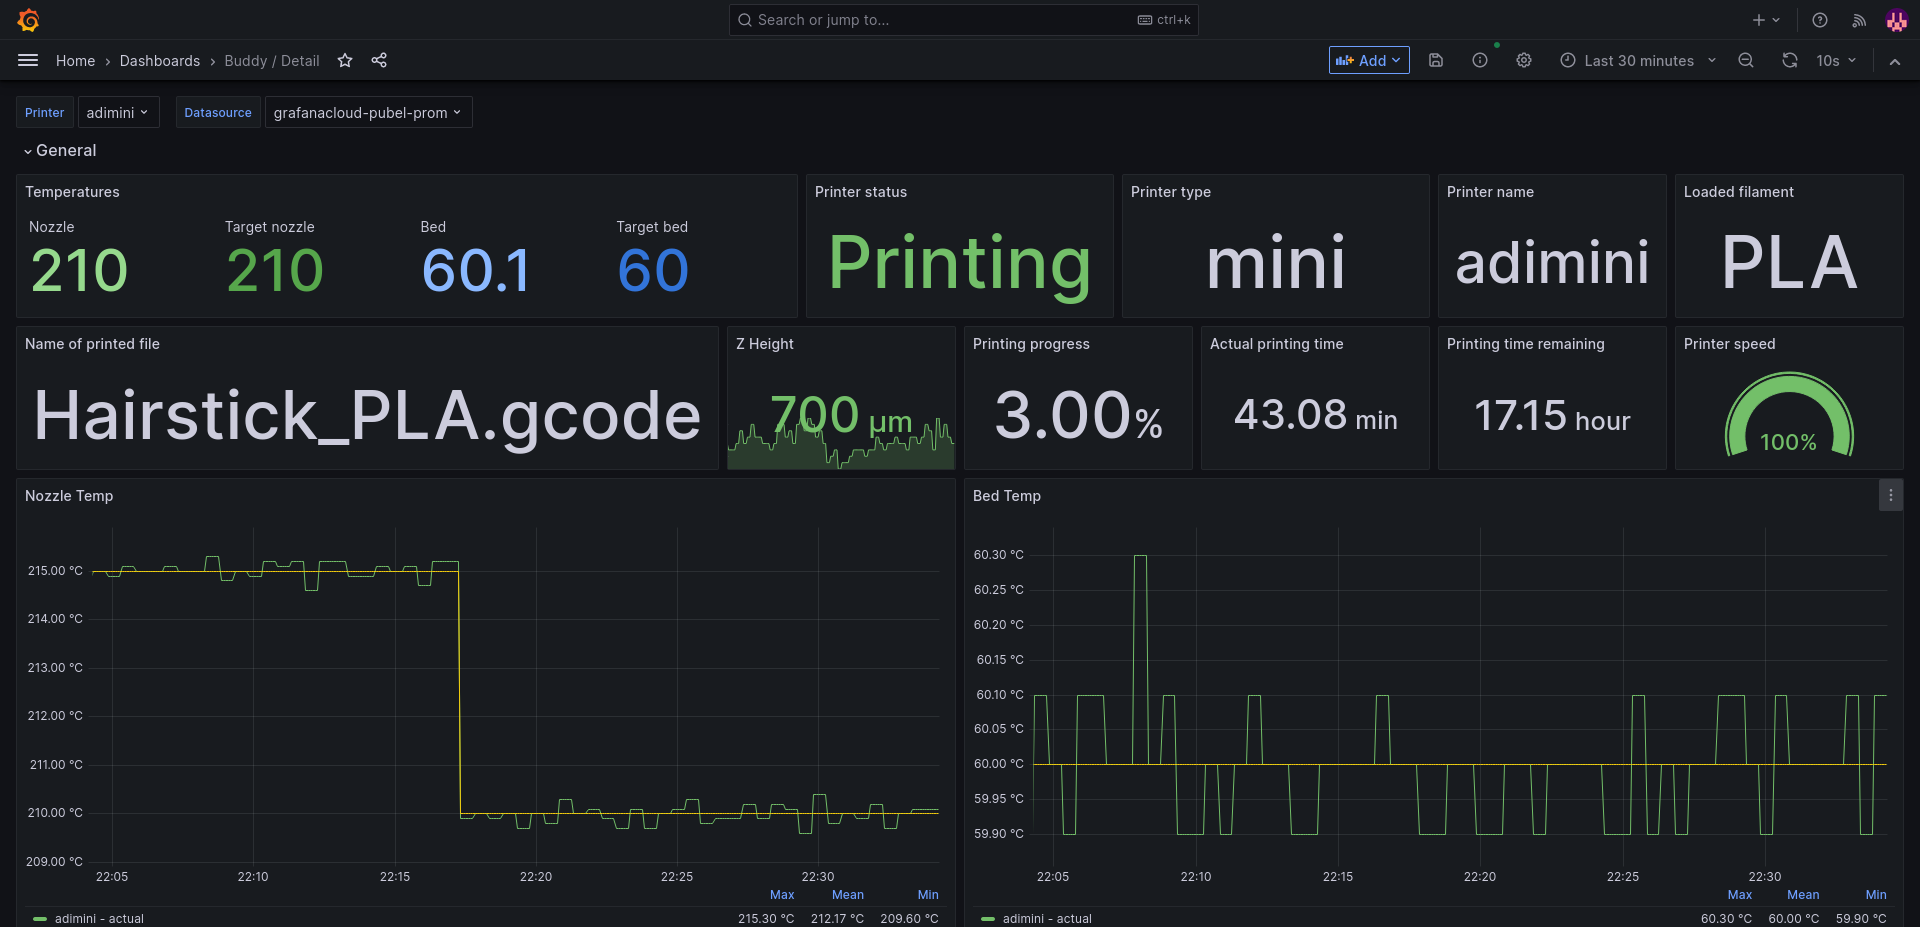
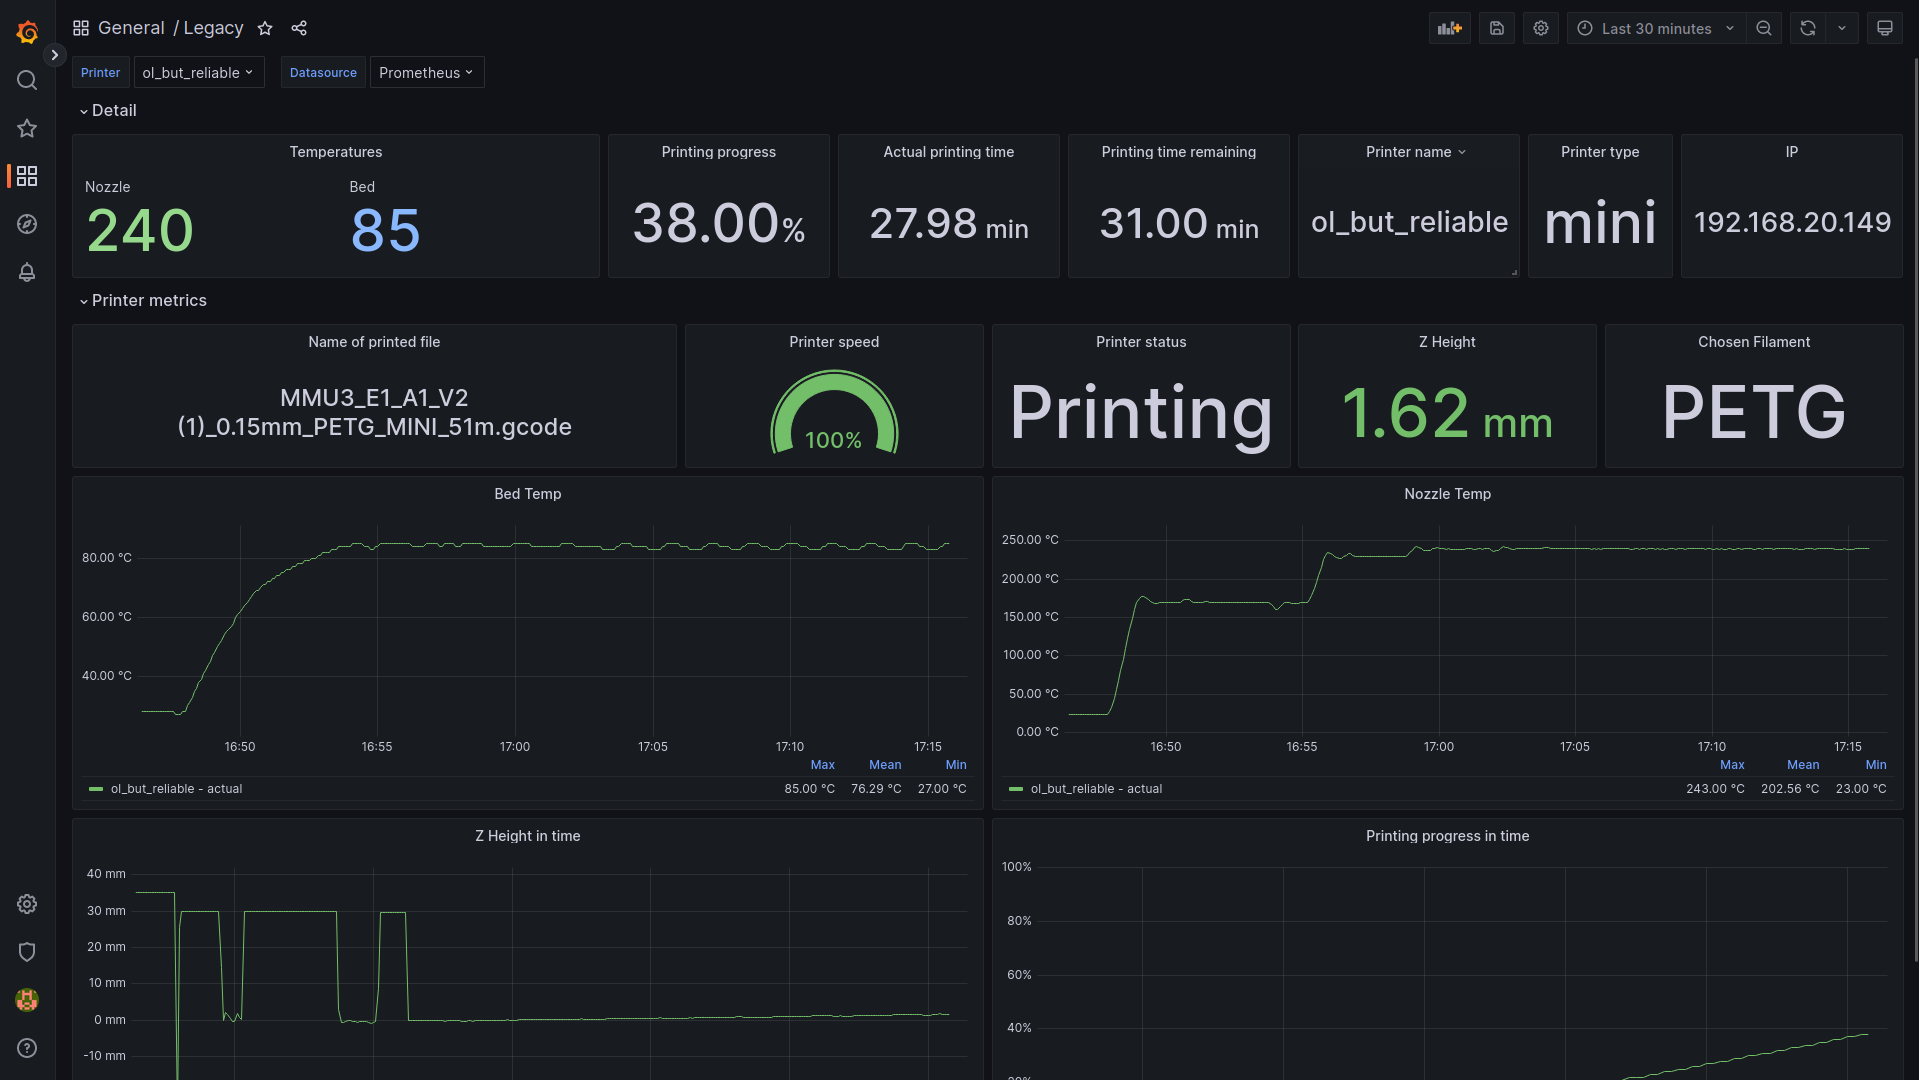
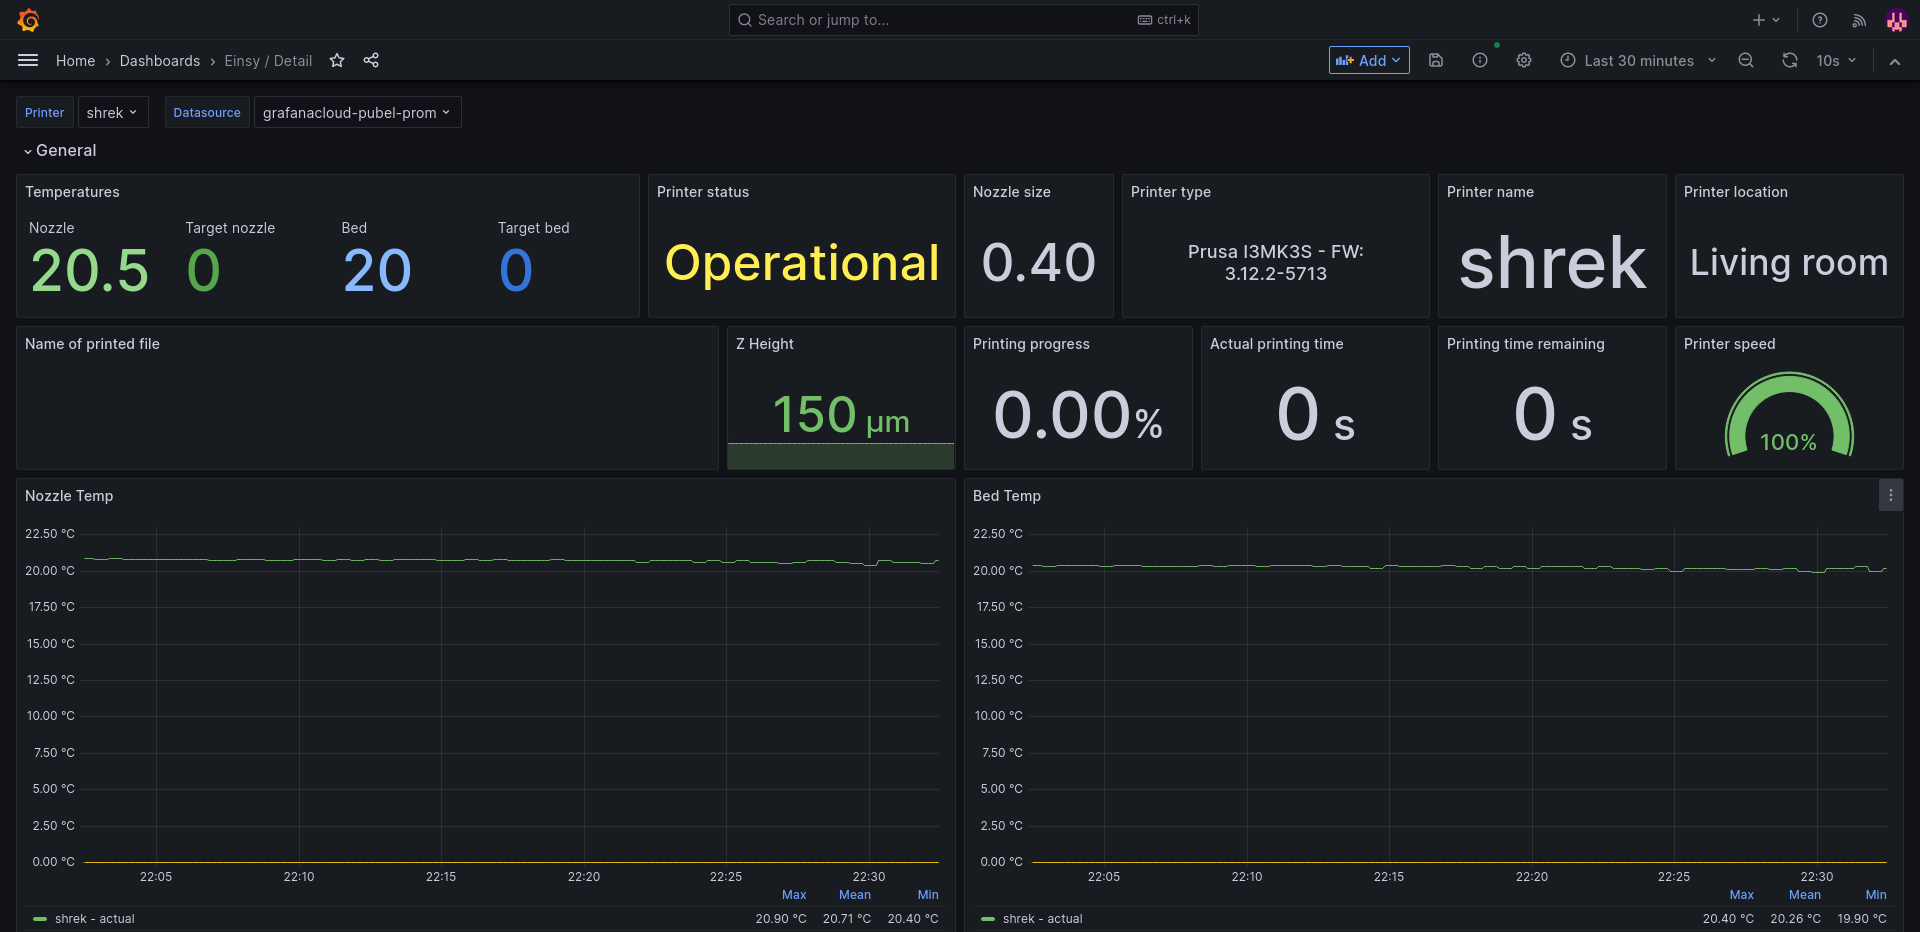
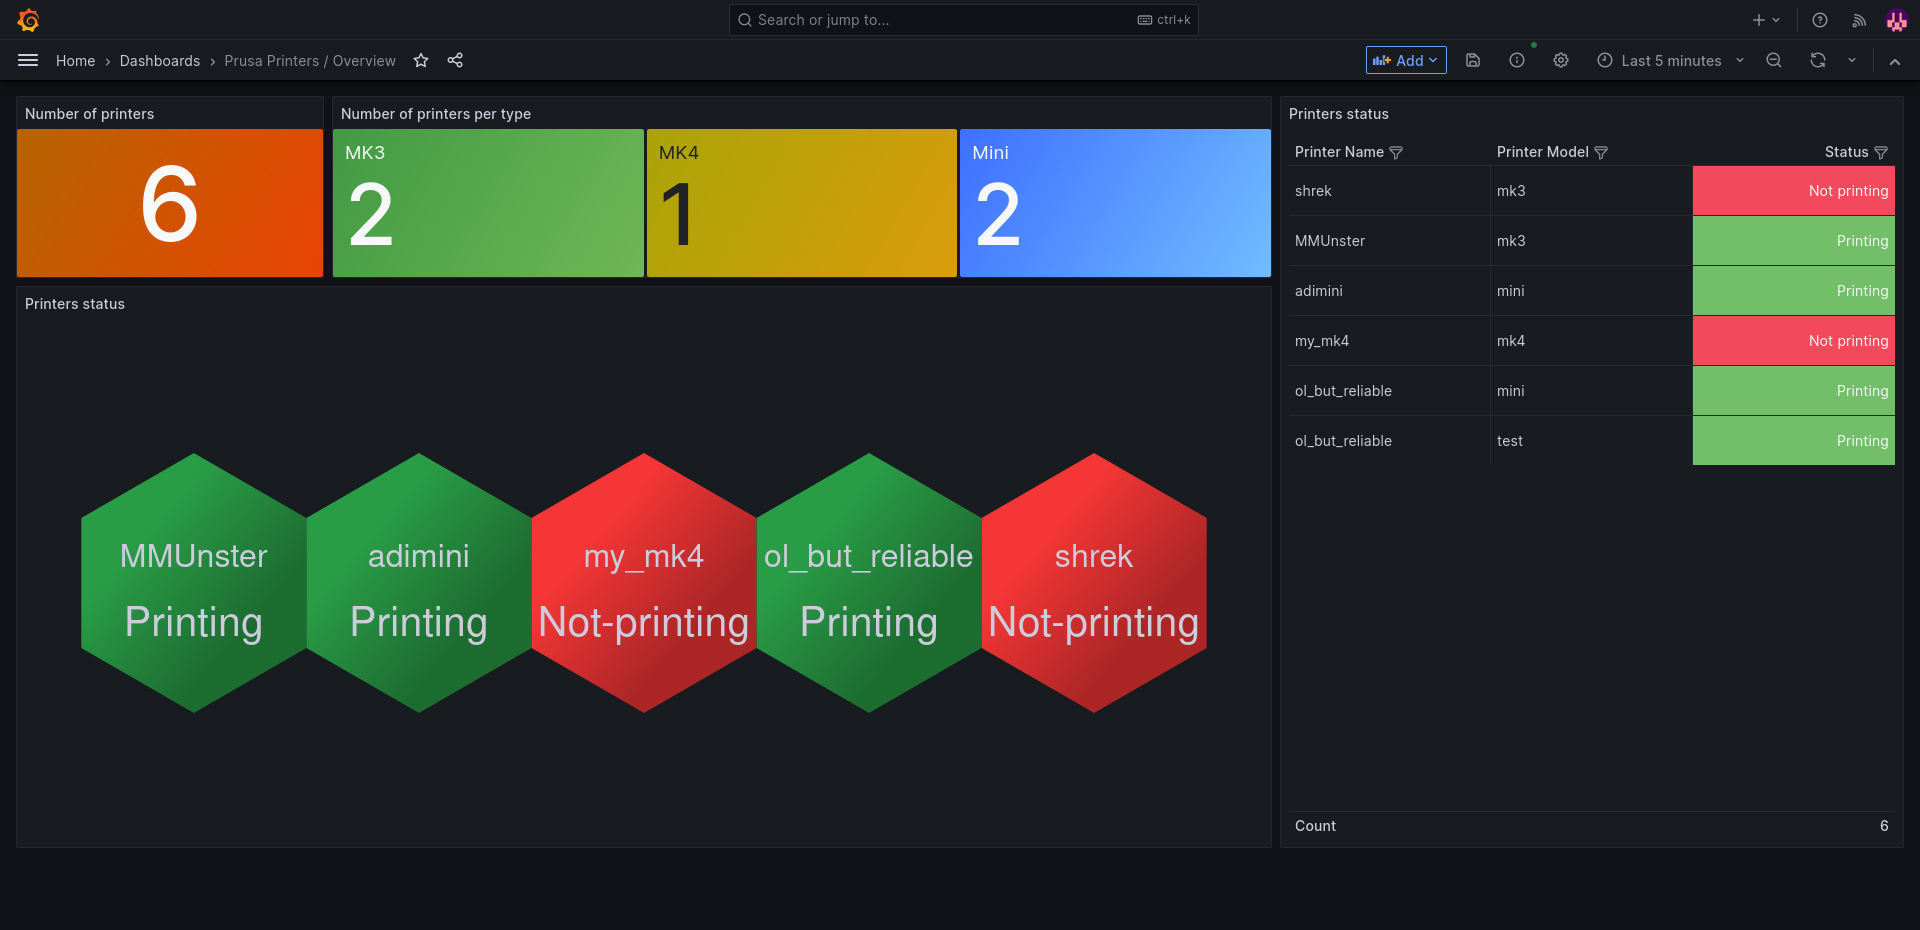
This is an implementation of Prometheus Exporter for Prusa printers running boards named Buddy or Einsy (with Prusa Link installed) like Prusa MK4, XL, Mini or MK3S. Multi-target is supported so you can check any number of printers as long it has accessible Prusa Link API (Even the old Prusa Connect Local).
However with Einsy boards - that in MK3, you need to use newest version of Prusa Link which is 0.7.0rc3 because there are much more metrics to scrape than in older version. You can find it in Prusa Link repository.
Exporter runs at port 10009, but you can choose different port in buddy.yaml that is used for configuration. Metrics are accessible at /metrics endpoint.
This list contains what would be implemented in the future.
- Scrape of metrics from Prusa Link
- Use of Grafana Cloud
- CI pipeline with Docker Hub publish
- Local instance of Grafana / Prometheus / Loki
- Raspberry Pi Image
- Odroid C4 Image
- Helm chart for K8s
- Camera image logging
- Implementation with exporter-toolkit
- Support for connection to Einsy with username and password
- Show printed gcode in dashboard
I've created docker-compose.yaml file, that can be used for deploy of exporter. You would need Docker and docker-compose plugin installed. Right now it is possible to use docker compose up only with Linux because I do not build image for Linux.
In config folder are configuration files for exporter itself, Prometheus and Promtail. You need change few thing here and there to get it up and running. Of course you can change everything you want. Every api key for Grafana Cloud cloud be found in grafana.com -> My Account -> Grafana Cloud instance -> Send Metrics / Send Logs.
However I prepared also config for on premise Prometheus and Loki if you do not want to use Cloud solution and you want to have your data somewhere local. You can find these configs in on_premise subfolder.
Exporter loads buddy.yaml from environment variable called BUDDY_EXPORTER_CONFIG. If you want to put this file in folder, where exporter is located then just set it to buddy.yaml. Exporter has implemented config reloader that runs by default every 300 seconds (5 minutes).
In config file you would find two sections - exporter and printers. First one is used for configuration of exporter itself.
exporter:
  metrics_port: 10009 # exporter port
  scrape_timeout: 1 # scrape timeout of Prusa Link
  reload_inteval: 300 # interval in seconds for config reloader
  log_level: info
metrics_port: you can set whatever you want. It is the port where Prometheus would scrape metrics endpoint. Required
scrape_timeout: Value in seconds that implies timeout of scraping Prusa Link devices. Not necessary needed for Einsy but needed for Buddy becuase printer sometimes do not return values. Required
reload_inteval: Because feature of config reloading is implemeneted, you need to specify interval of reloading. Required
log_level: log level of logger, default is info. Not required
In code block bellow you can see template for buddy.yaml config file. Value of type is not that important, you can set anything you want. However this value would be written to labels in metrics, so be aware of that.
For now there is no way how to log in with username and password to for Einsy (Raspberry Pi Zero) boards. You need to generate apikey in Prusa Link settings. This would be resolved in future release.
printers:
  buddy:
  - address: <address_of_printer>
    name: <your_printer_name>
    type: mini
    apikey: <your_printer_apikey>
  - address: <address_of_printer>
    username: maker # I'm not aware that there is posibility to change user name in XL or MK4 printers - default is maker
    pass: <password>
    name: <your_printer_name>
    type: <mini/xl/mk4>
  einsy:
  - address: <address_of_printer>
    apiKey: <your_printer_apikey>
    name: <your_printer_name>
    type: <mk2.5 or mk3>
  legacy:
  - address: <address_of_printer>
    name: <your_printer_name>
    type: mini
In prometheus.yml you need to change remote write block. This block is responsible for writing data to Grafana Cloud instance. You can get all values in config of your Grafana instance. You can get more information in Grafana Docs.
| key | value |
|---|---|
| url | this is where your instance is running |
| username | name that is used for login |
| password | unique key used for login |
remote_write:
- url: https://prometheus-prod-01-eu-west-0.grafana.net/api/prom/push
  basic_auth:
    username: "userName"
    password: "apiKey"
In promtail.yml you need to change clients block. Thanks to this block promtail would sent logs to Grafana Cloud Loki instance instead of local Loki. More details of log ingestion in Grafana docs.
| key | value |
|---|---|
| url | this is string that you can generate in Grafana Cloud |
clients:
  - url: https://<User Name>:<Your Grafana.com API Key>@logs-prod-eu-west-0.grafana.net/loki/api/v1/push
Starting of exporter is simple. Just change directory to where docker-compose.yaml and configs are and run following command.
docker compose up
🎉 if everthing went alright your instance is up and running and you can find metrics at /metrics endpoint.
I also prepared one dashboard per board that you can find in the docs/examples/grafana folder.


