Zabbix Template for Cloudflared Tunnel Metrics
- Install
- Operation
- Items
- Template Metrics
- Triggers
- Dashboards
- Low Layer Discovery
- Graphs
- Groups
- User Parameters
- License
- PRE-REQ: Cloudflared tunnel service has been installed and is operating, Cloudflared is in $PATH.
- Cloudflared metrics is operational (default), HOST, PATH, and PORT can be changed with Zabbix macros.
- Link Template to host.
- Set the host {$CLOUDFLARED_VERSION_EXPECT} macro to the version expected (change in template for all, or per host).
- Add the following line to Cloudflared's config.yaml
- Informational triggers start disabled. Enable if you wish to have a problem on mismatched CF versions.
metrics: localhost:40705
- The above parameter instructions Cloudflared service metrics on port 40705. By default Cloudflared will otherwise randomize the port. It is not necessary to use port 40705 and the port. The port must match that found in Zabbix Macro {$CLOUDFLARED_METRICS_PORT}
- Restart both the Cloudflared Tunnel Service and Zabbix Agent Service.
This Zabbix Template works by using the web.page.get method to allow a Zabbix Agent (Passive/Active) to retrieve the localhost metrics from a systems/ Cloudflared tunnel service.
- This is intended for Cloudflared origin-servers.
- By default, the Cloudflared service will serve tunnel metrics at the following URL:
- http://127.0.0.1:40705/metrics
This template ingests that metrics page, users regex to cut it to a Prometheus Metrics page and then parses it into Zabbix items via the Prometheus pre-processor.
| Item | Key | Definition |
|---|---|---|
| cf.metrics | web.page.get[{$CLOUDFLARED_METRICS_HOST},{$CLOUDFLARED_METRICS_PATH},{$CLOUDFLARED_METRICS_PORT}] | Master key for for metrics from cloudflared metrics service |
| cf.metrics: CF Active Streams | cf.cloudflared_tunnel_active_streams | Number of Active Atreams |
| cf.metrics: CF HA Connections | cf.cloudflared_tunnel_ha_connections | Number of HA Connections |
| cf.metrics: CF Tunnel 200 Responses | cf.cloudflared_tunnel_response_by_code_200 | Number of HTTP 200 Responses |
| cf.metrics: CF Tunnel 404 Responses | cf.cloudflared_tunnel_response_by_code_404 | Number of HTTP 404 Responses |
| cf.metrics: CF Tunnel Time Retries | cf.cloudflared_tunnel_timer_retries | Number of HTTP Timer Retries |
| cf.metrics: CF Tunnel Total Requests | cf.cloudflared_tunnel_total_requests | Number of total requests |
| cf.metrics: CF Tunnel Authentication Success | cf.cloudflared_tunnel_tunnel_authenticate_success | Number of Successful tunnel Authentications |
| CF Cloudflared Version | cf.version | Cloudflared Version running by $PATH |
The following macros are used in this template:
| Default Value | Definition | |
|---|---|---|
| {$CLOUDFLARED_METRICS_HOST} | 127.0.0.1 | CloduflareD Metrics Tunnel Host |
| {$CLOUDFLARED_METRICS_PATH} | metrics | CloduflareD Metrics Tunnel Path |
| {$CLOUDFLARED_METRICS_PORT} | 40705 | CloduflareD Metrics Tunnel Port |
| {$CLOUDFLARED_TRIGGER_HA_CONNECTIONS} | 4 | CloduflareD Metrics Trigger HA Connection WARN |
| {$CLOUDFLARED_TUNNEL_ID} | FUTURE DEVELOPMENT |
| Trigger | Definition |
|---|---|
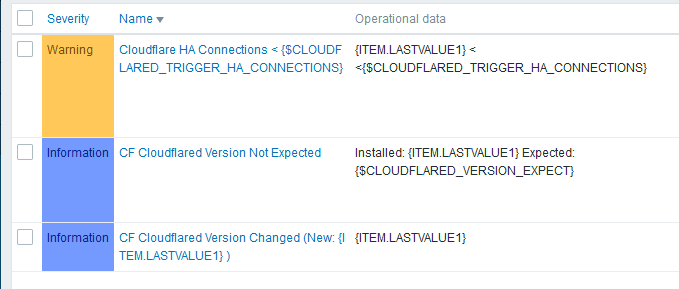
| Cloudflared HA Connections < {$CLOUDFLARED_TRIGGER_HA_CONNECTIONS} | WARN trigger when HA connections drop below 4 |
| CF Cloudflared Version Changed | INFO When Cloudflared version changes |
- Cloudflared Tunnel Metrics
This template does not use Zabbix LLD Discoveries
- CF Active Streams
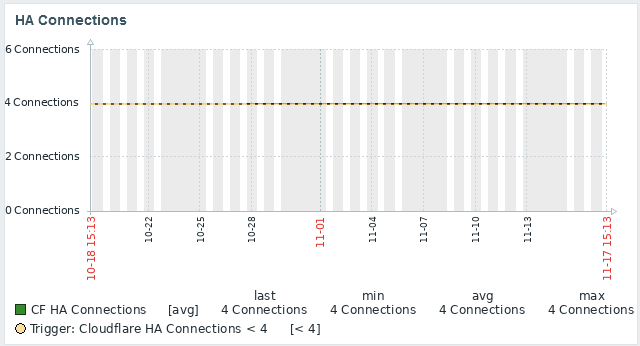
- CF HA Connections
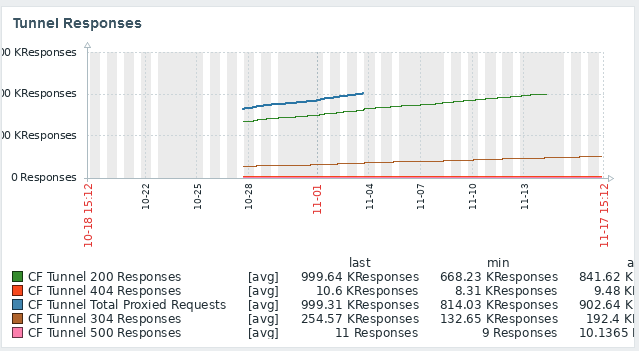
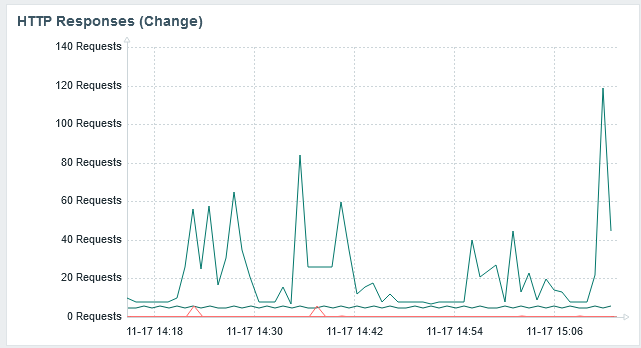
- CF HTTP Tunnel Responses (200, 404, Total)
- CF Authentication Successes
This template becomes the member of two groups
- Templates/Applications
- CloudflareTunnels
The file cloudflared-userparamters.conf contains the following UserParmters that need to be added to the zabbix_agent.conf or file added to the zabbix_agent.d directory (/etc/zabbix/zabbix_agent.d)
UserParameter=cf.version,cloudflared --version
The above parameter populates the CF Cloudflared Version item.
Note that the item will import as a "Zabbix Active Agent" item. This may need modified to to "Zabbix Agent" if you use Passive Agents instead of Active Agents.
Dashboard tunnel Responses (30 days)

Dashbaord HA Connections (30 days)

Custom Dashboard (Metrics Data Per Host) - Not in template

Graph HTTP Requests via Tunnel

Sample Trigger Alert Notification (HA Connections < 4)

- 10.19.21 - Updated the expected version trigger syntax (had typo). Added macro for version trigger, added macro default to current cloudflared version.
- 10.27.21 - Migrated all prometheus processes to regex; added some items, descriptions; updated graphs, triggers
- 11.17.21 - Added screenshots to repo; added yaml for 5.4
SELinux on CentOS will prevent the active-agent from accessing the metrics page. You must disable SELinux or allow for the bypass (for active agent to access localhost).
GNU 3


