Polynomial functions are among the simplest, most important, and most commonly used mathematical functions. These functions consist of one or more terms of variables with whole number exponents

A polynomial function is a function such as a quadratic, a cubic, a quartic, and so on, involving only non-negative integer powers of x. We can give a general definition of a polynomial, and define its degree for an example
f(x) = 4x³ — 3x² + 2this function called as cubic polynomial because polynomial of degree 3,as 3 is the highest power of x formula
f(x) = 4x²− 2x− 4This is called as a quadratic.which is a polynomial of degree 2, as 2 is the highest power of x. lets plot simple function using python
ex :
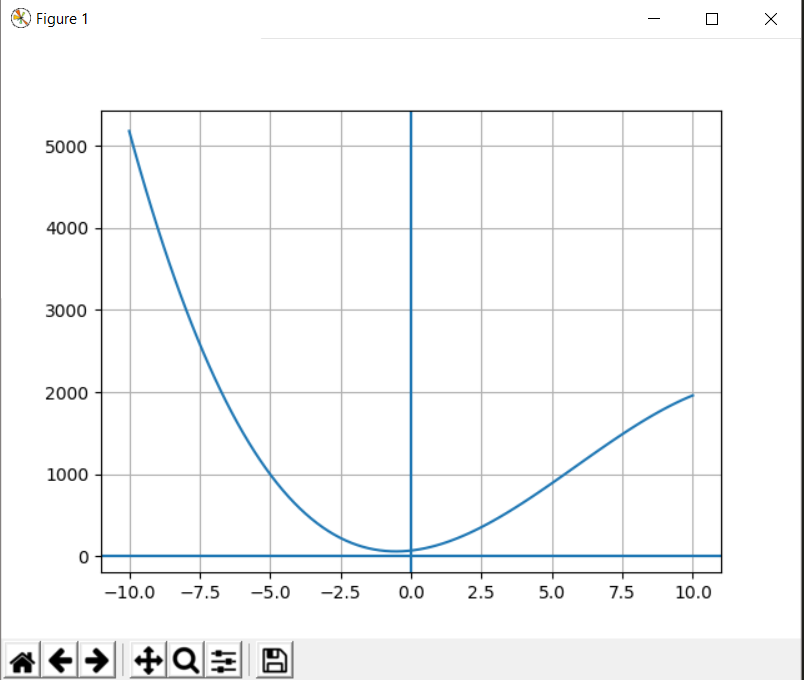
f(x) = x ² — 2x + 5● numy
● matplotlib

The graph shows for this function

Lets see another complex polynomial function
ex :
f(x) = x ³— 3x³ — 35x²+39x + 70
this how the graph shows for this function
This is how basic plotting polynomial using python lets see another artical for advance polynomial functions
This graph depicts the density of state with varying value of "a" from the Subject of Electronic Properties of Materials , of Mettullargy and Materials Engineering (MT303 - 26427)
Here we are plotting the density of state graph with varying value of "a" such as 2 A , 5 A , 10 A all in one Graph.
Here we plot the graph in Python with help of
● numy
● matplotlib
http://www.mathcentre.ac.uk/resources/uploaded/mc-ty-polynomial-2009-1.pdf