Earthquakes visualization
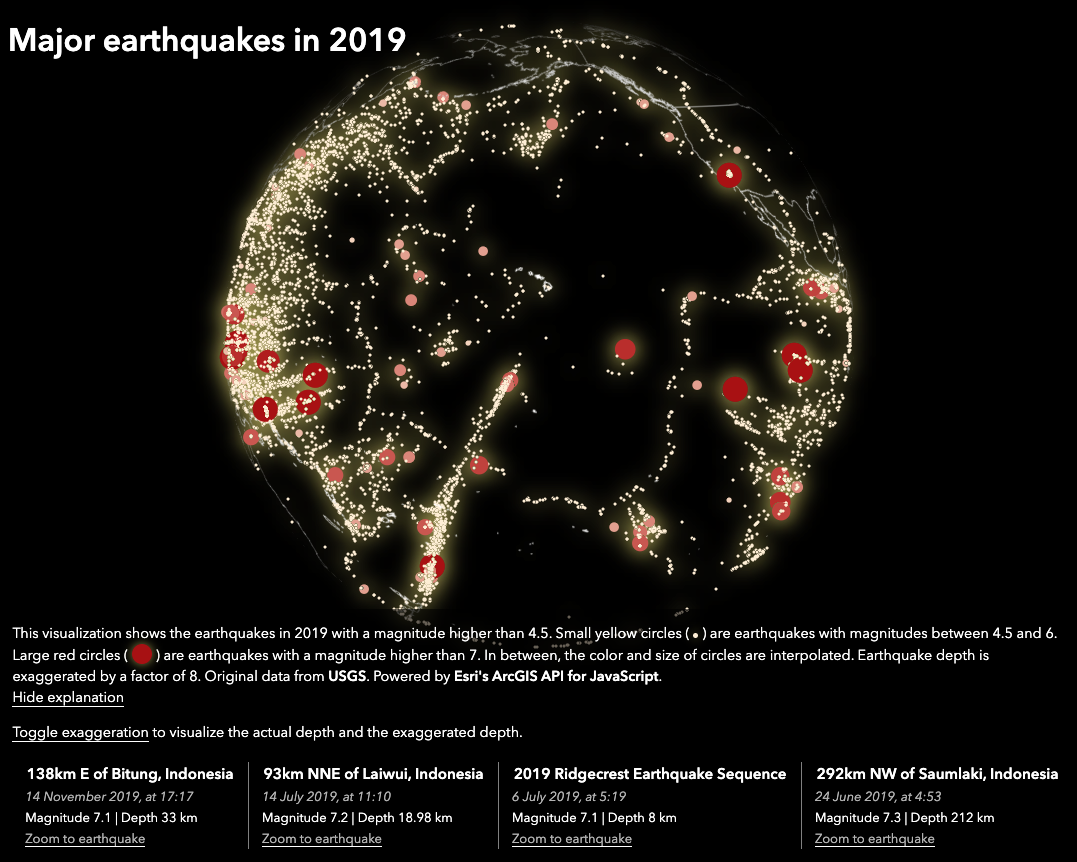
This application shows the earthquakes in 2019 with an exaggerated depth. The earthquake data used in this app comes from USGS. The app is created with Esri's ArcGIS API for JavaScript.
How to re-create this visualization with your own data
If you want to visualize your own data like this, follow the steps below:
- Fork this repository.
- Clone it locally on your machine:
git clone https://github.com/your_user_name/earthquakes-viz.git - Download data from USGS:
- Go to this site: https://earthquake.usgs.gov/earthquakes/search/
- Set the filters that you need (time, location, magnitude, etc.)
- Make sure that the download format is
csv.
- Rename the file to
earthquake_data.csvand replace the csv file in this folder. - Replace
2019in the title of the app and the description with your chosen period of time. Or replace it with anything else you want. - Commit your changes and push them on Github.
git add .
git commit -m "Change dataset"
git push origin master
- In the Settings tab of your repo, choose master as the branch where your website will be served from.
You should now have a live website running with this visualization with your own data.
License
This project is released under an MIT license.