This is heavily inspired by the following blog post.
- Start an ubuntu instance on your favorite cloud provider or locally
- Install prometheus (dirty way)
$ wget https://github.com/prometheus/prometheus/releases/download/v2.25.0/prometheus-2.25.0.linux-amd64.tar.gz
$ tar -xzf prometheus-2.25.0.linux-amd64.tar.gz
$ export PATH=$PATH:$PWD/prometheus-2.25.0.linux-amd64
$ prometheus -h
$ cat << EOF > prometheus.yml
global:
  scrape_interval:     15s # By default, scrape targets every 15 seconds.

  # Attach these labels to any time series or alerts when communicating with
  # external systems (federation, remote storage, Alertmanager).
  external_labels:
    monitor: 'codelab-monitor'

# A scrape configuration containing exactly one endpoint to scrape:
# Here it's Prometheus itself.
scrape_configs:
  # The job name is added as a label `job=<job_name>` to any timeseries scraped from this config.
  - job_name: 'prometheus'

    # Override the global default and scrape targets from this job every 5 seconds.
    scrape_interval: 5s

    static_configs:
      - targets: ['localhost:9090']
EOF- Install grafana
$ wget https://dl.grafana.com/oss/release/grafana_7.1.5_amd64.deb
$ sudo apt-get install -y adduser libfontconfig
$ sudo dpkg -i grafana_7.1.5_amd64.deb
$ sudo systemctl daemon-reload && sudo systemctl enable grafana-server && sudo systemctl start grafana-server
$ curl -v http://localhost:3000-
Add the prometheus source to grafana
- Click on the Grafana logo to open the sidebar.
- Click on “Data Sources” in the sidebar.
- Choose “Add New”.
- Select “Prometheus” as the data source.
- Set the Prometheus server URL (in our case: http://localhost:9090/)
- Click “Add” to test the connection and to save the new data source.
-
Generate and import the fake data in prometheus (see script and sample output)
$ sudo apt install python3-pip
$ sudo pip3 install numpy
$ python3 generate_openmetrics.py > ticket.metrics
$ promtool tsdb create-blocks-from openmetrics ticket.metrics data/- Start prometheus
$ prometheus --config.file=prometheus.yml --storage.tsdb.retention.time=60d- Check the data, open the prometheus metric browser in your favorite browser
http://<FQDN>:9090/graph, below few "interesting" promql queries
pcf_ticket_opened_total[4w:1d]
pcf_ticket_closed_total
increase(pcf_ticket_closed_total[4w])
onboarded_team
-
Import the dashboard in grafana
- open
dashboard.jsonin your favorite editor - login to grafana using
http://<FQDN>:3000with admin/admin - In the sidebar, click on "Create"
- Choose "Import"
- Paste the content of
dashboard.jsoninto text area - Click load button
- open
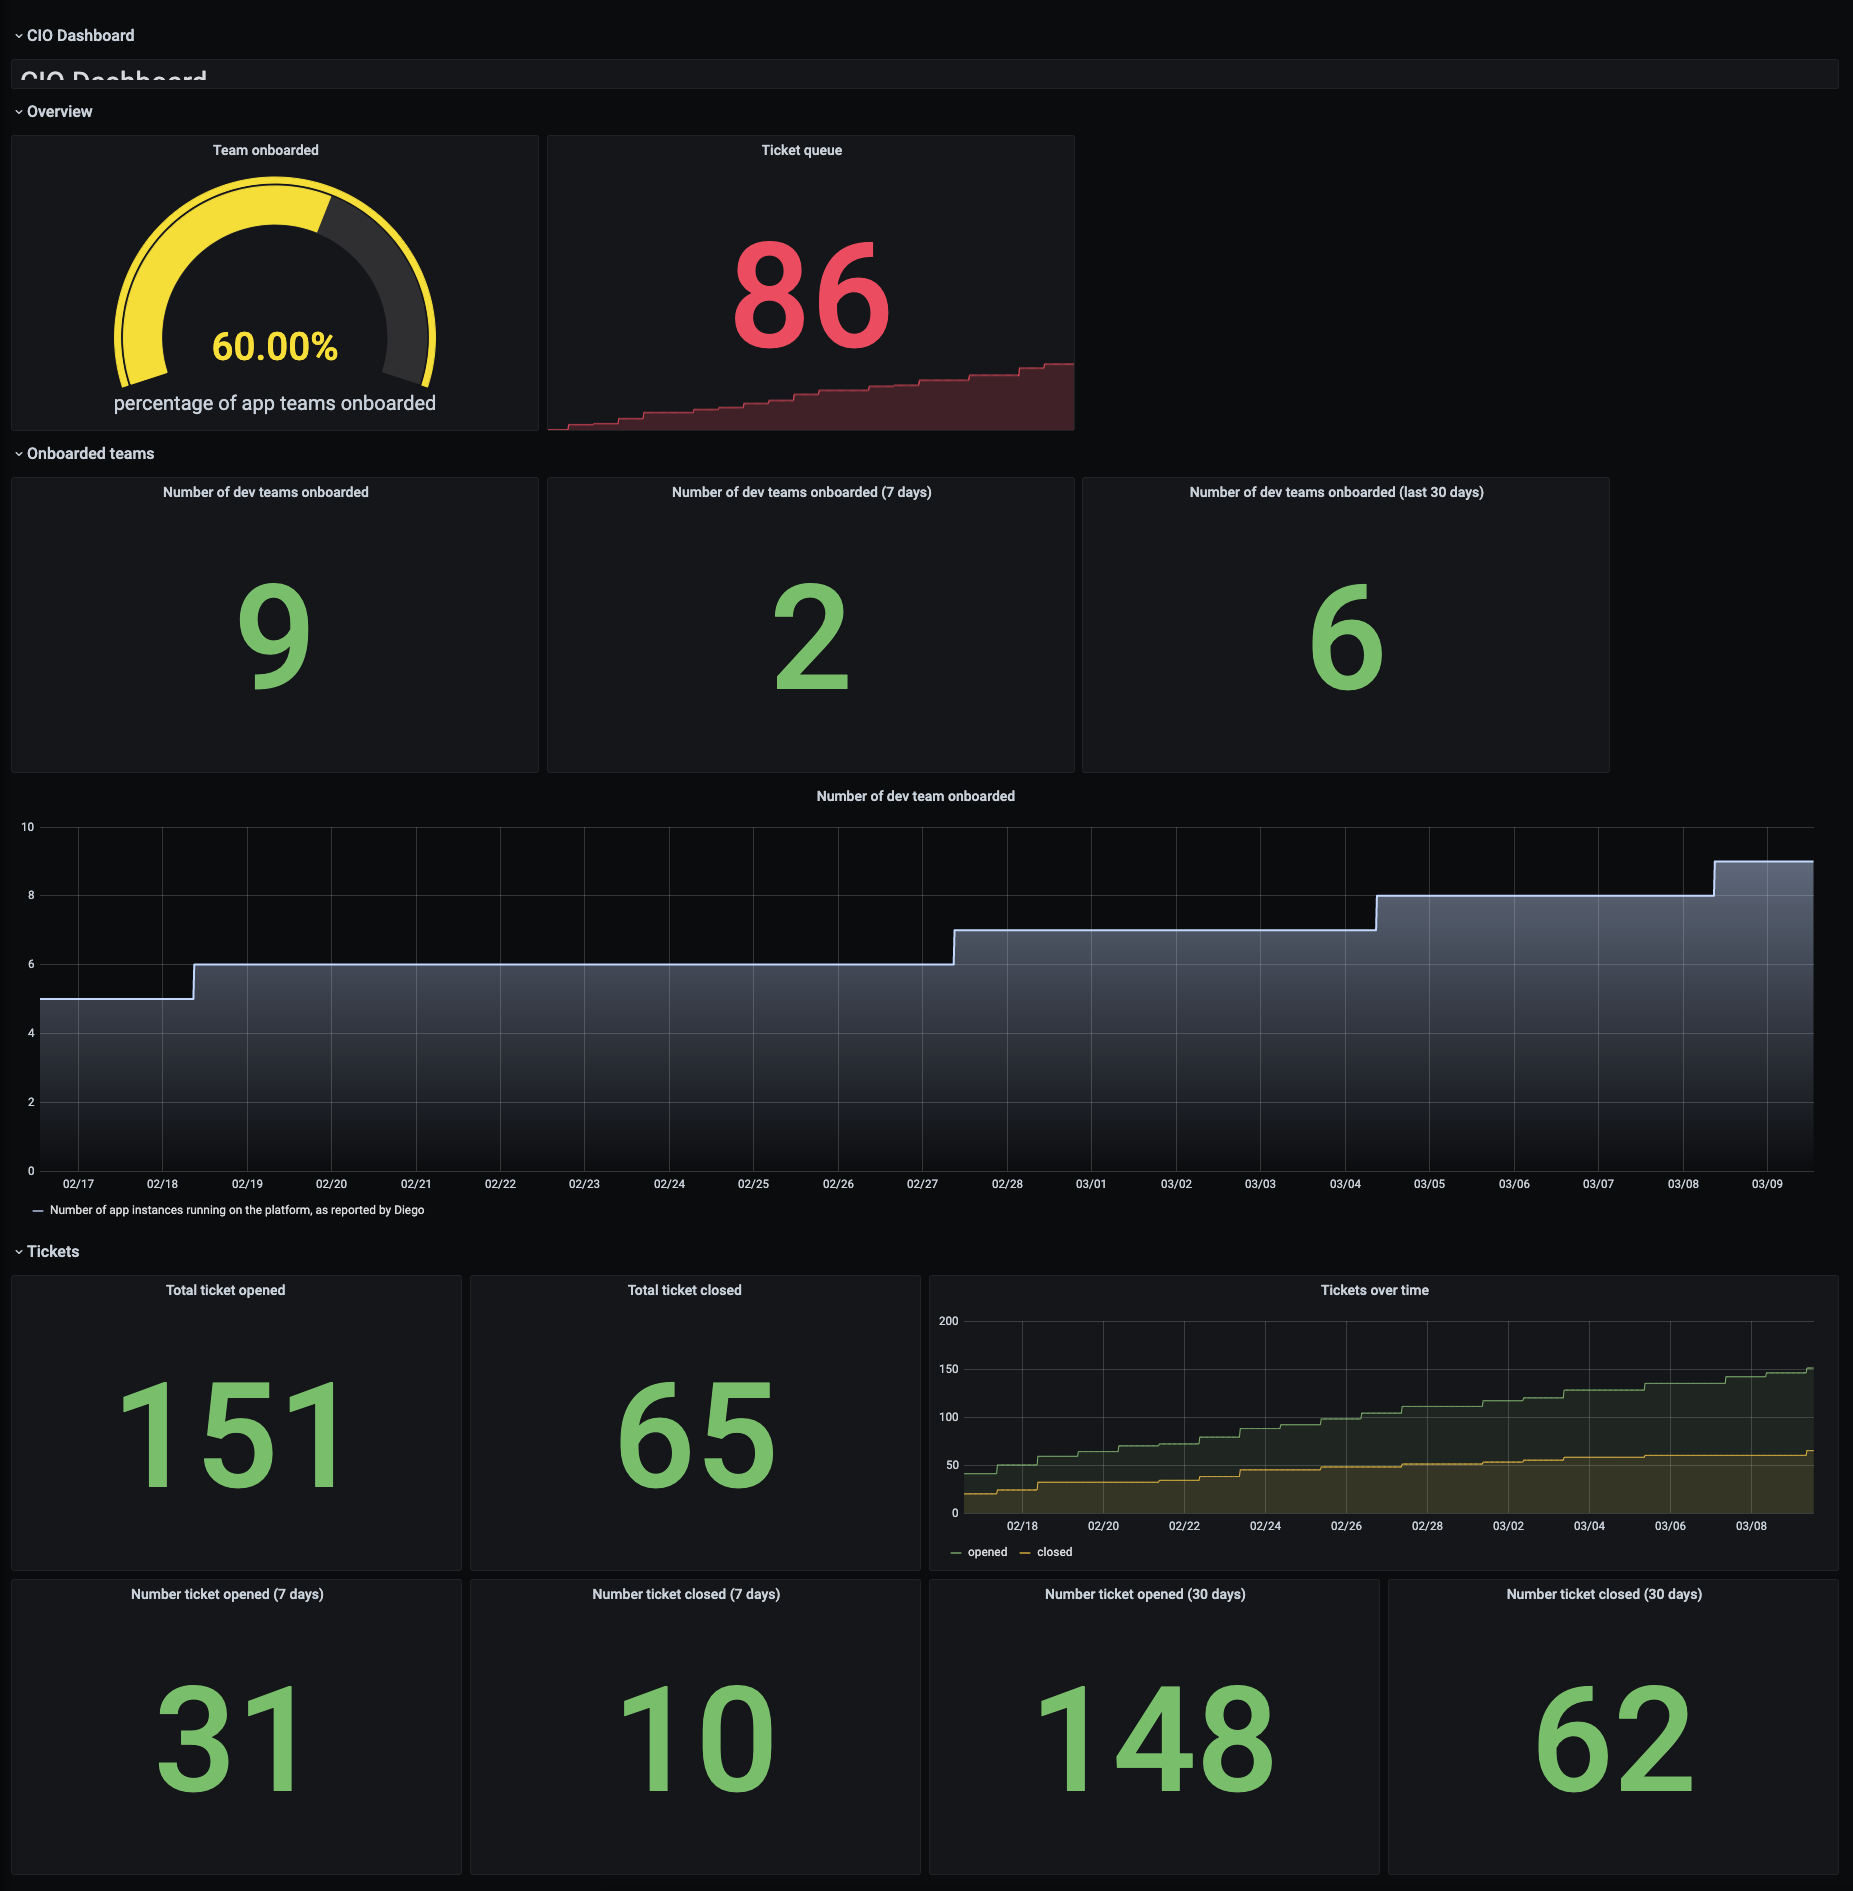
The result should look like something like below.
