Analysing the temporal dynamics in environmental conditions of Lough Neagh, Northern Ireland
RS-eco
Aim
To understand the wind driven patterns of sediment suspension in Lough Neagh, Northern Ireland
Methodology
-
Use hourly/daily wind speed and wind direction data from Aldergrove/Belfast International Airport from 2003 to 2017 to calculate wind driven currents within Lough Neagh
-
Use estimated wind driven currents to estimate the suspended sediment levels within the Lough.
Study area
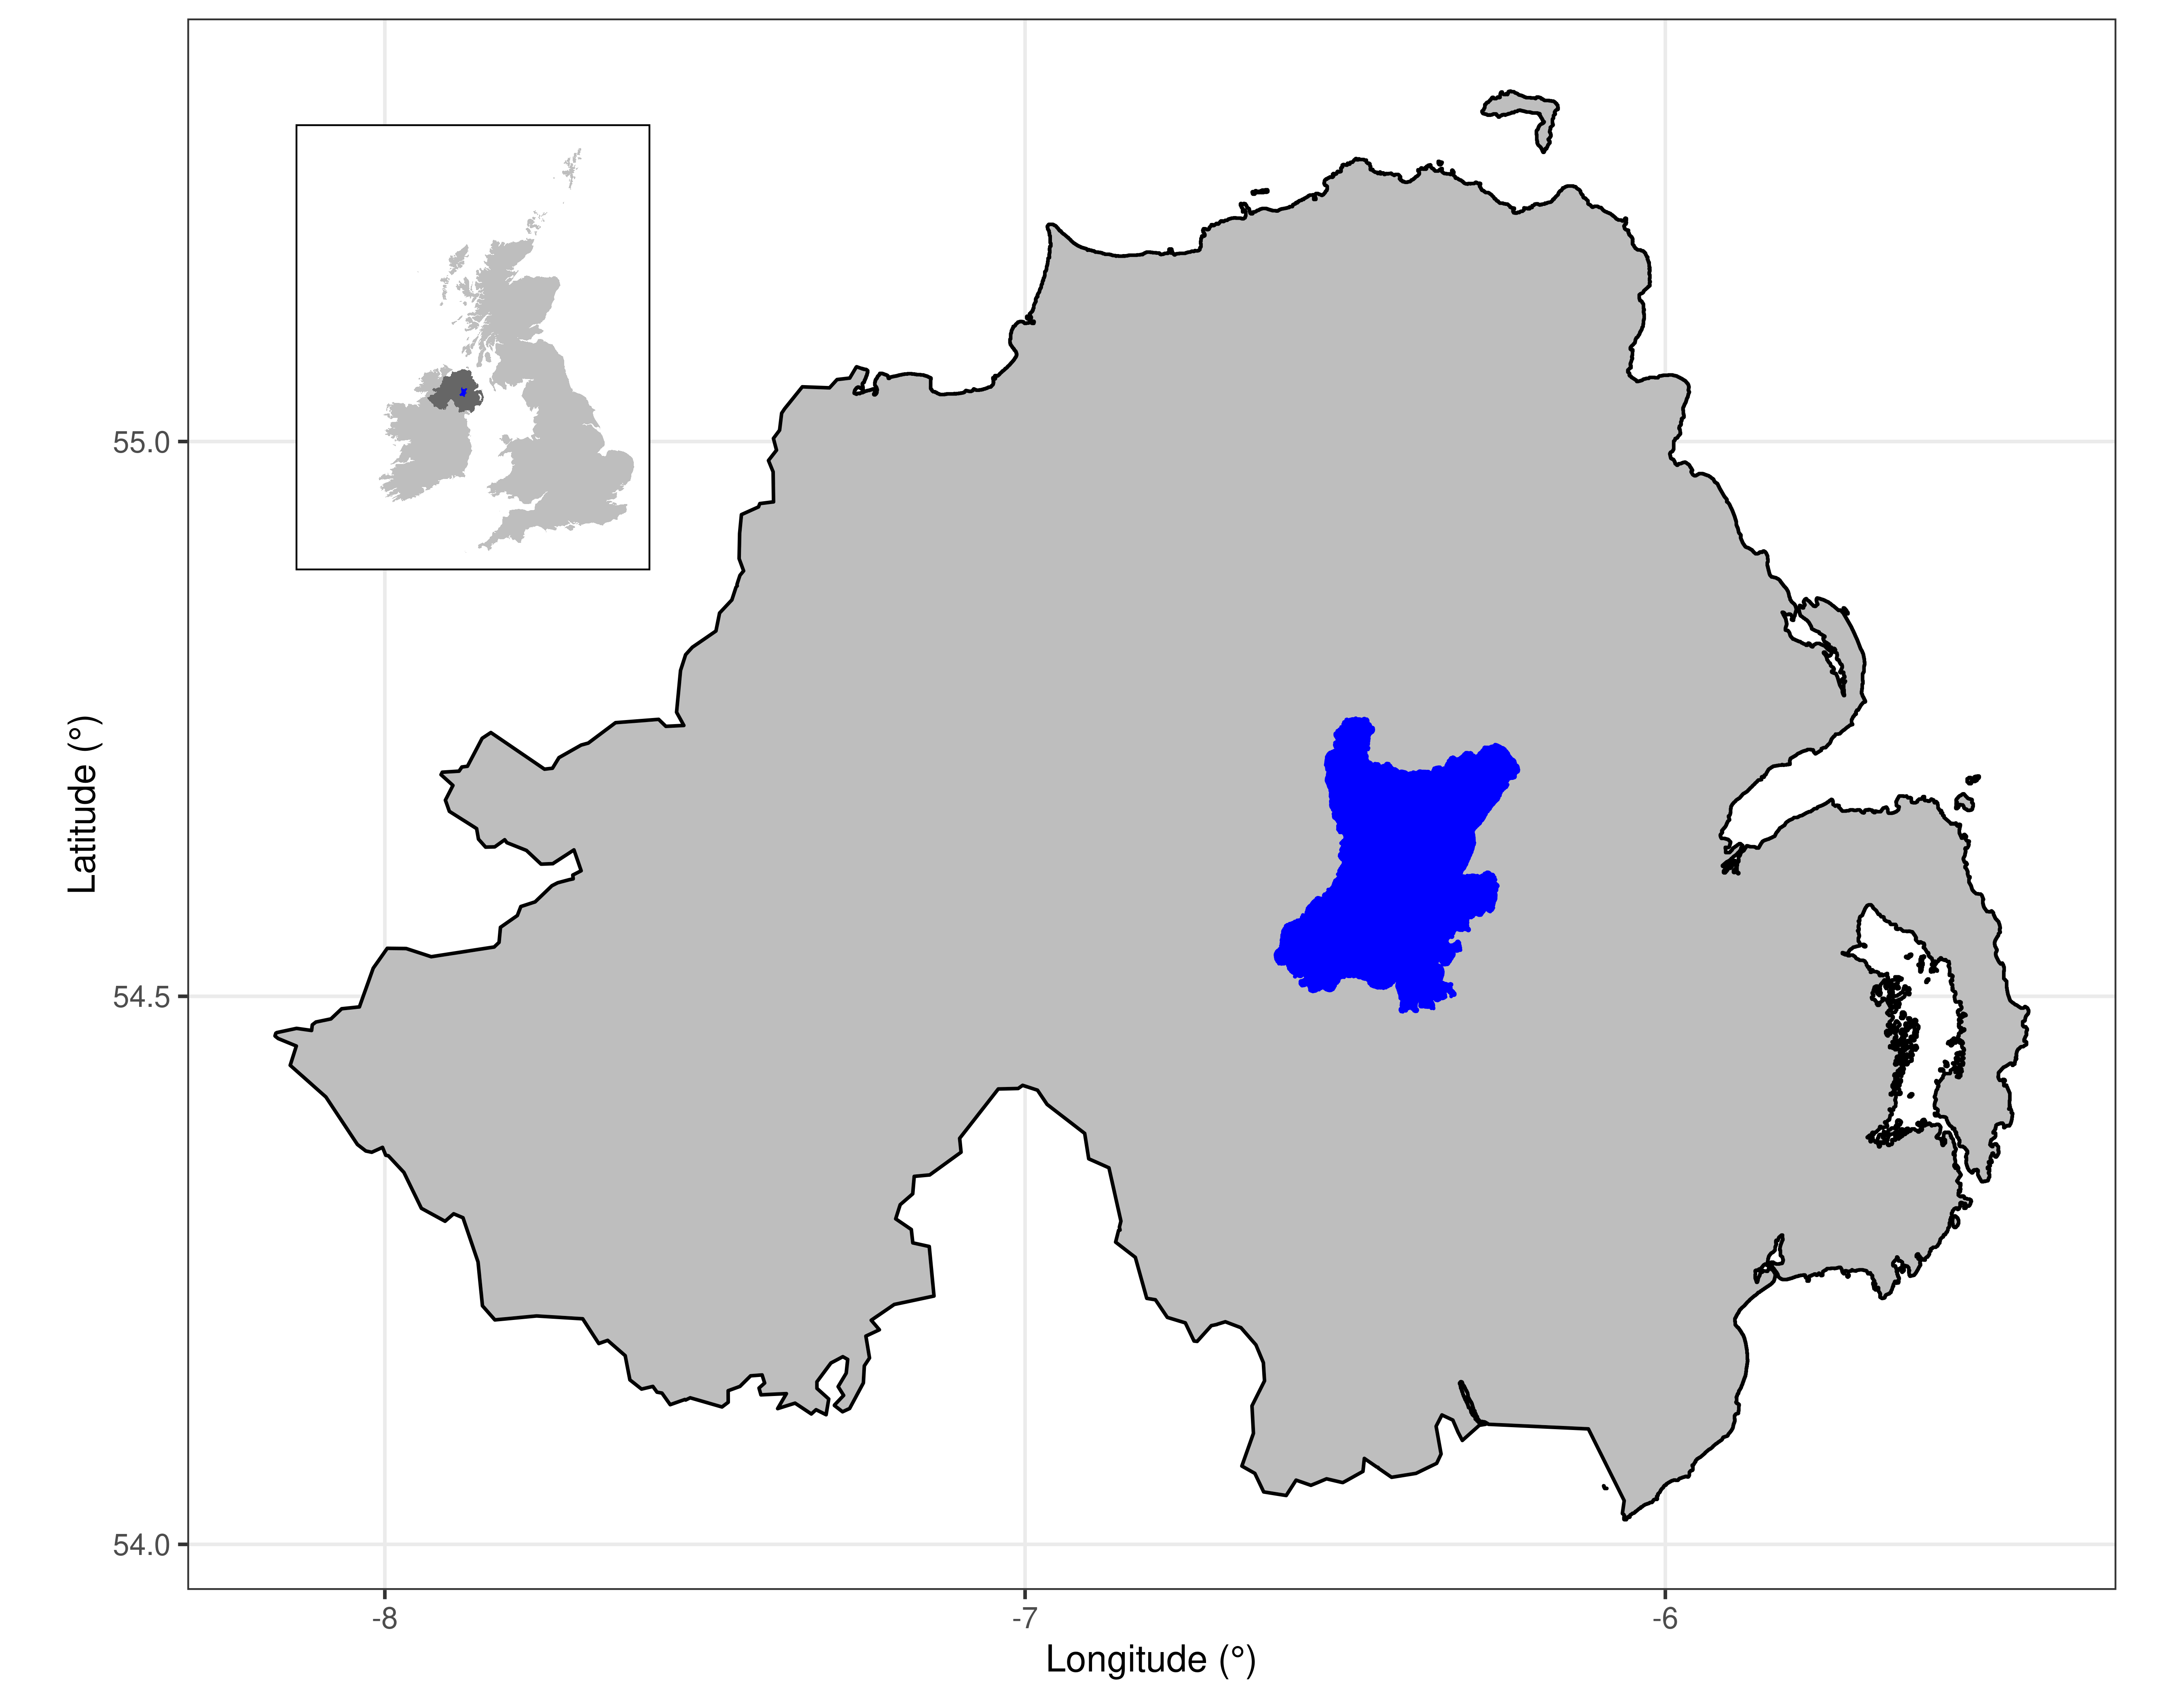
Fig. 1. Location of Lough Neagh within Northern Ireland.
Bathymetry
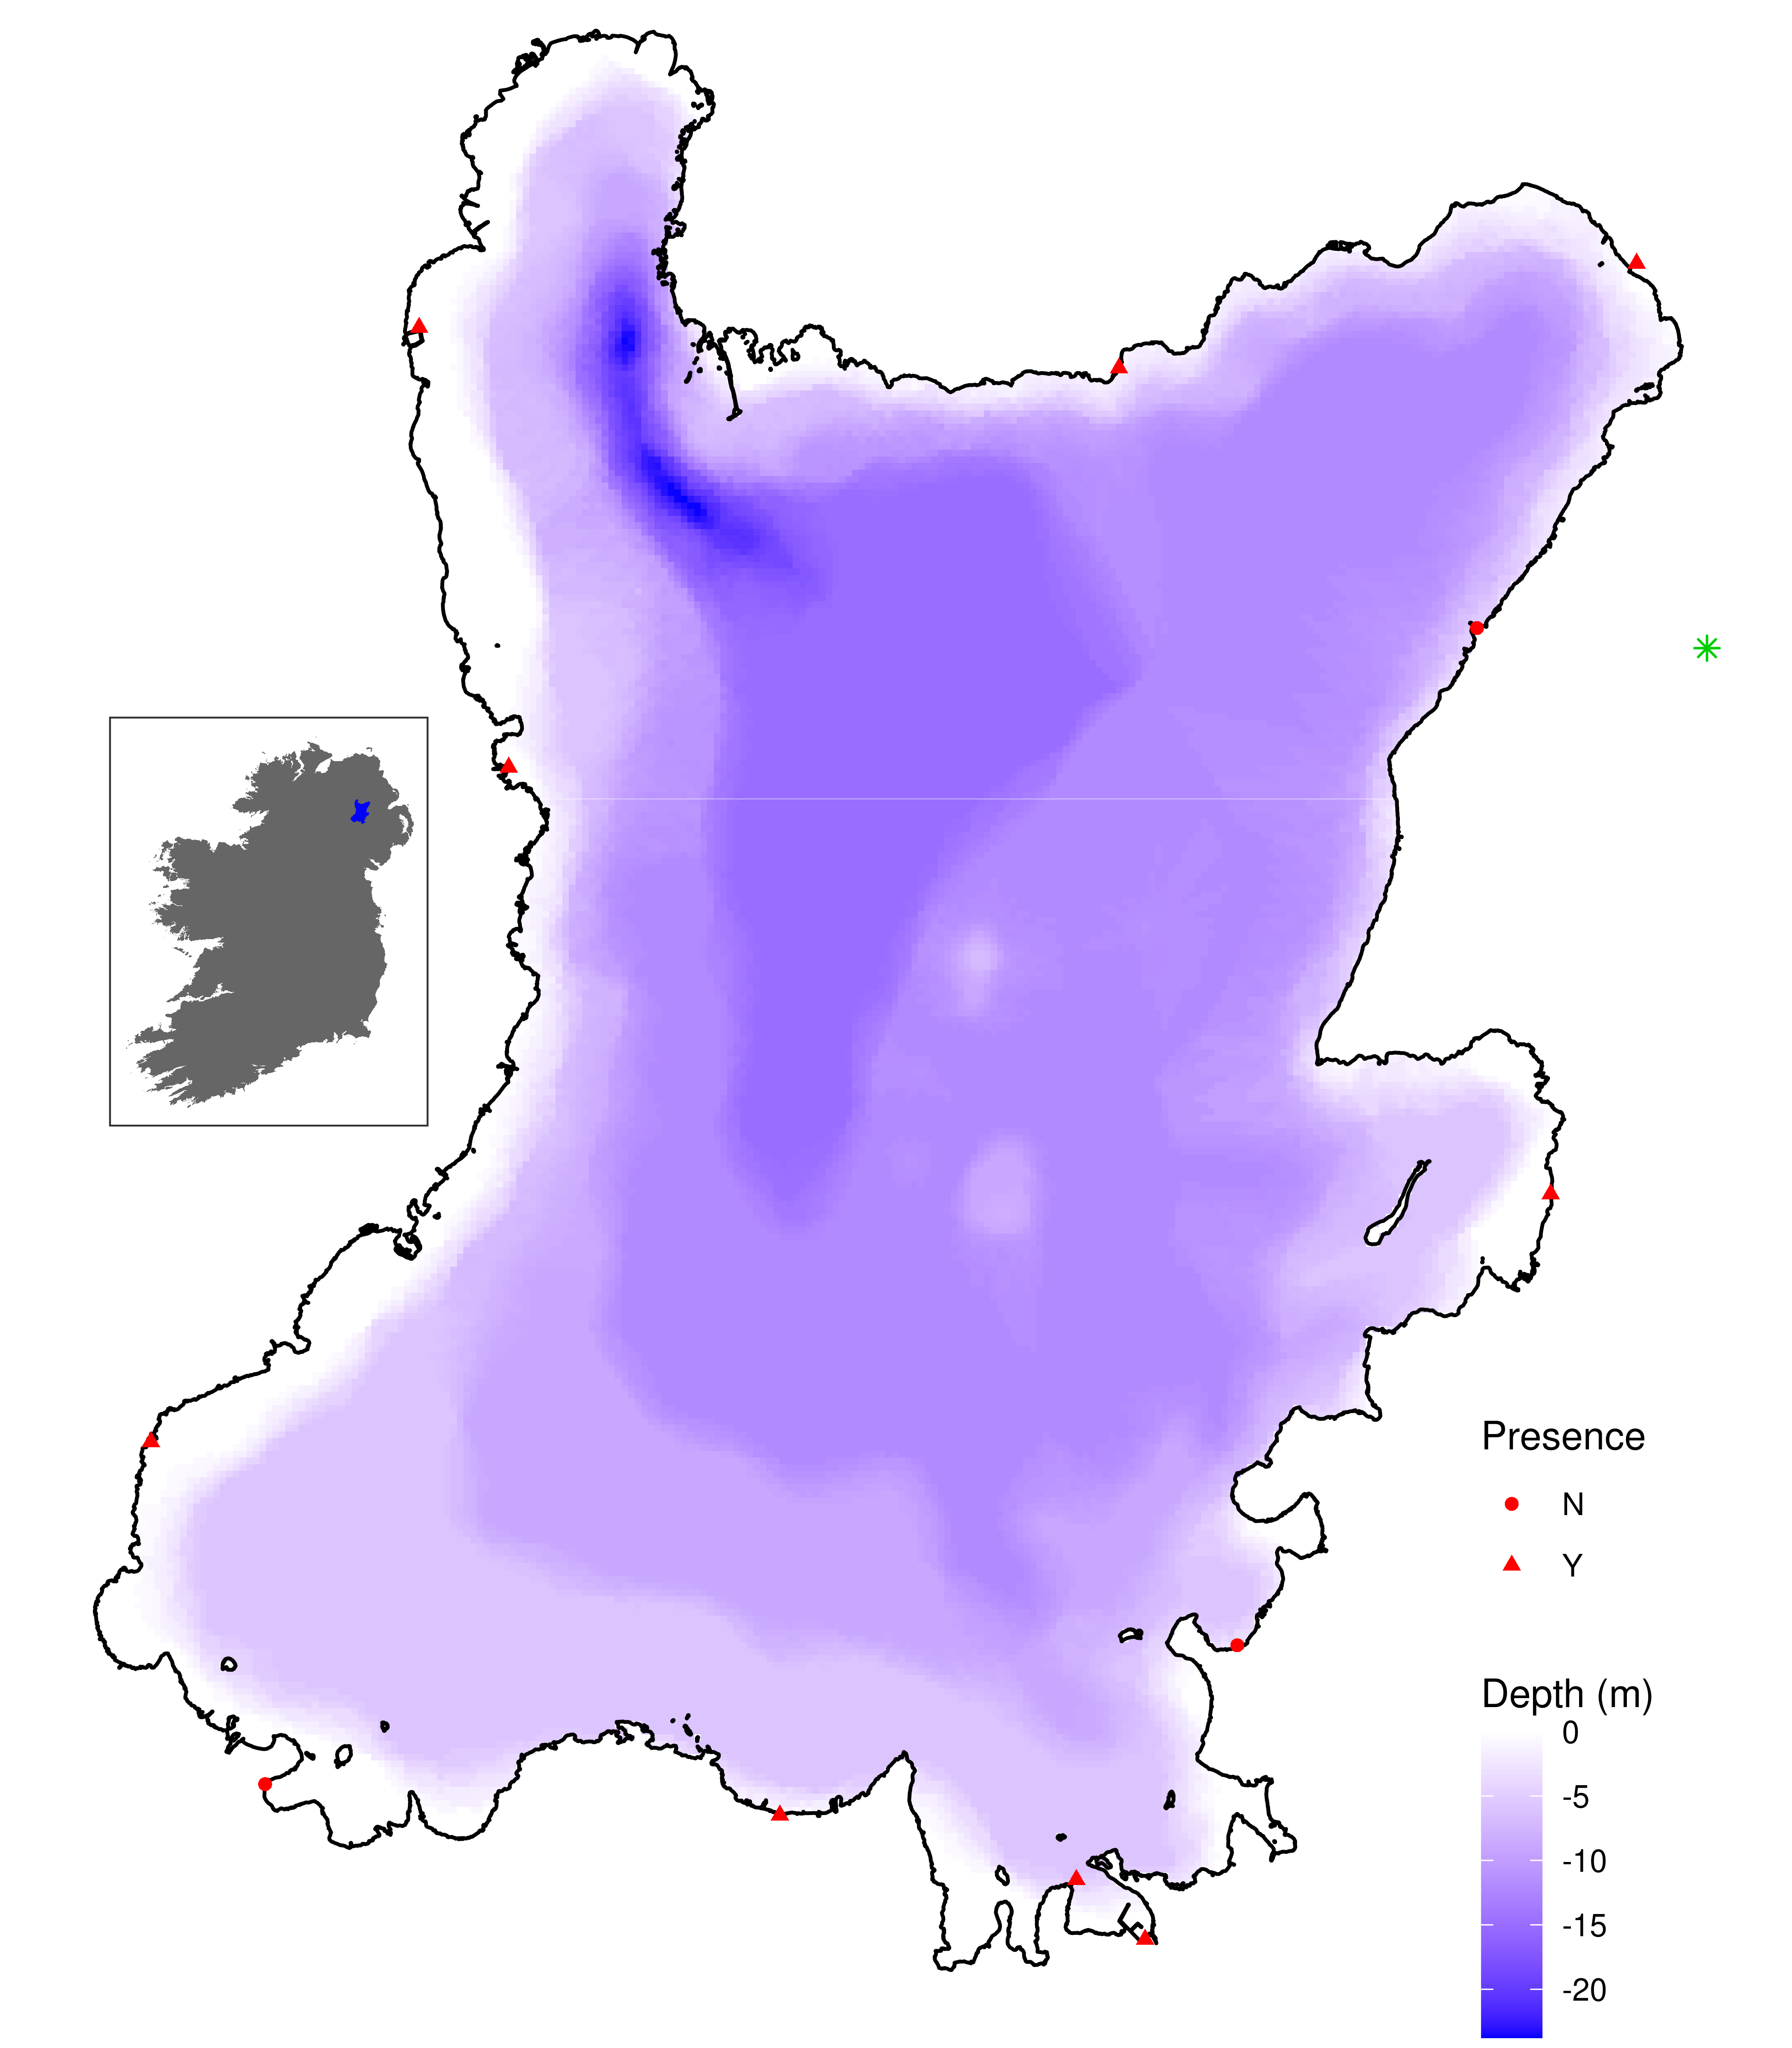
Fig. 2. Bathymetric map of Lough Neagh. Sampling locations are highlighted in red. The location of the wind station is shown in green.
Wind direction and wind speed
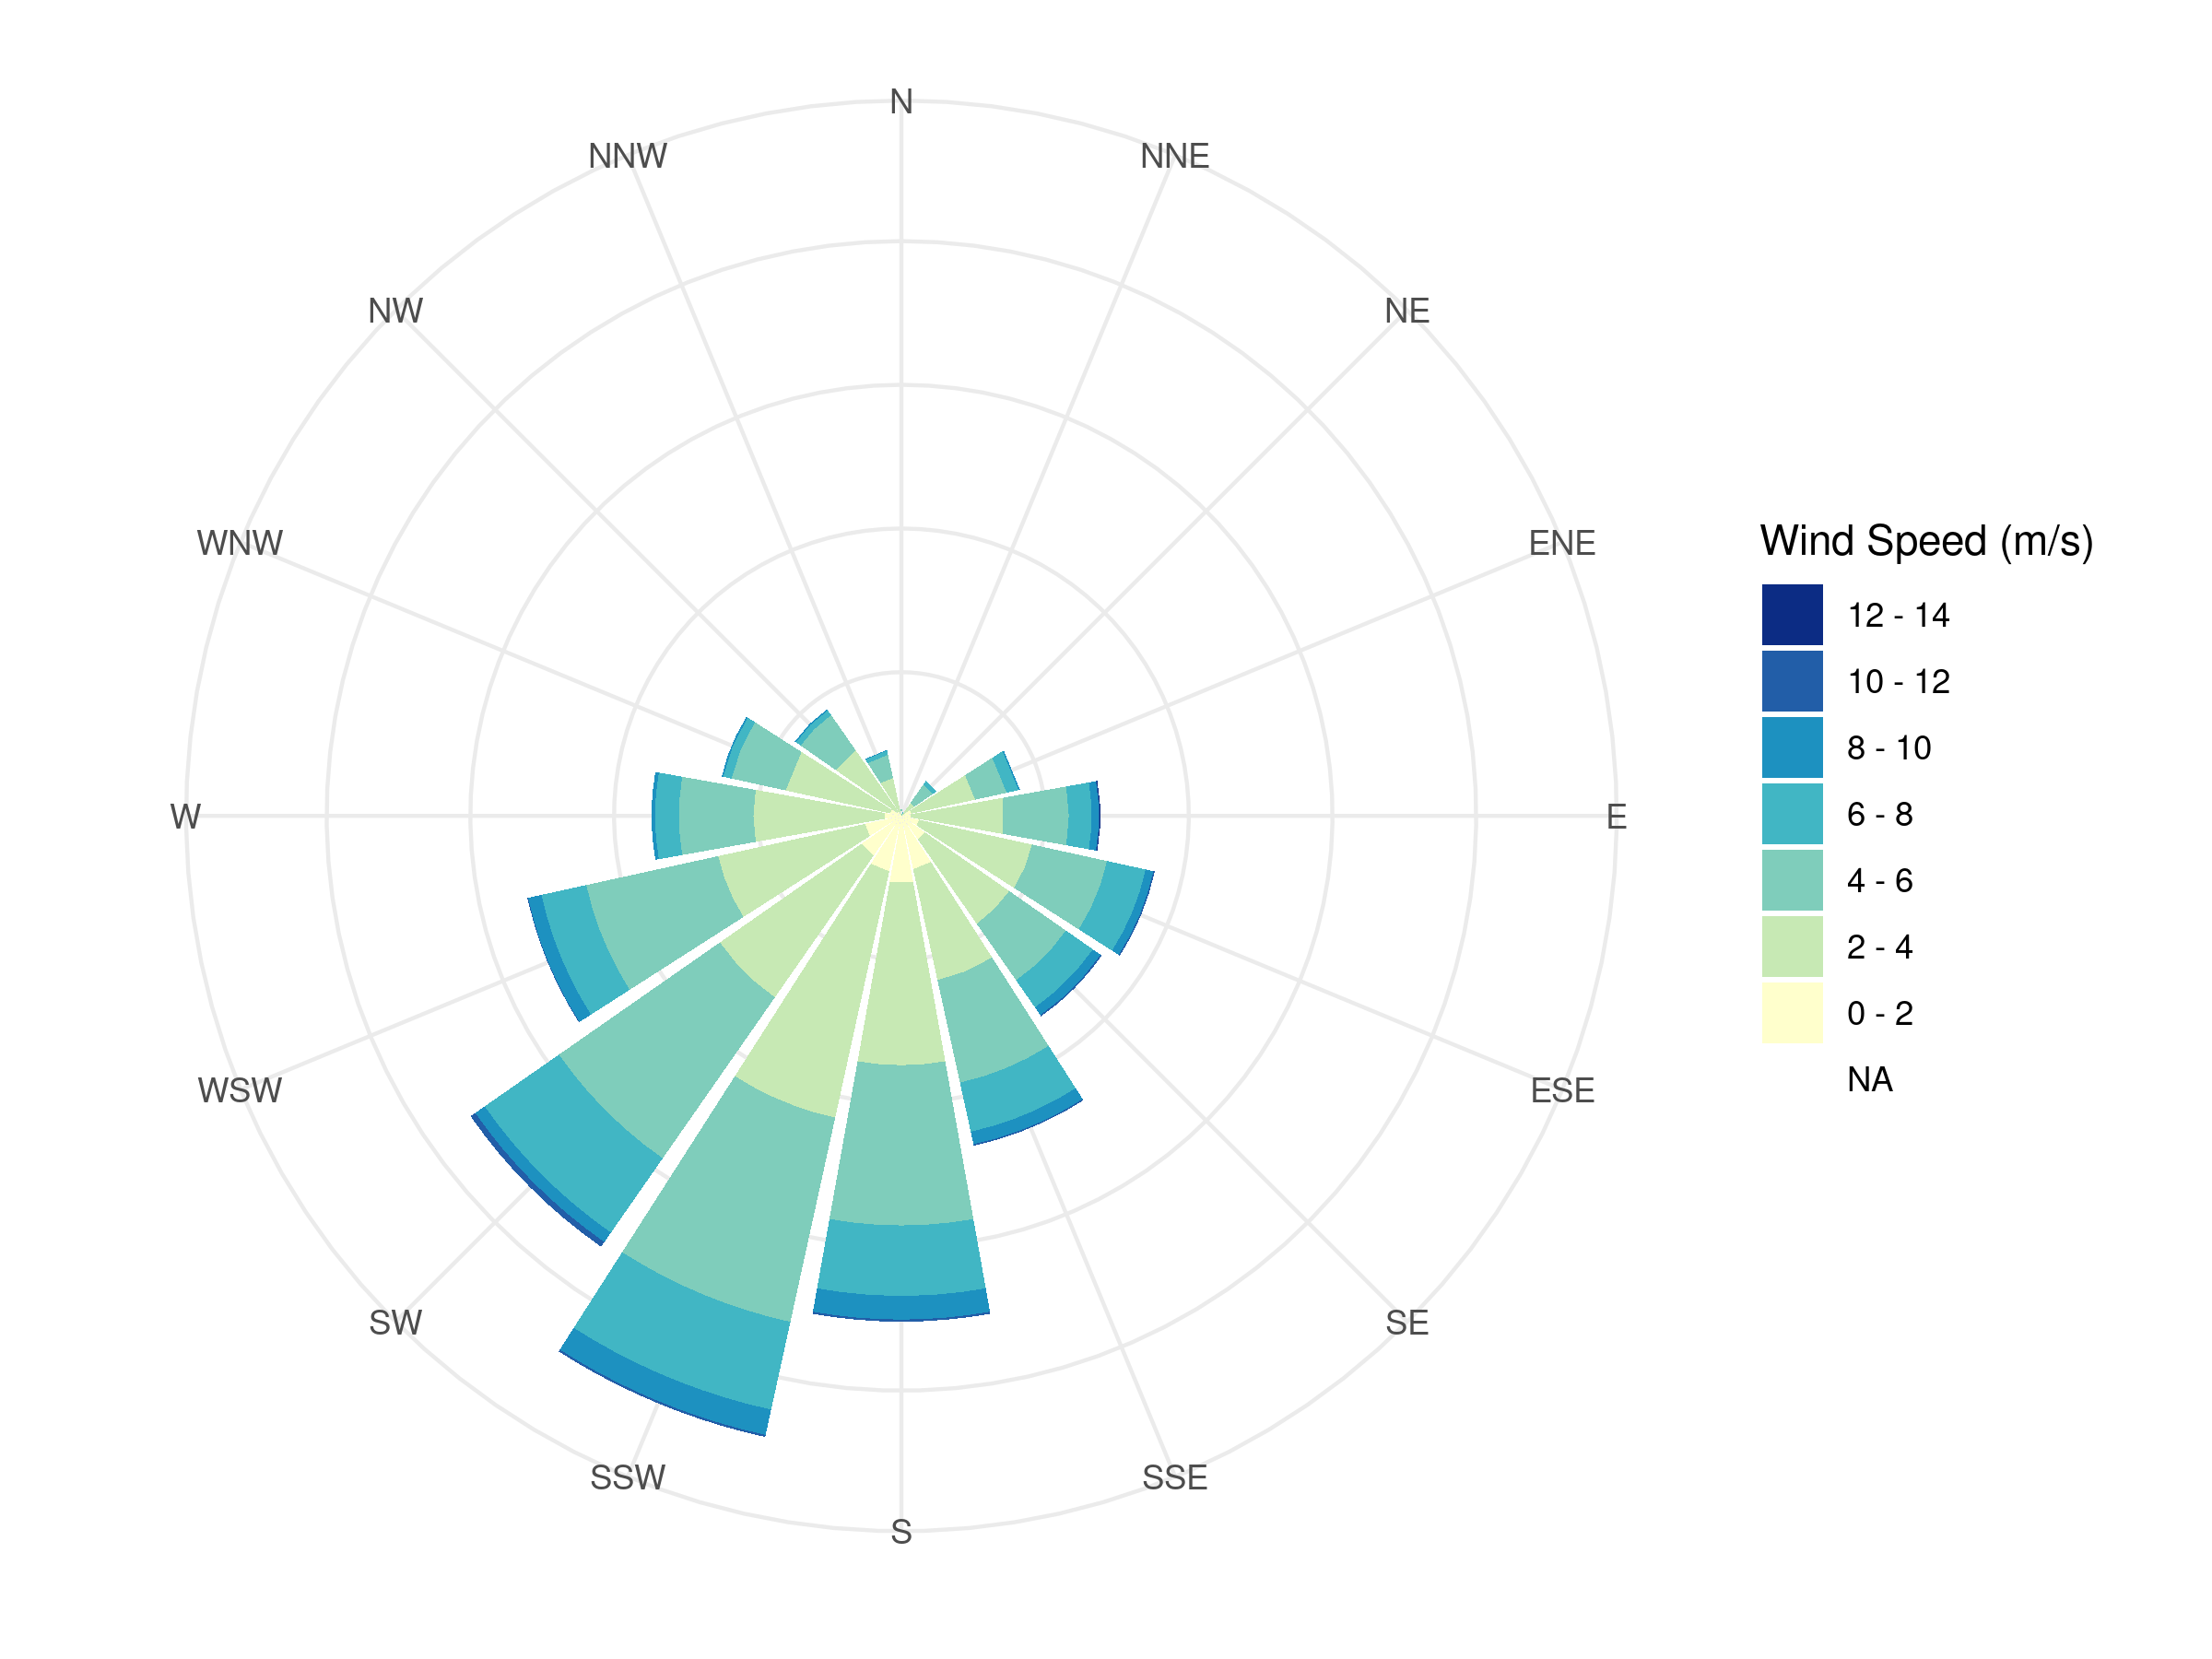
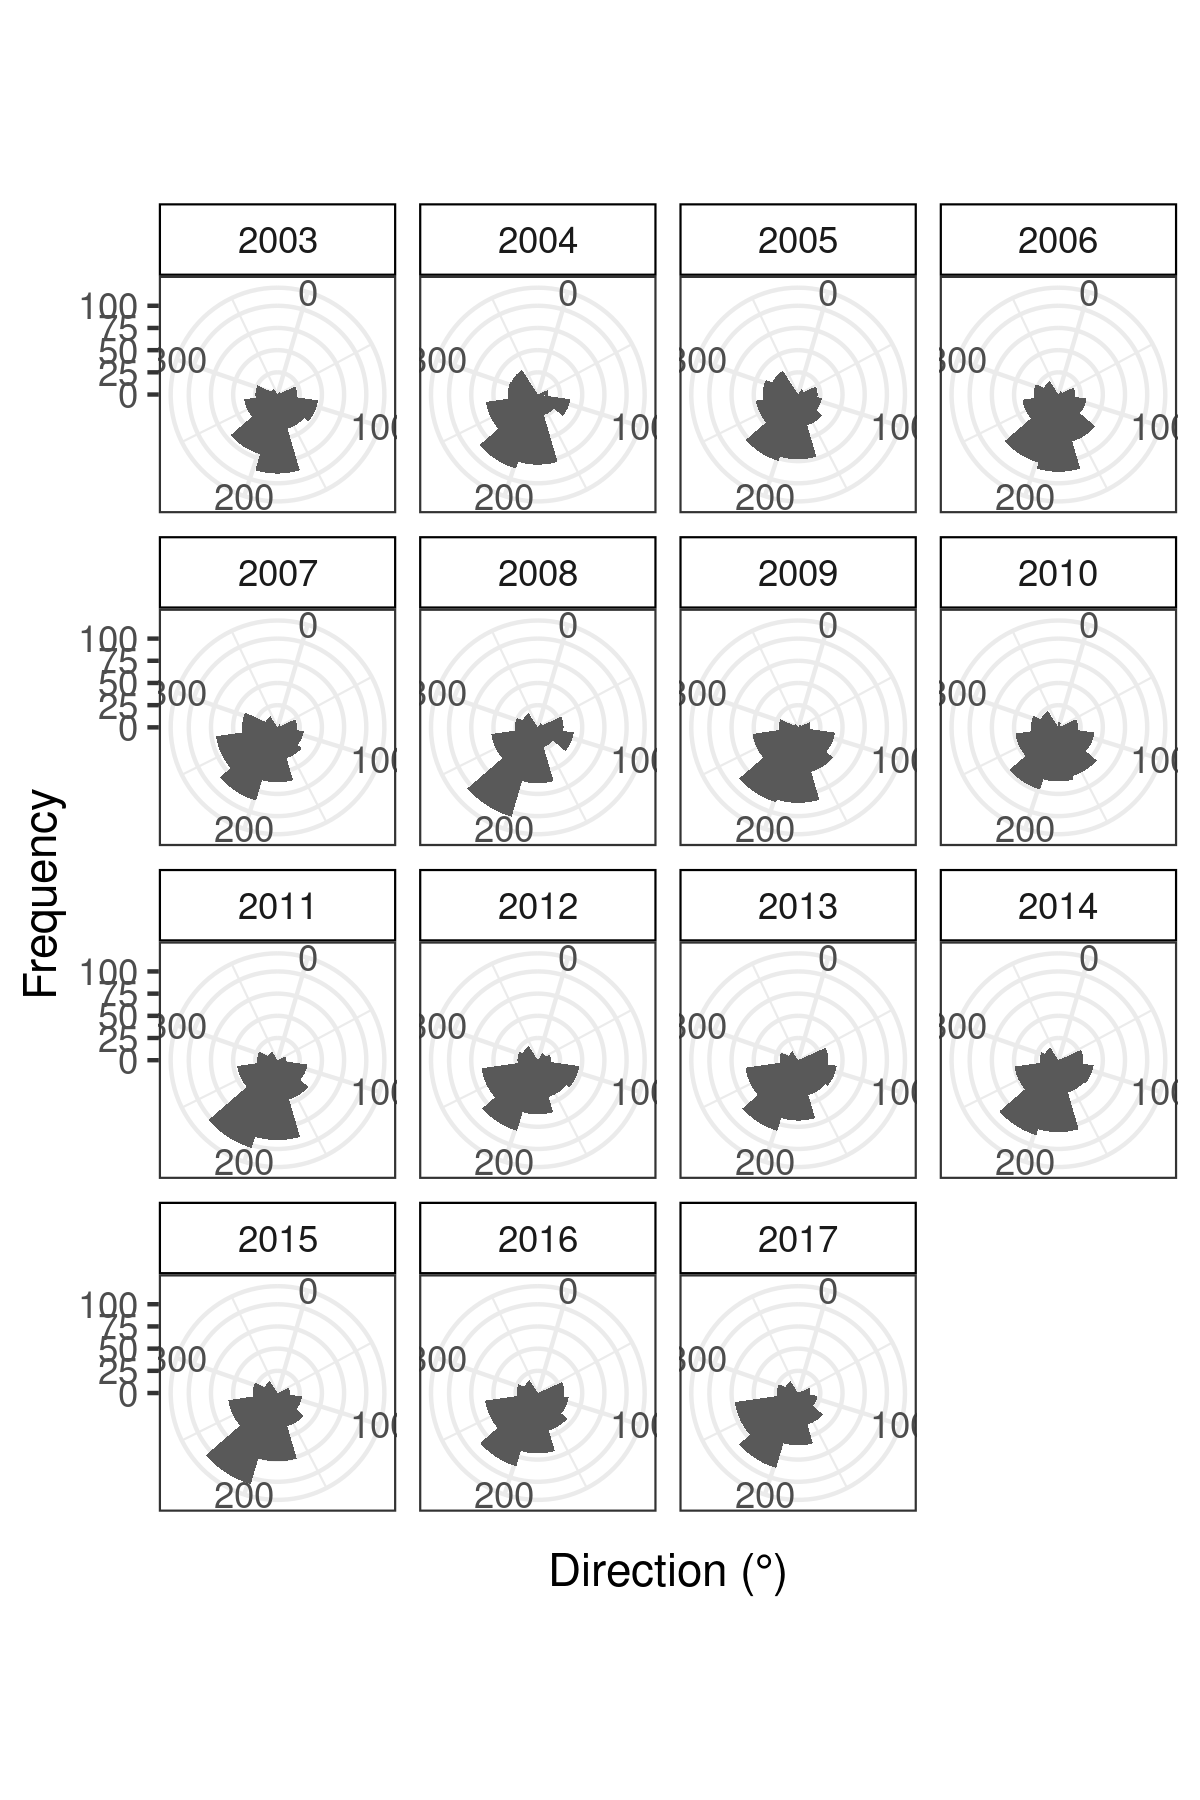
Fig. 3. Polar diagram of wind direction and wind speed from 2003 - 2017.
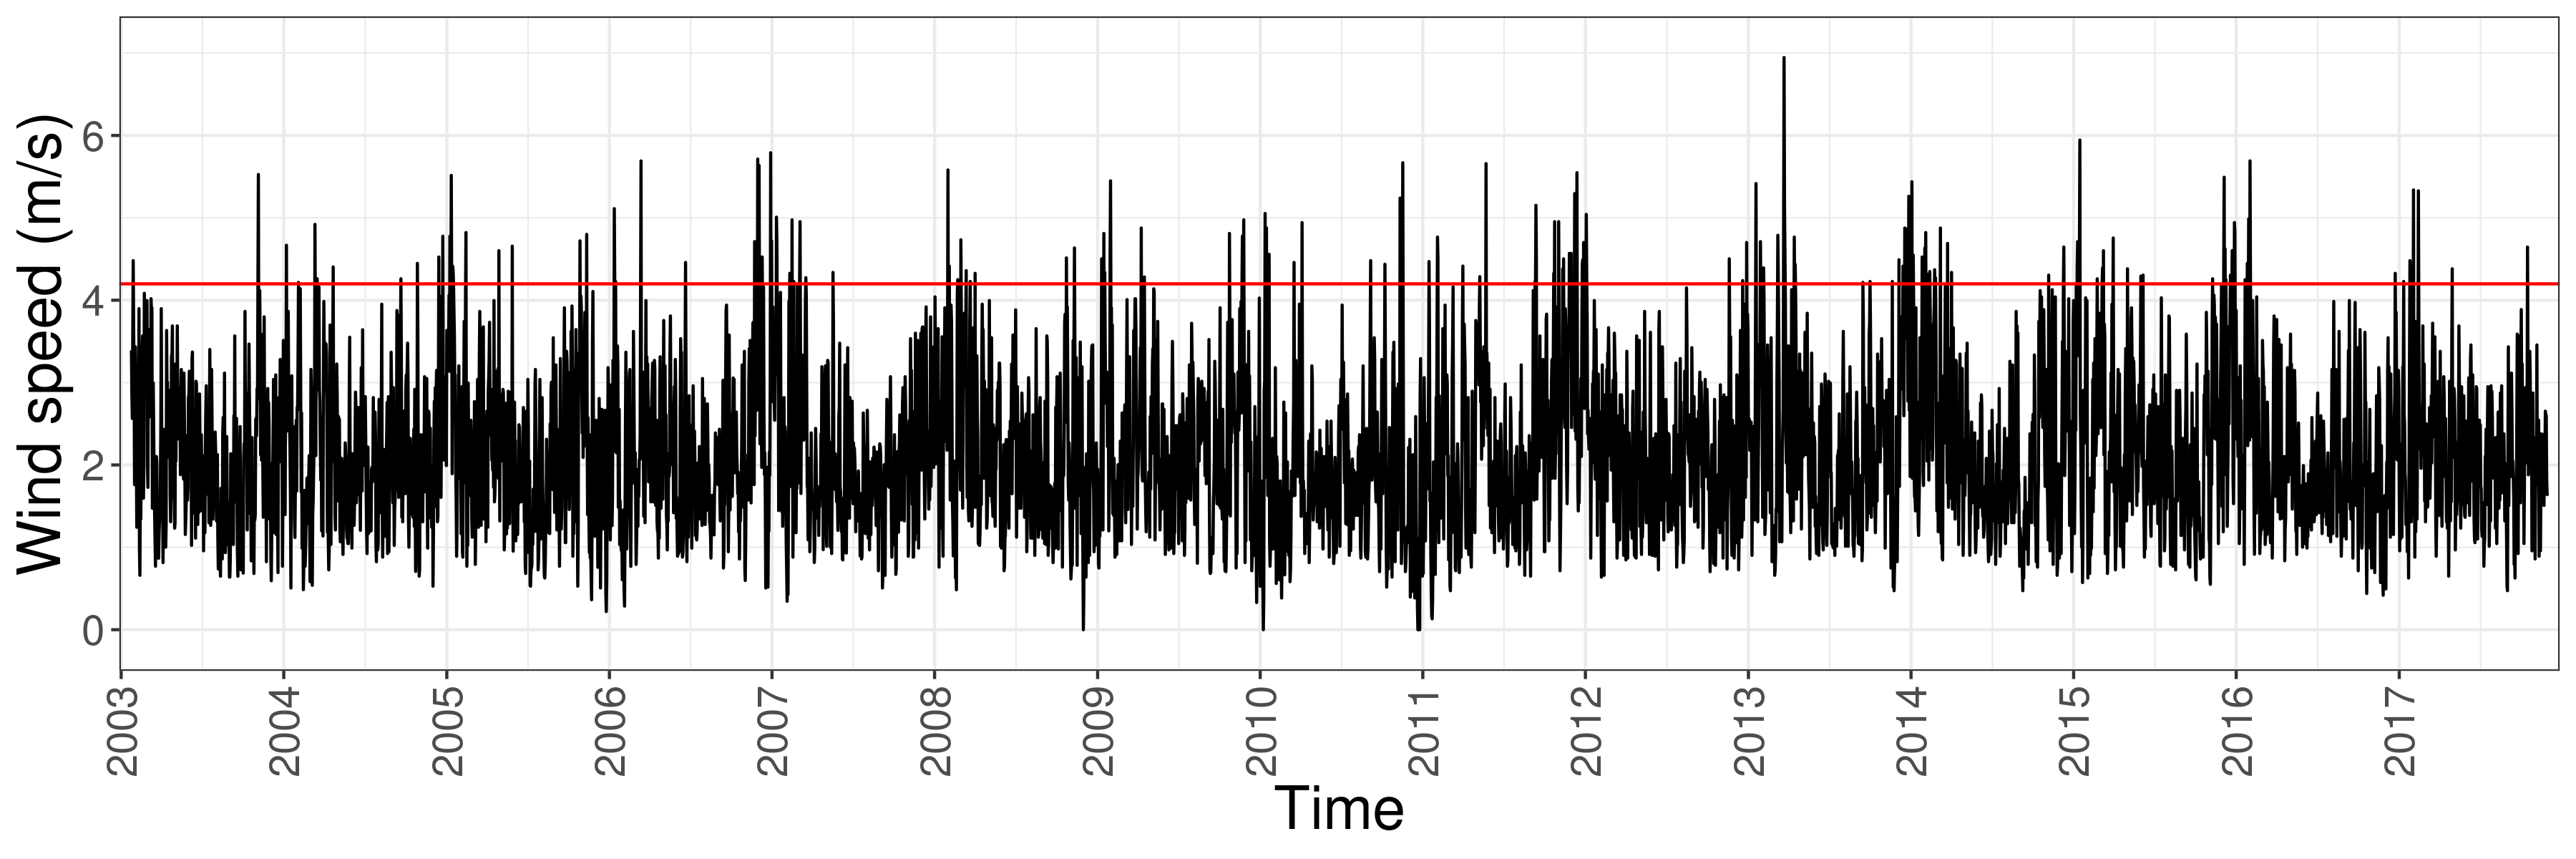
Fig. 4. Wind speed over time from 2003 - 2017.
Table 1. Mean wind speed and wind direction from 2003 - 2017.
| year | avg_speed | avg_dir |
|---|---|---|
| 2003 | 8.15 | 184.17 |
| 2004 | 8.15 | 209.59 |
| 2005 | 8.23 | 203.71 |
| 2006 | 8.25 | 192.14 |
| 2007 | 7.97 | 203.07 |
| 2008 | 8.32 | 194.62 |
| 2009 | 8.38 | 188.85 |
| 2010 | 6.92 | 189.52 |
| 2011 | 8.61 | 196.65 |
| 2012 | 7.96 | 193.67 |
| 2013 | 8.62 | 187.27 |
| 2014 | 8.30 | 191.19 |
| 2015 | 8.75 | 202.21 |
| 2016 | 7.82 | 193.57 |
| 2017 | 8.10 | 205.27 |
Fetch
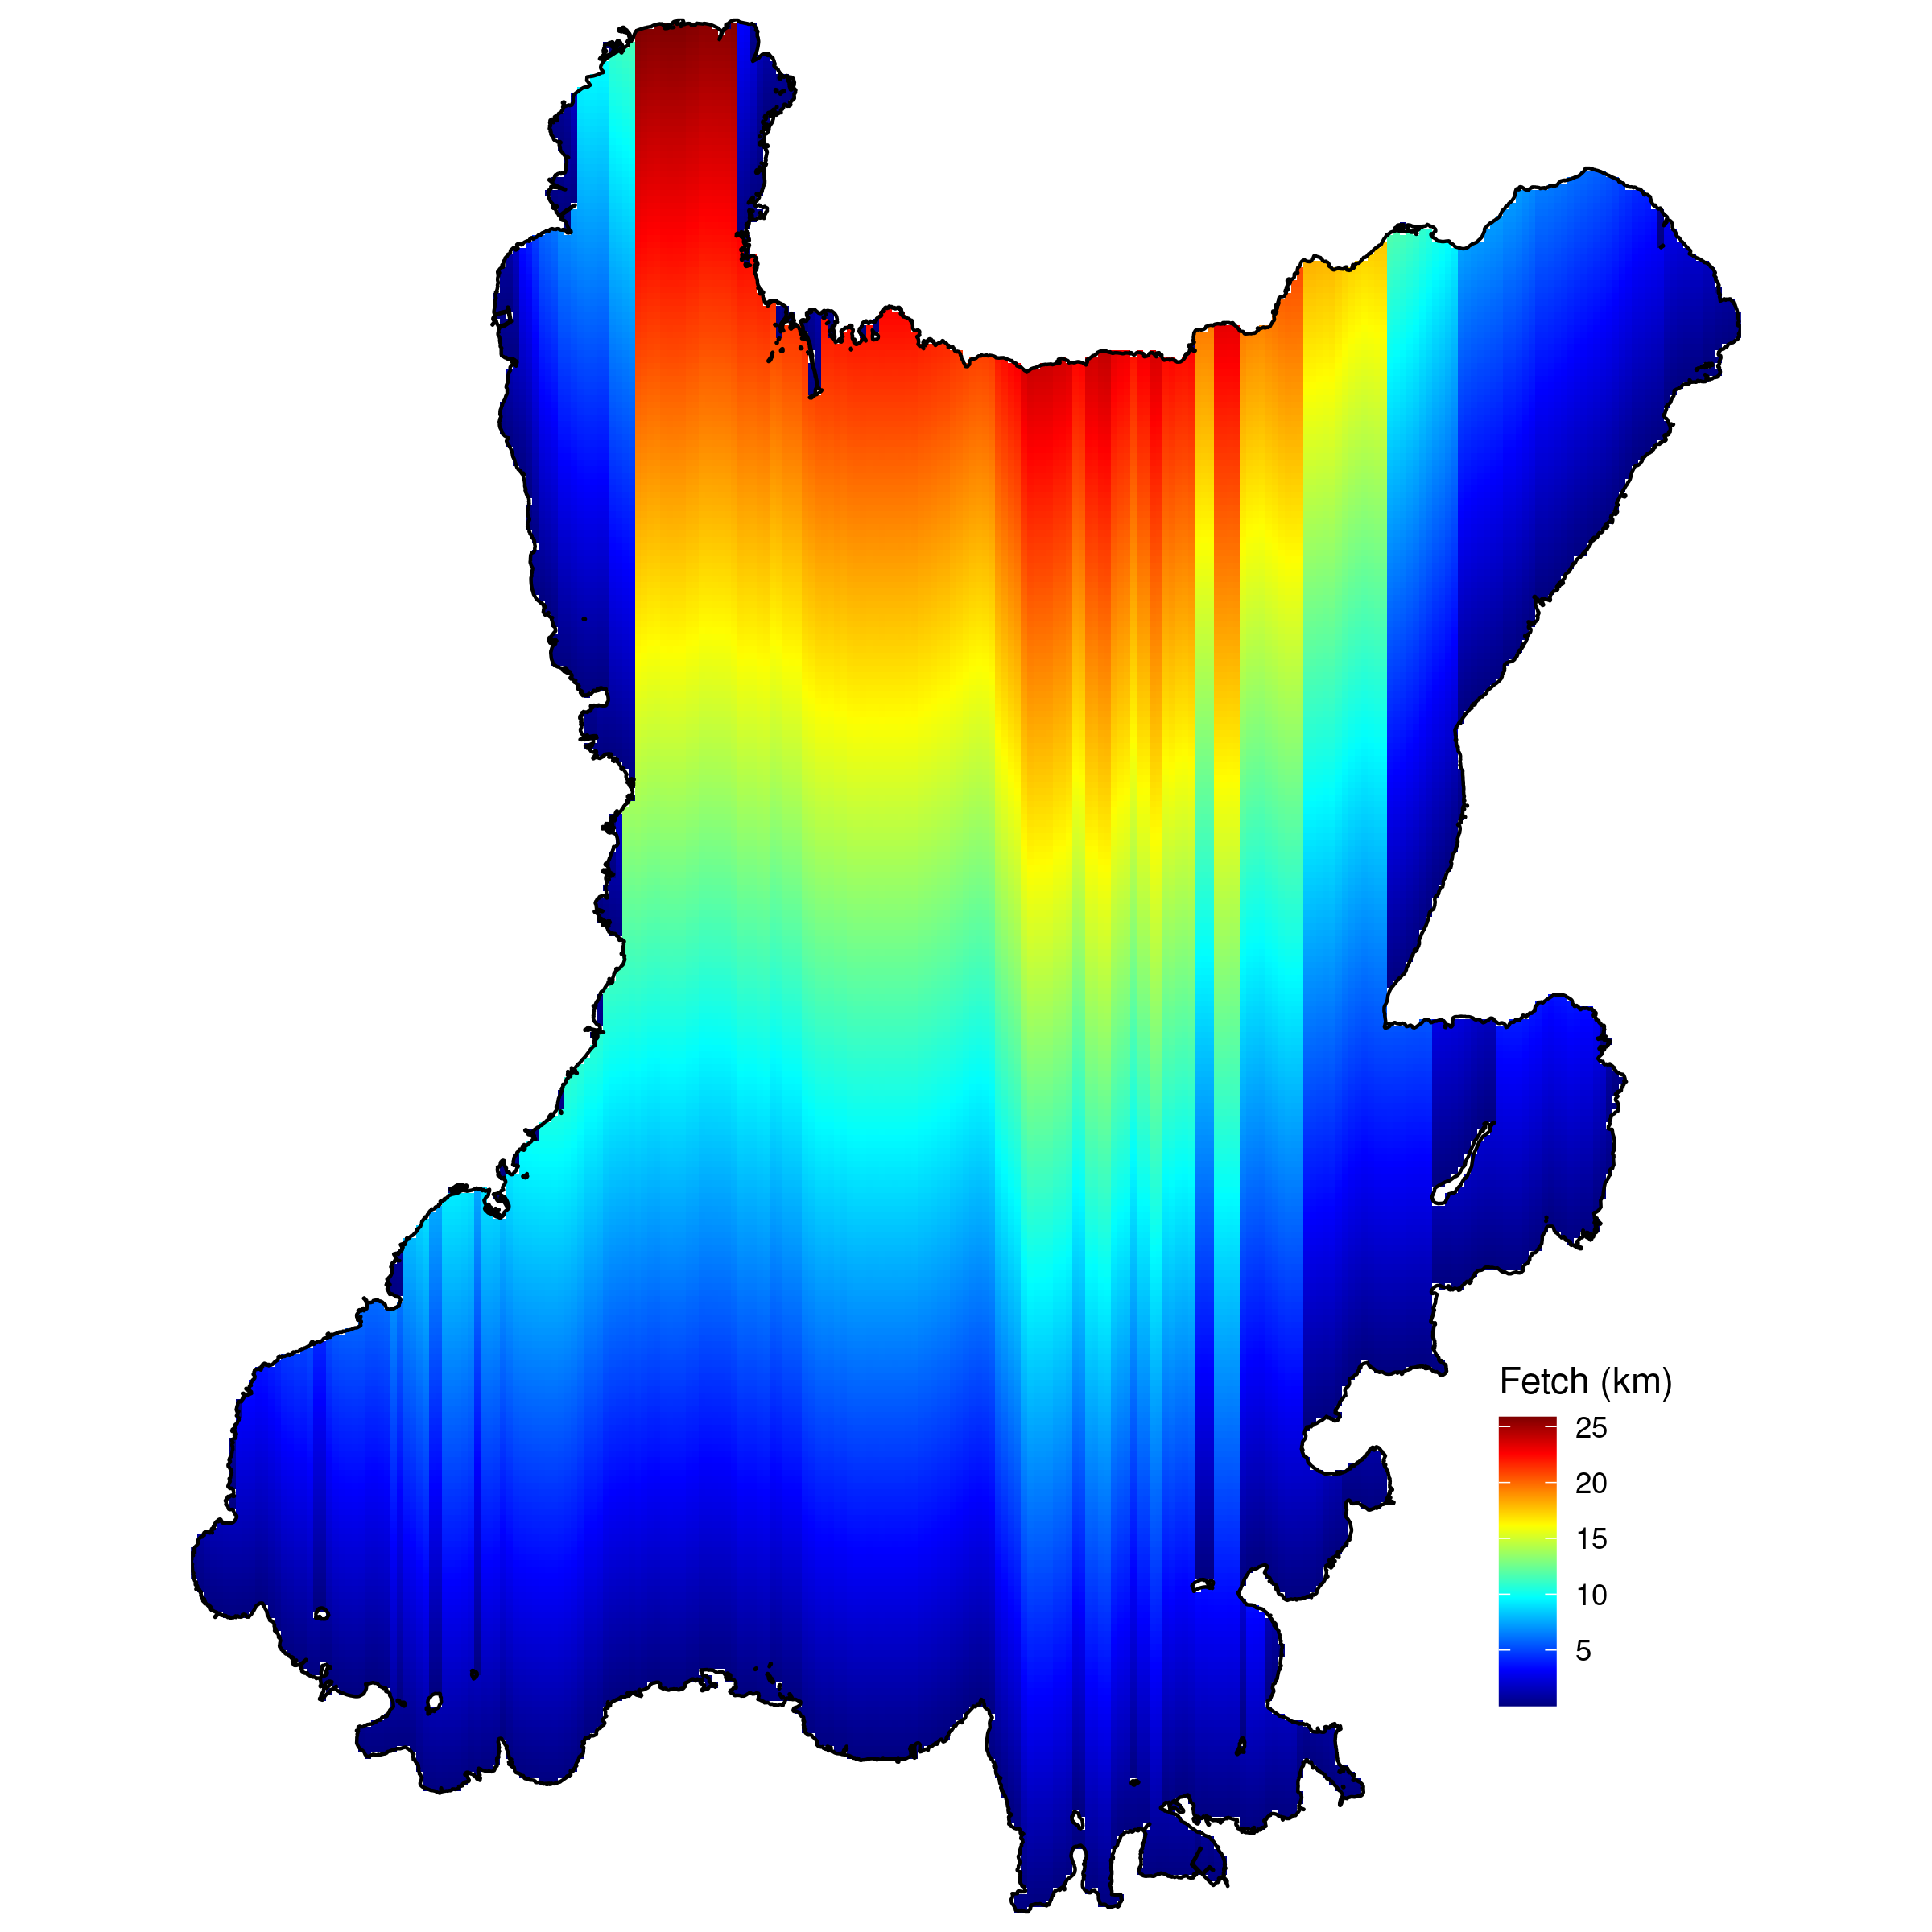
Fig. 5. Map of the fetch of the prevailing (mean) wind direction (180°).
Significant wave height
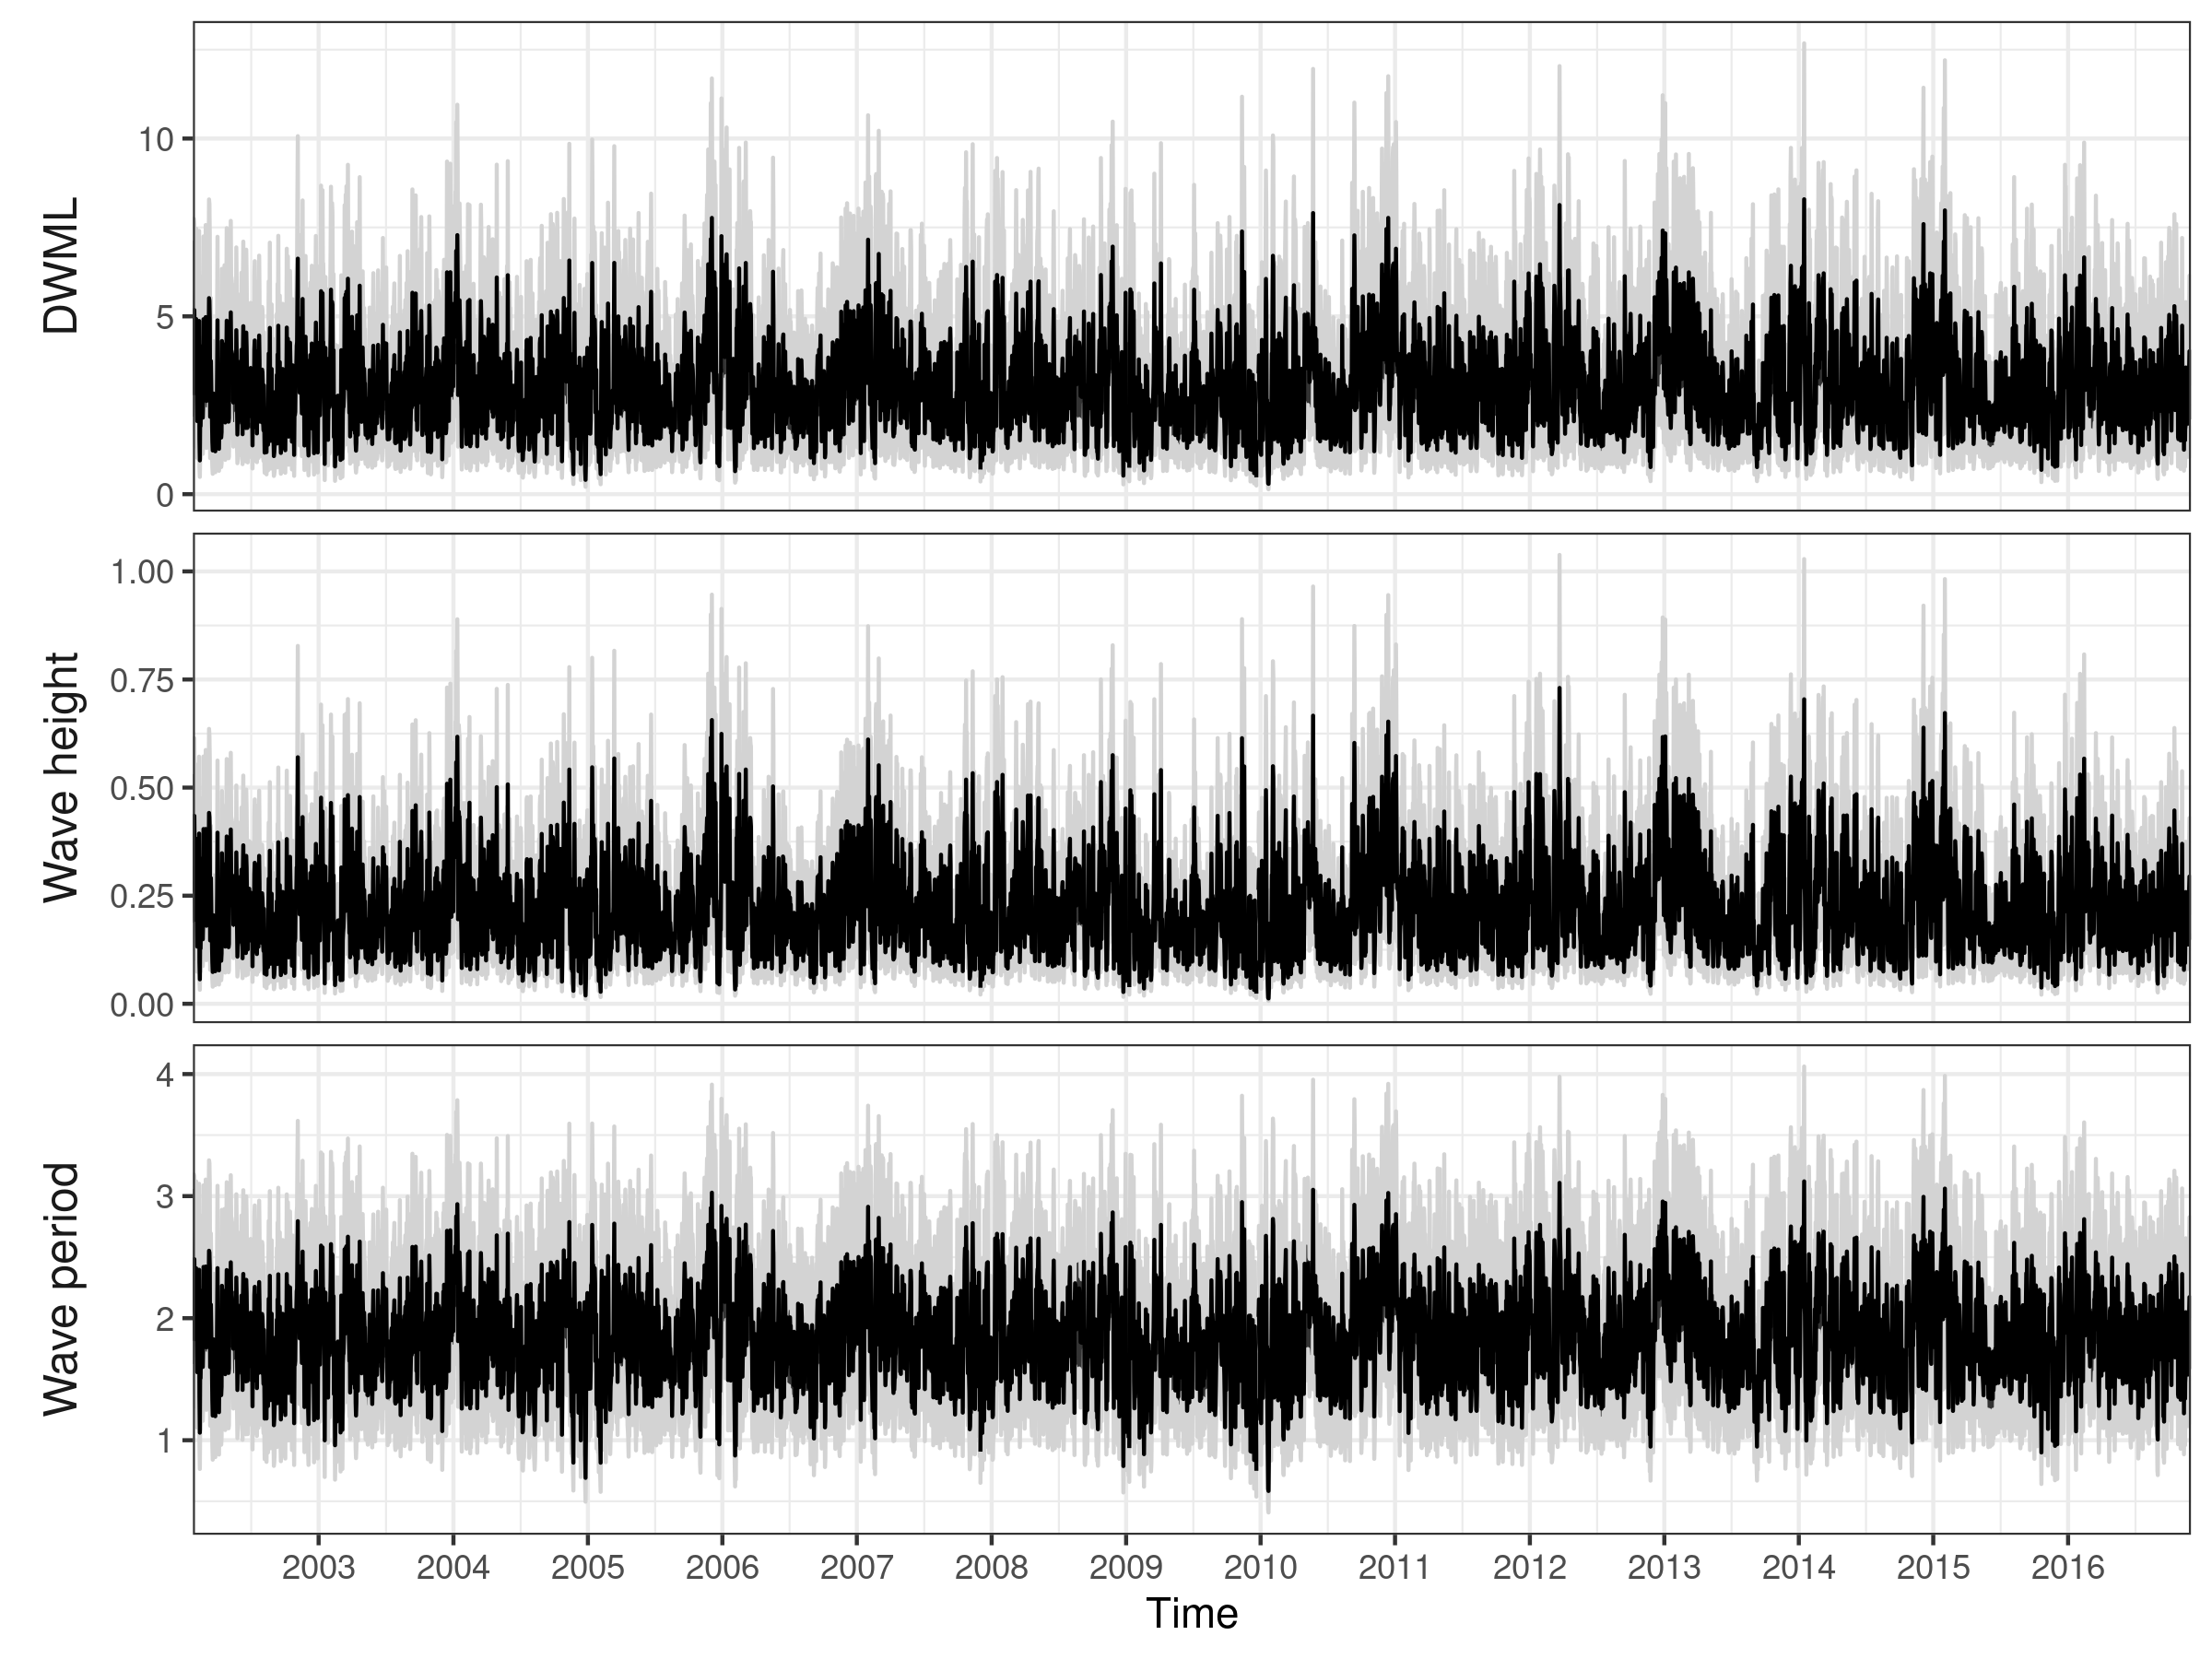
Fig. 6. Mean wave height (± SD), mean wave period (± SD) and mean water mixed layer depth (± SD) from 2003 - 2017.
Cumulative sediment suspension
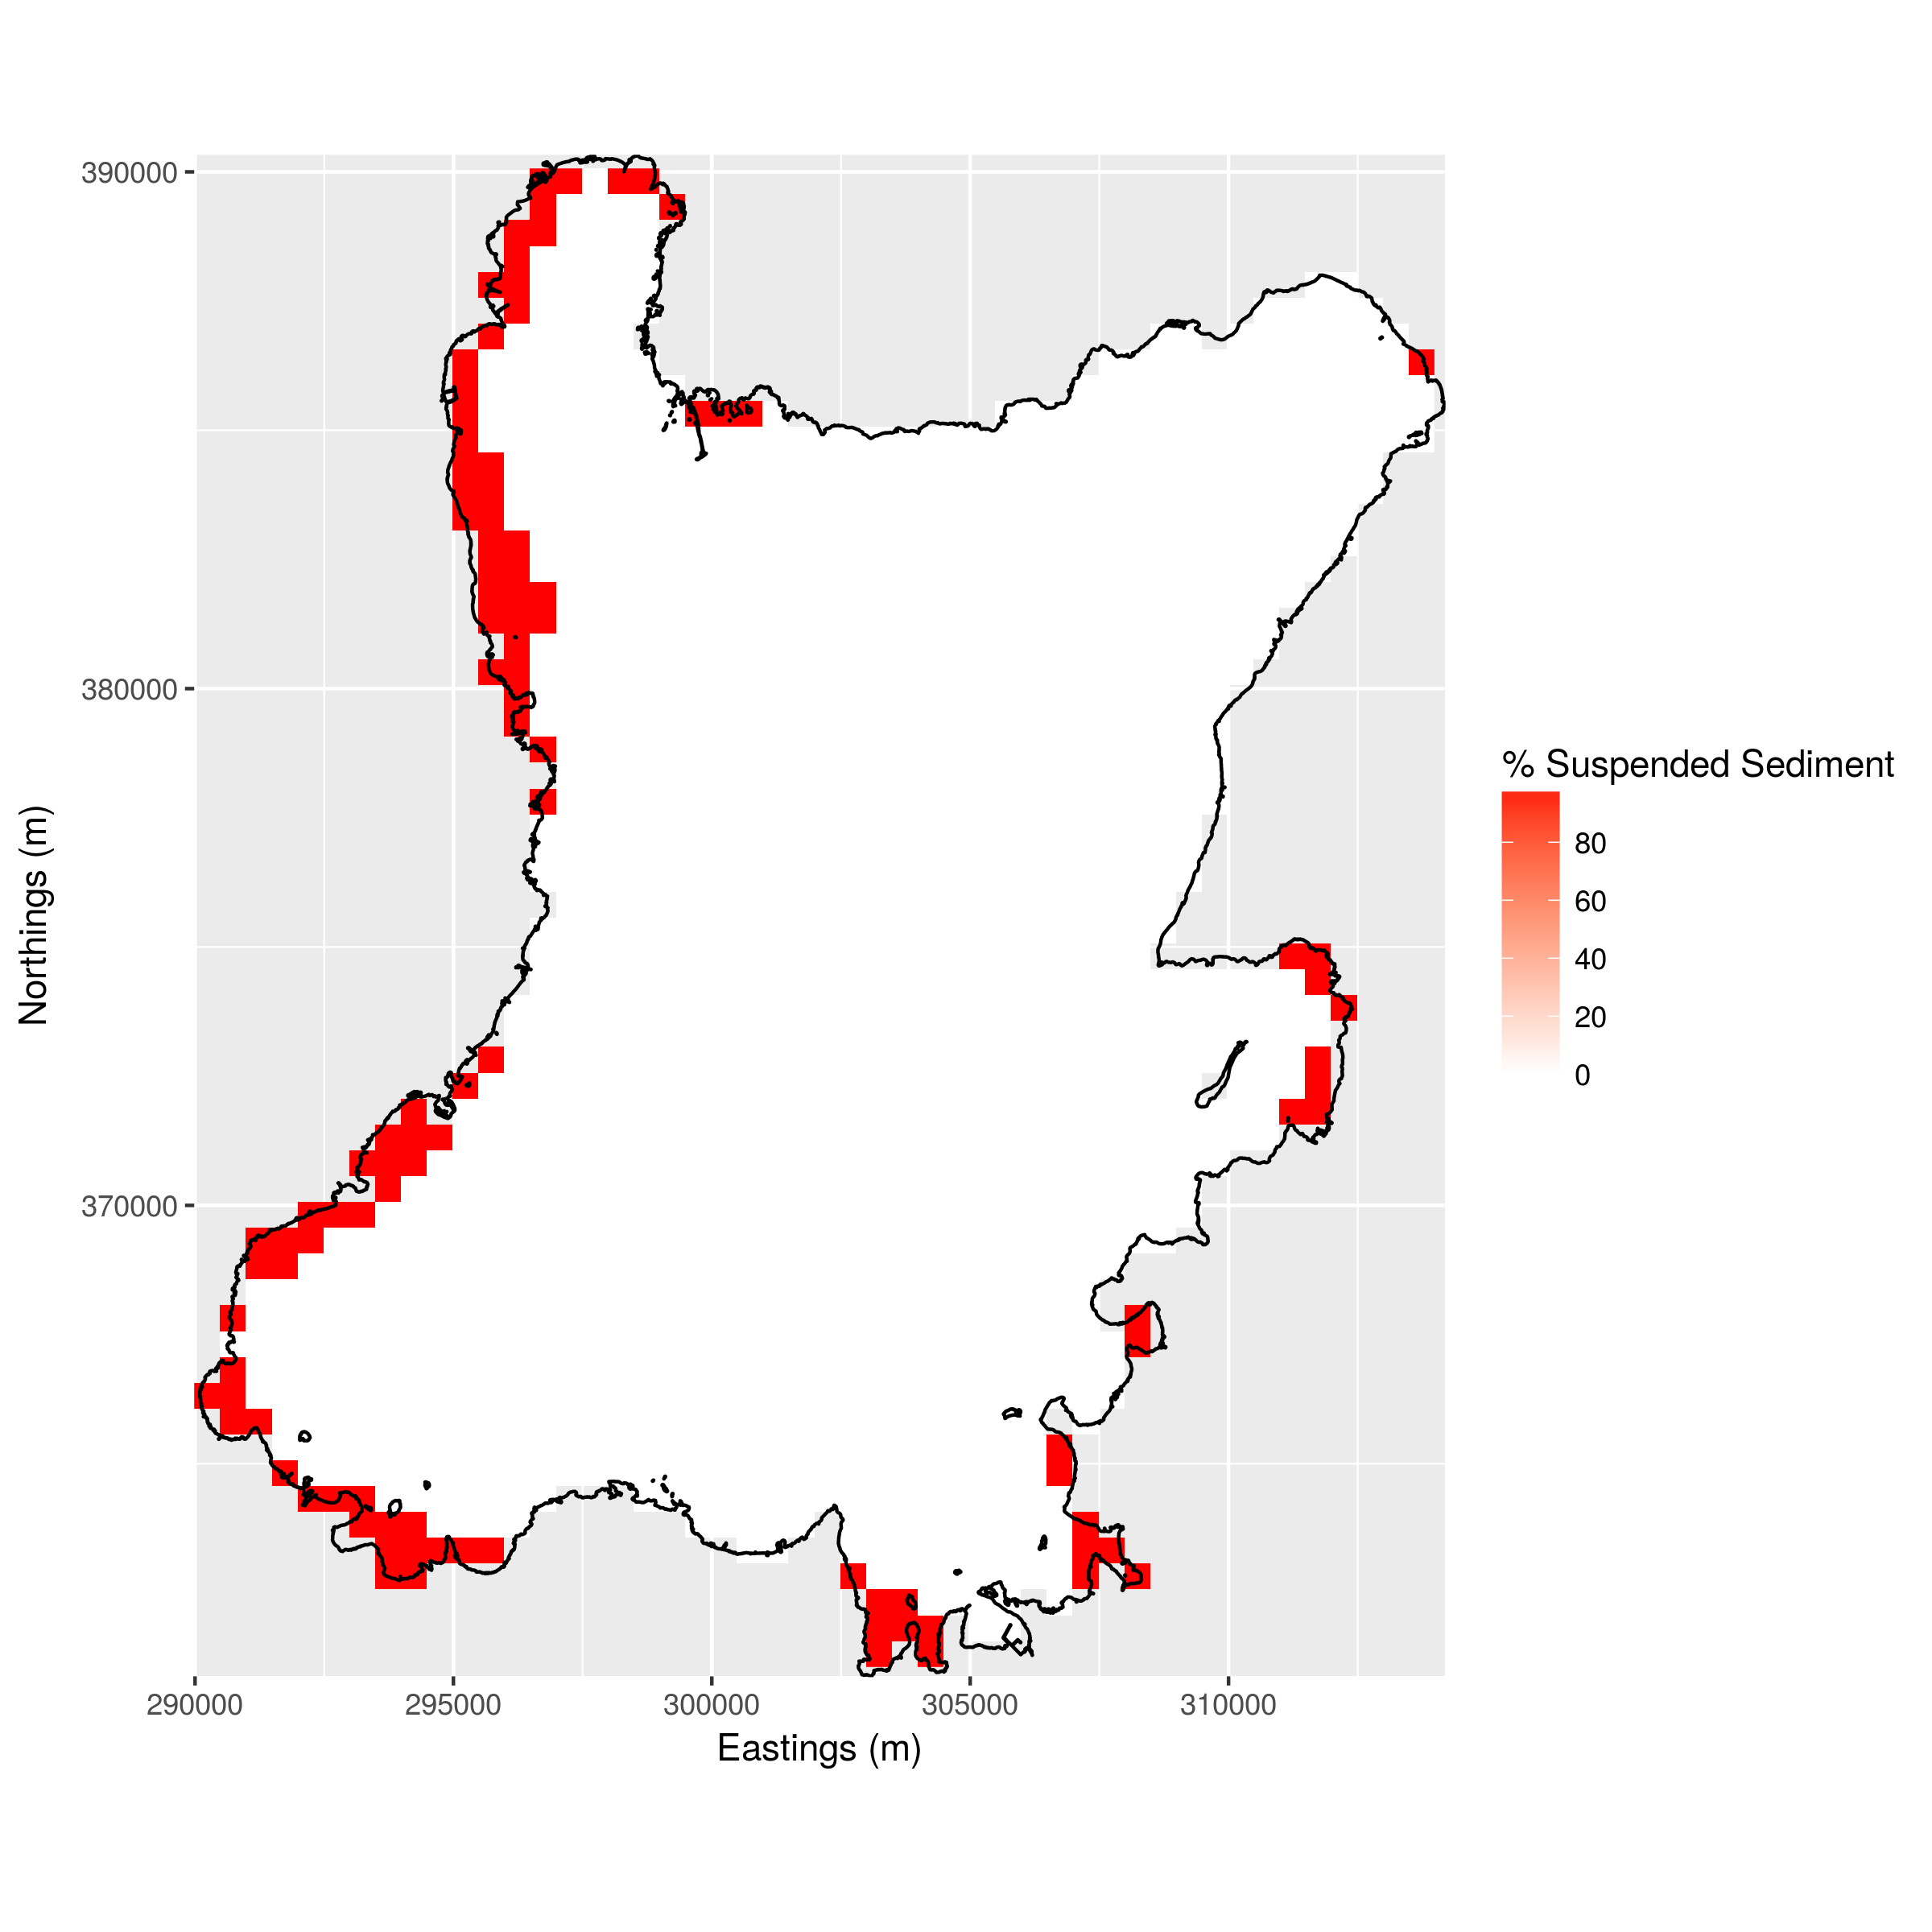
Fig. 7. Percentage of time that the entire water column experienced sediment suspension in 2015.
Suitable substrate
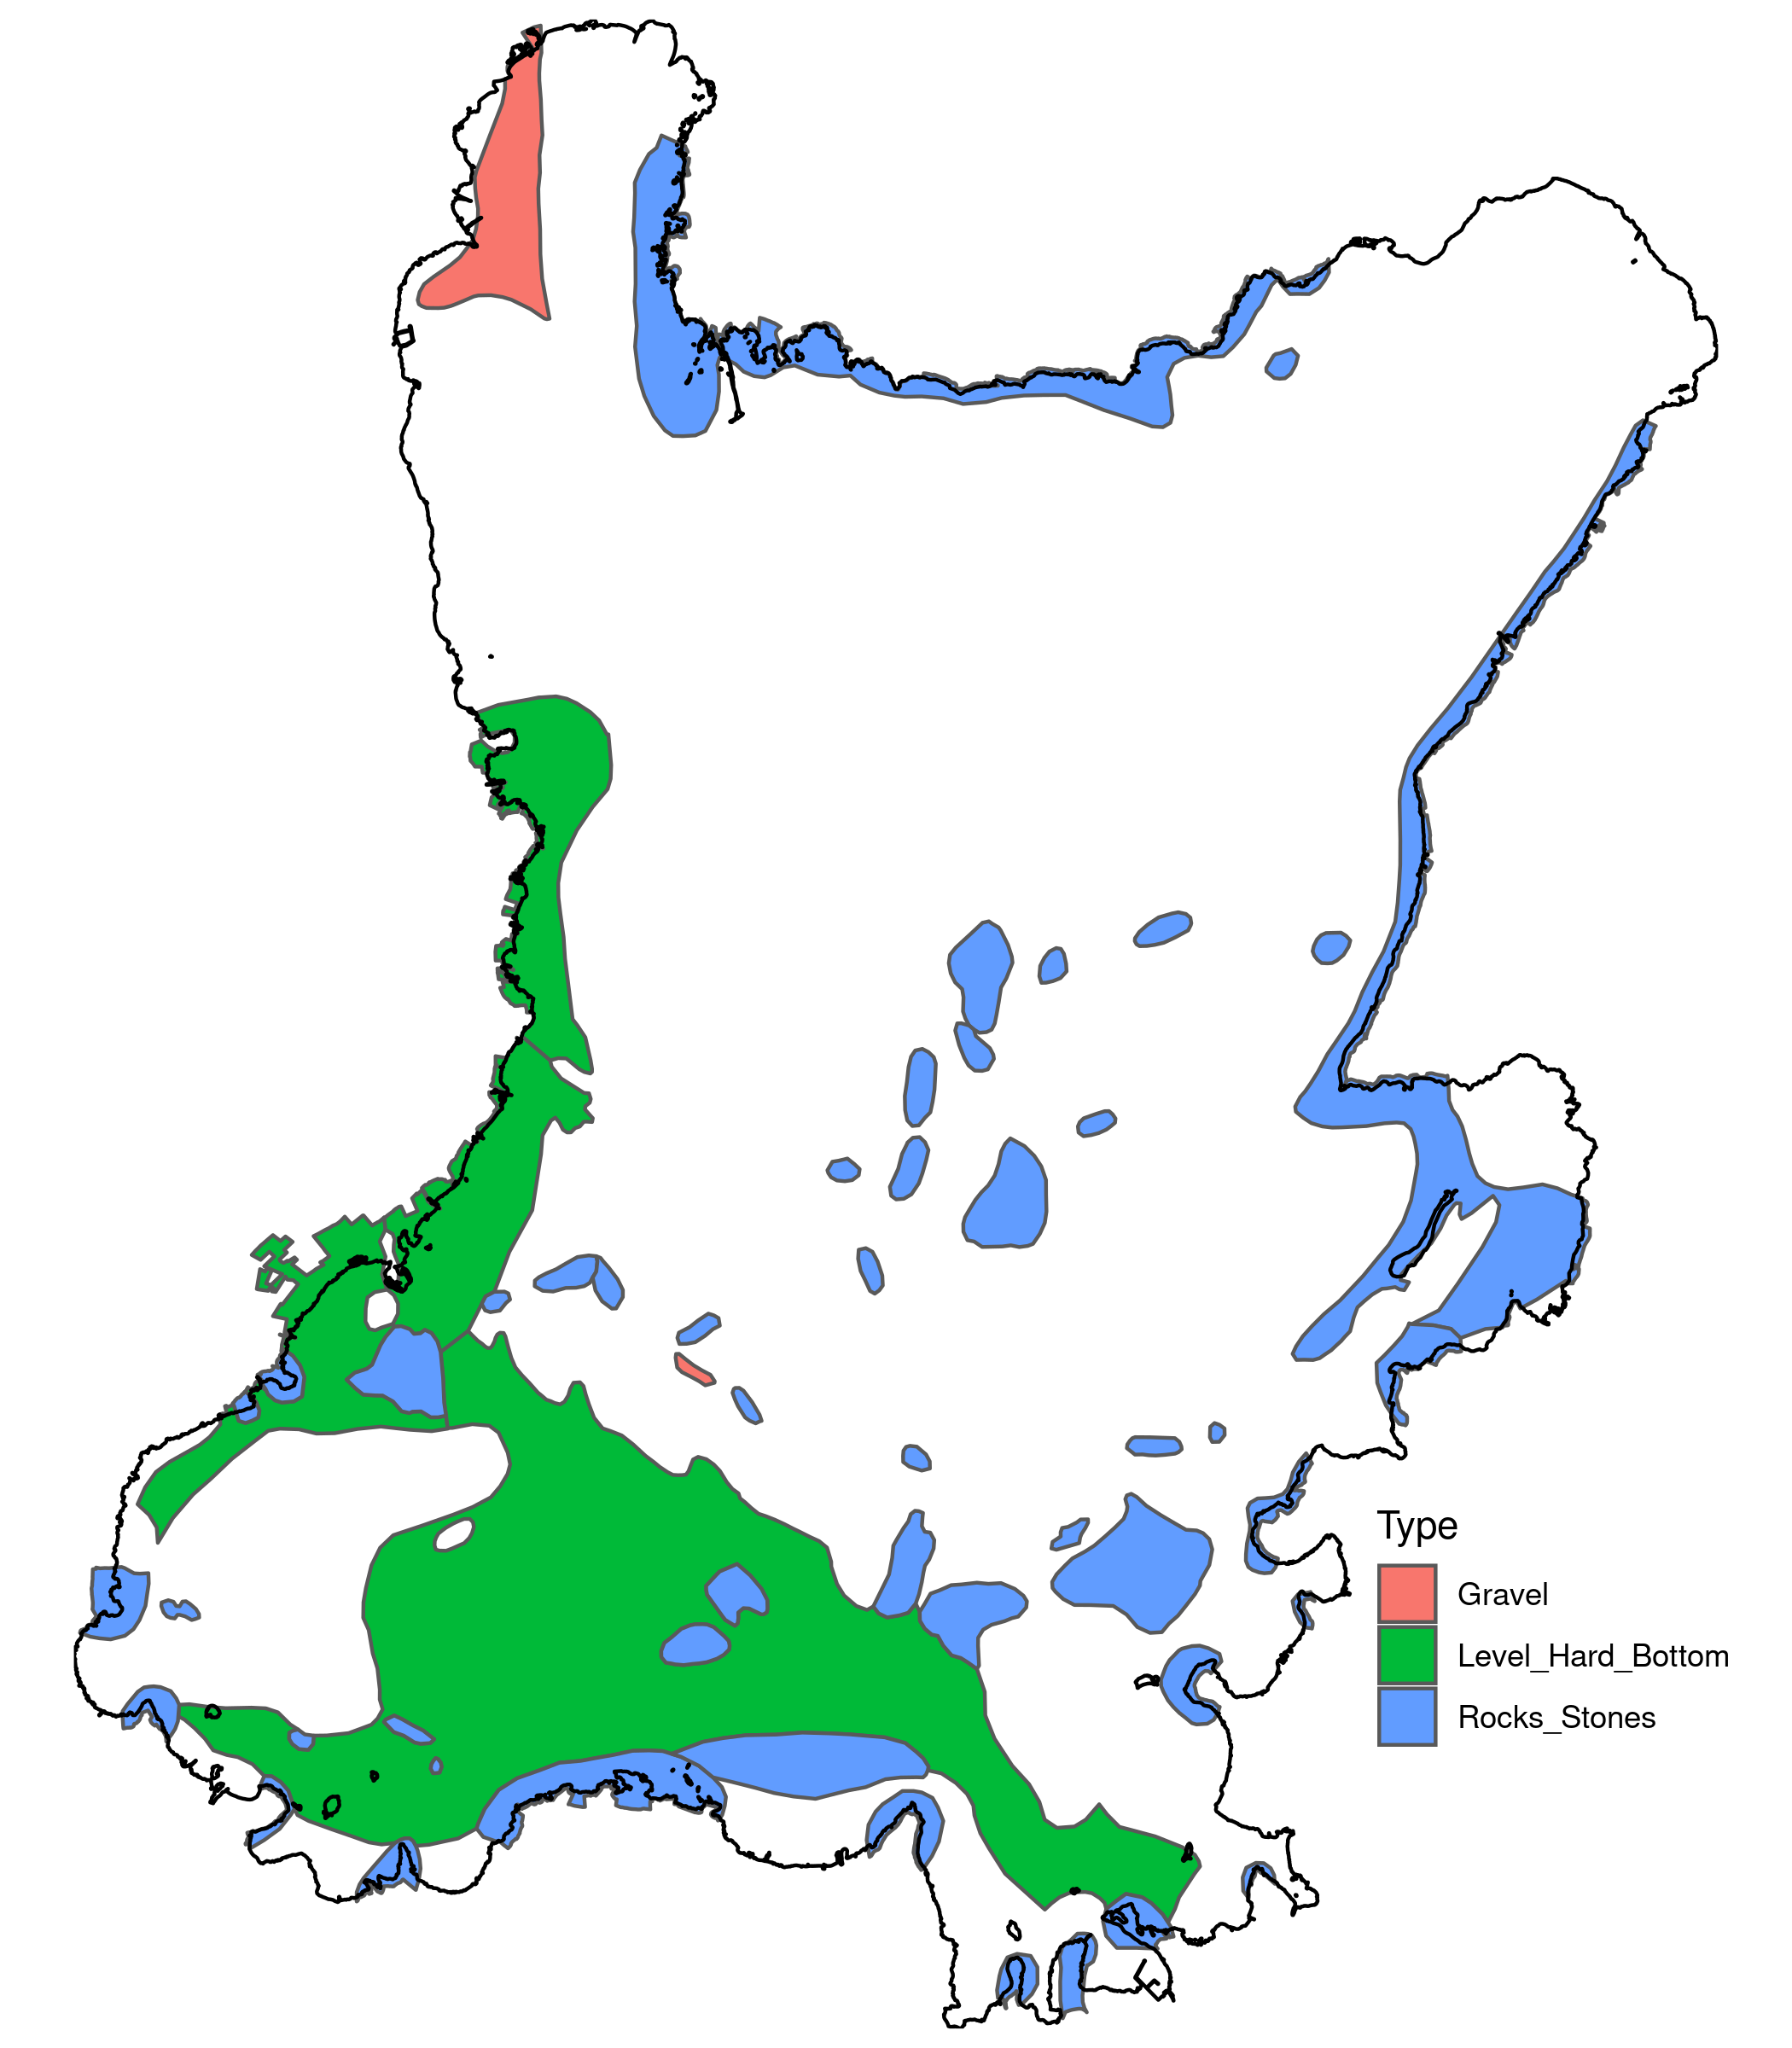
Fig. 8. Map of suitable substrate (gravel, hard bottom and rocks/stones) for D. polymorpha in Lough Neagh.
Depth and substrate type
Table 2 Depth and substrate type for each of the sampling location.
| Site name | Presence | Adult shells | Living | Larvae | Depth | Substrate type |
|---|---|---|---|---|---|---|
| Kinnego_Marina | Y | Y | Y | Y | NA | NA |
| Kinnego_Point (Discovery Centre) | Y | Y | Y | Y | 4.45 | Mud |
| Bayshore (Ardmore Rd.) | Y | N | Y | Y | NA | Sand |
| Maghery Country Park | N | N | N | N | NA | Rocks_Stones |
| Brocagh | Y | N | N | Y | 0.00 | Sand |
| Kinturk_Point (Curran Quay) | Y | N | N | Y | NA | Level_Hard_Bottom |
| Ballyronan_Marina_Point | Y | Y | N | N | 0.00 | Sand |
| Toomebridge | Y | N | Y | N | NA | NA |
| Cranfield Rd. | Y | N | Y | N | 2.05 | Rocks_Stones |
| Antrim_Shore_Park | Y | Y | N | Y | NA | NA |
| Northstone_Materials | N | N | N | N | NA | NA |
| Fisherman’s_Quay | Y | N | Y | Y | NA | Rocks_Stones |
| Bartins_Bay | N | N | N | N | 2.56 | Sand |
Relationship between DWML and sedimentation rate
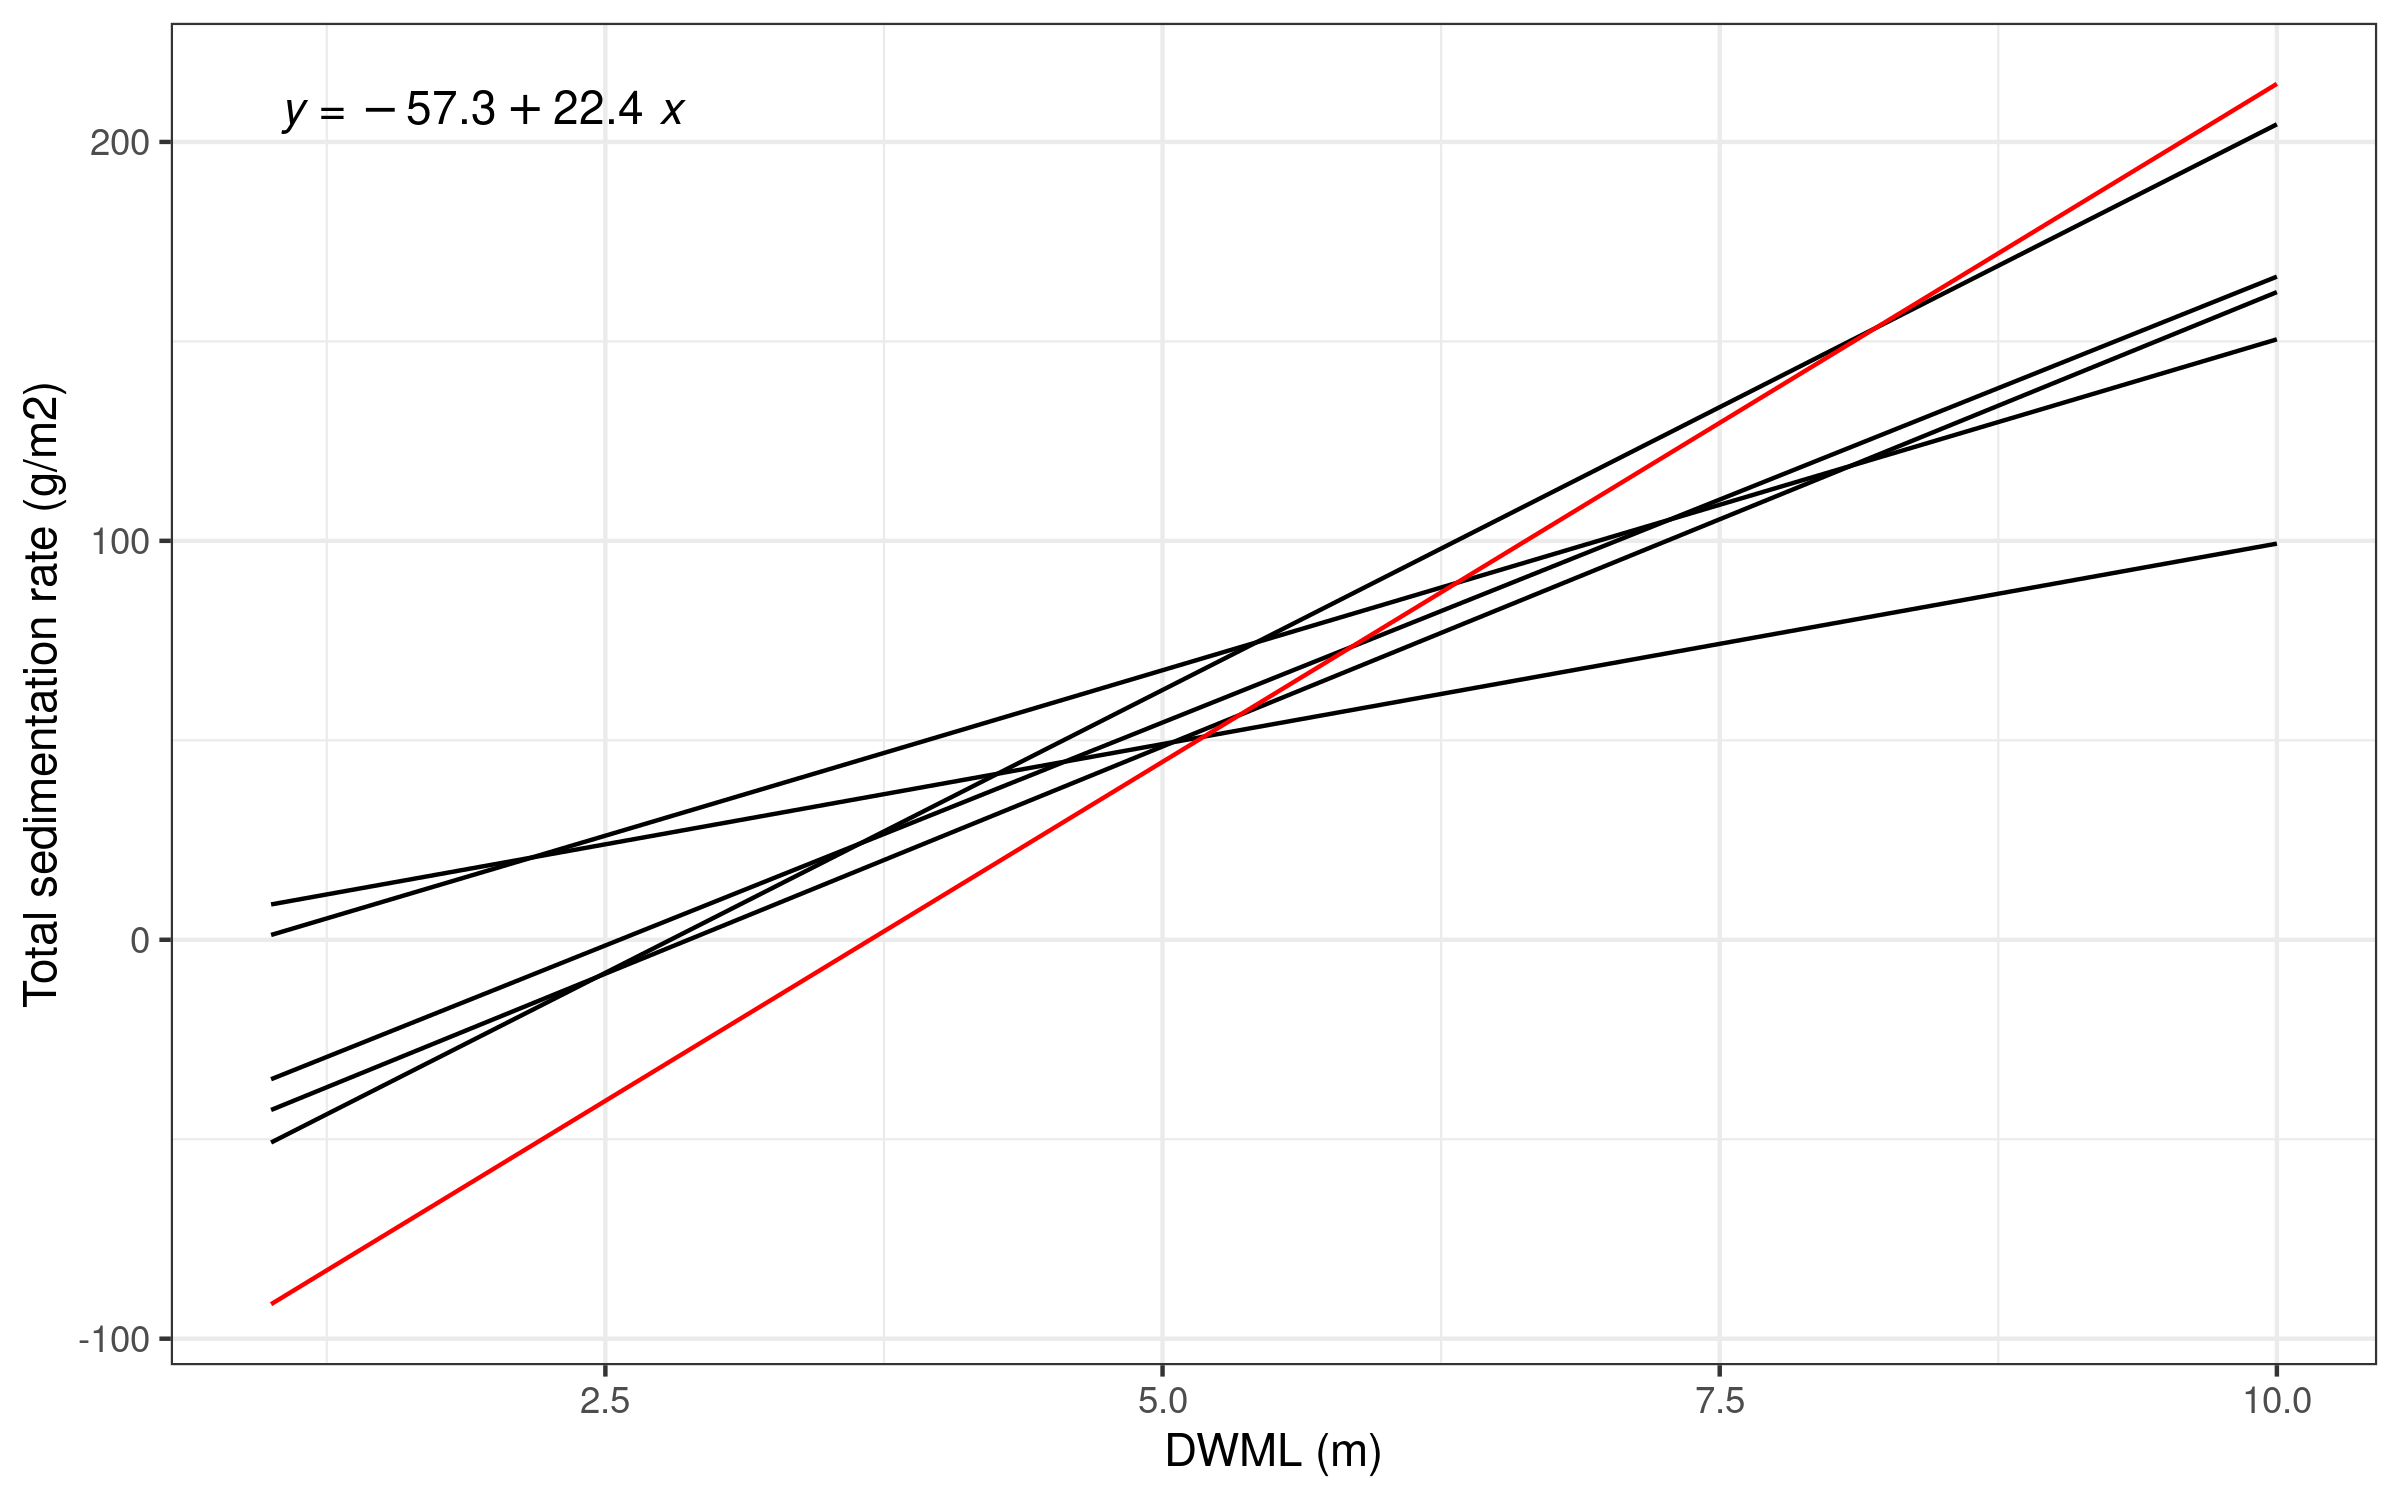
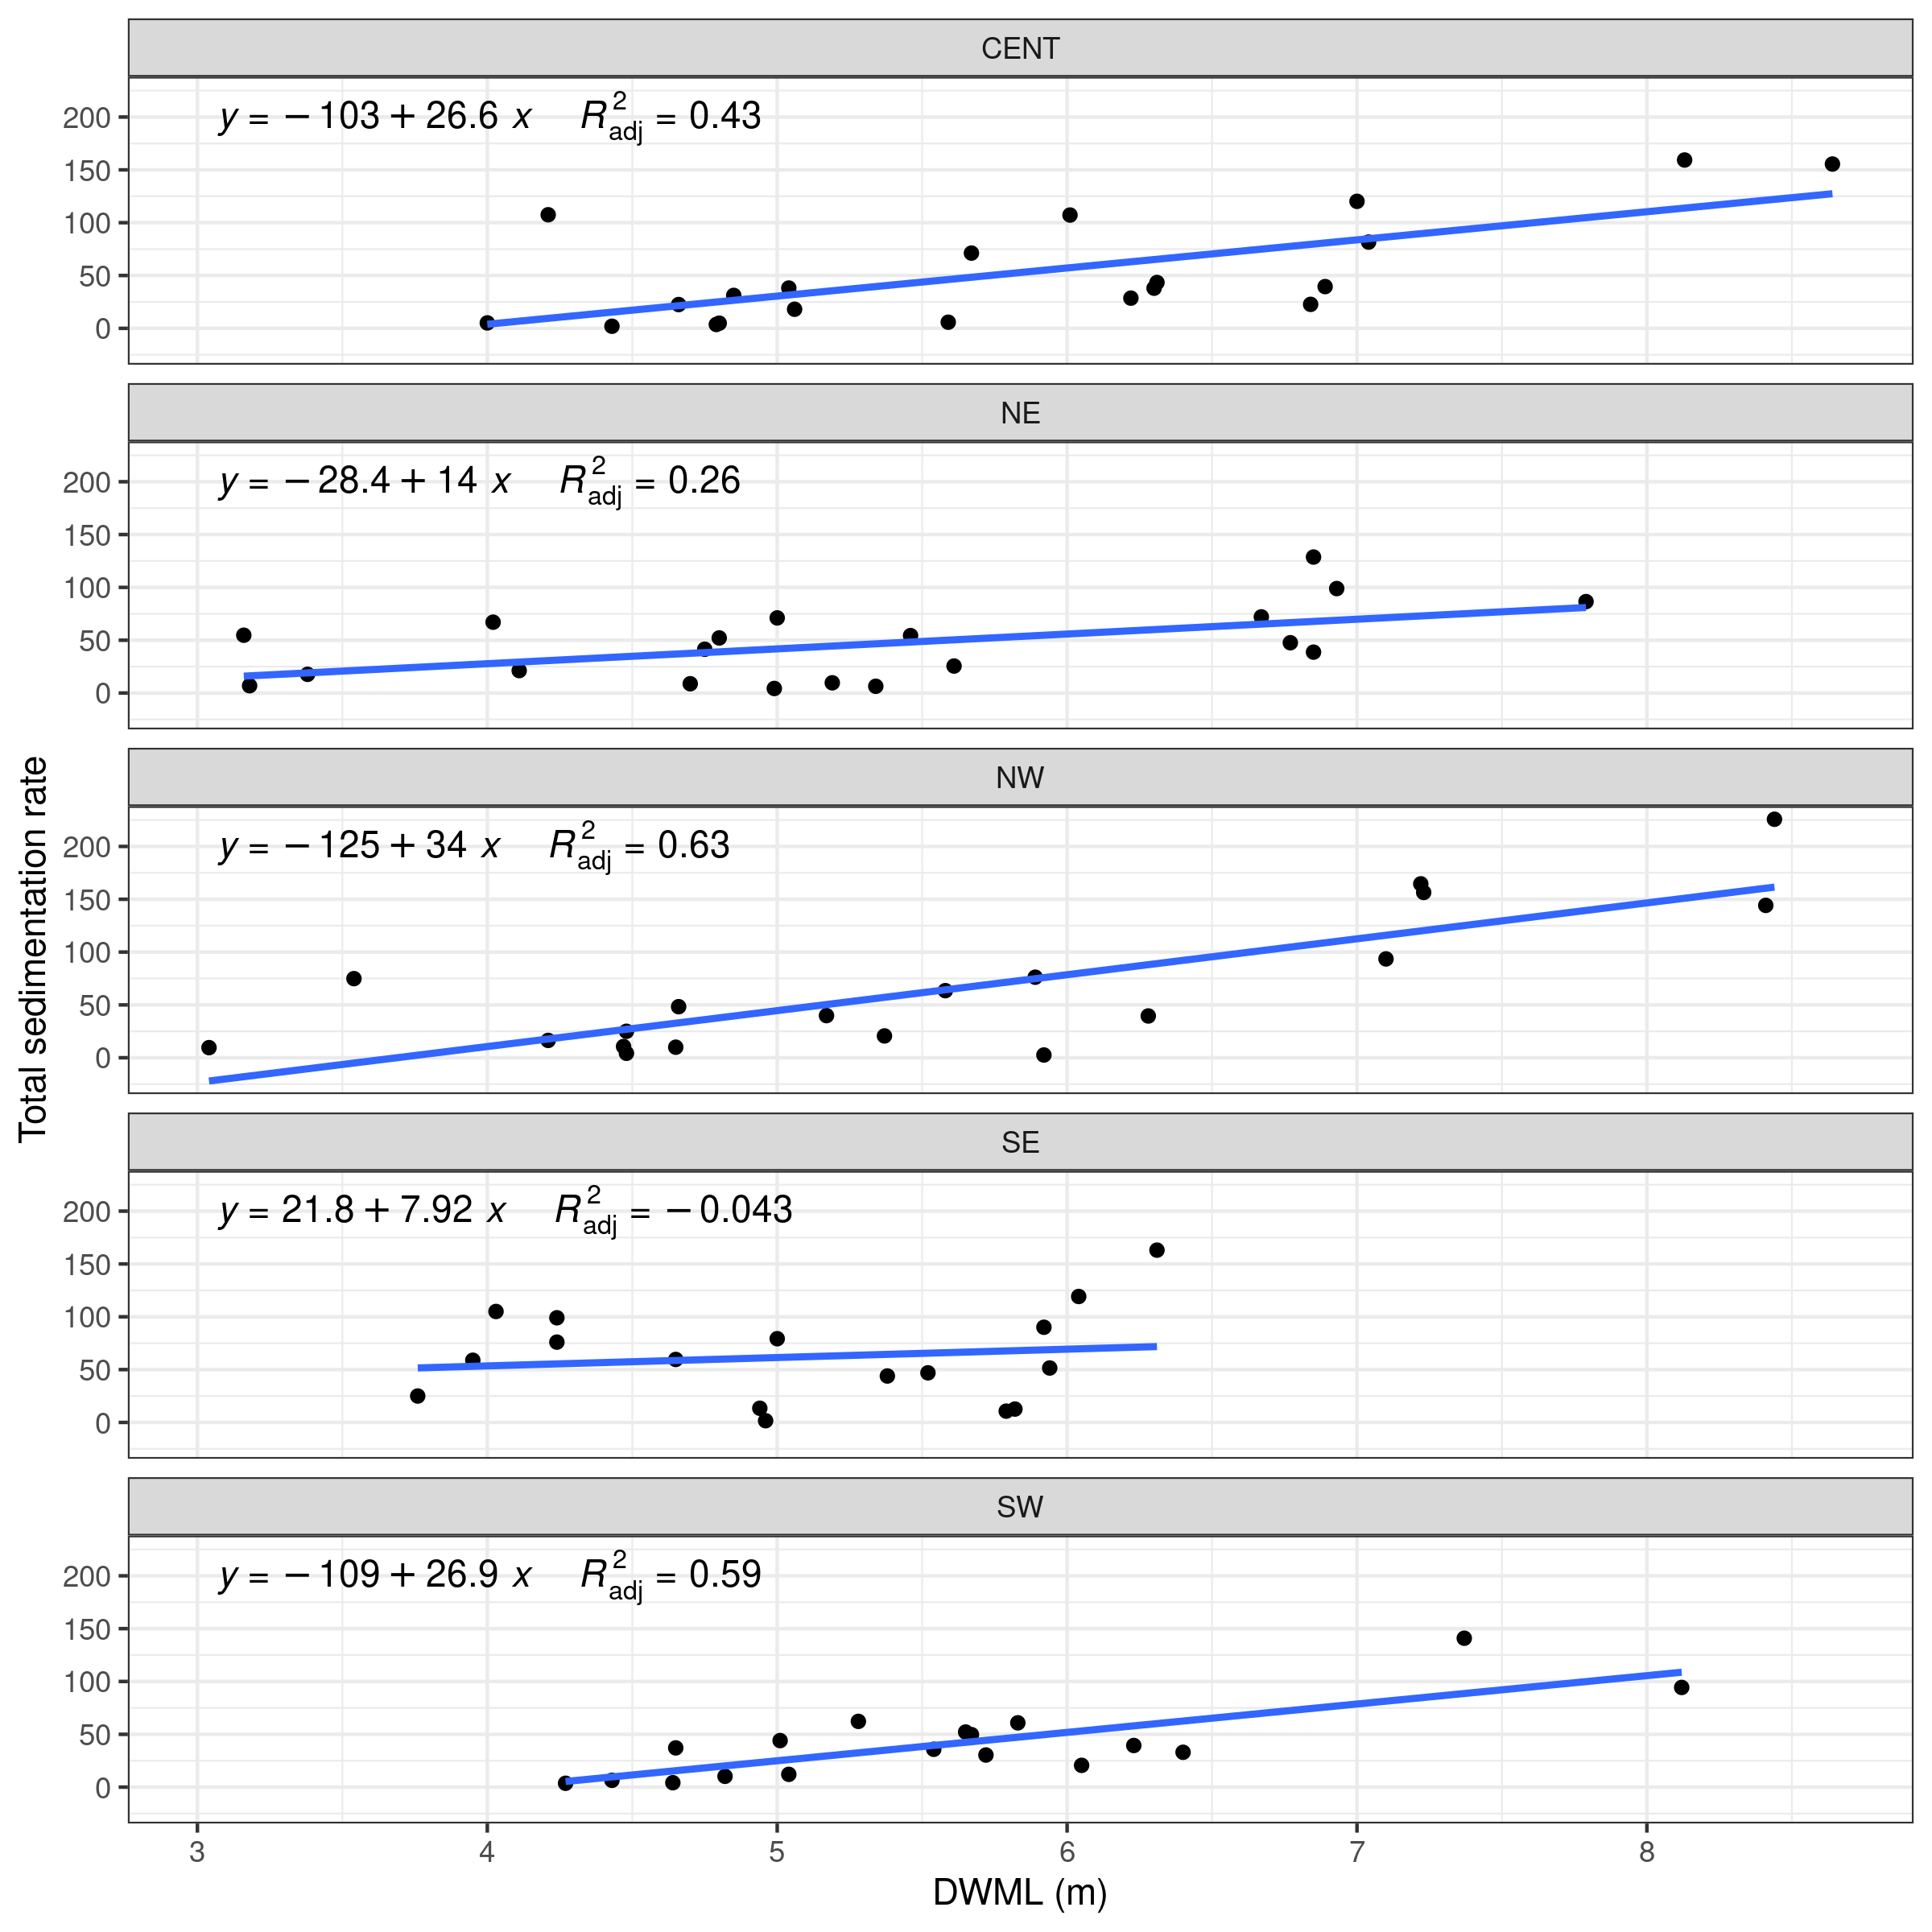
Fig. 9. Relationship between water mixed layer depth (DWML) and total sedimentation rate. Black lines show the different linear models extracted from Douglas & Rippey 2000, red line shows the mean of the 5 different linear models.
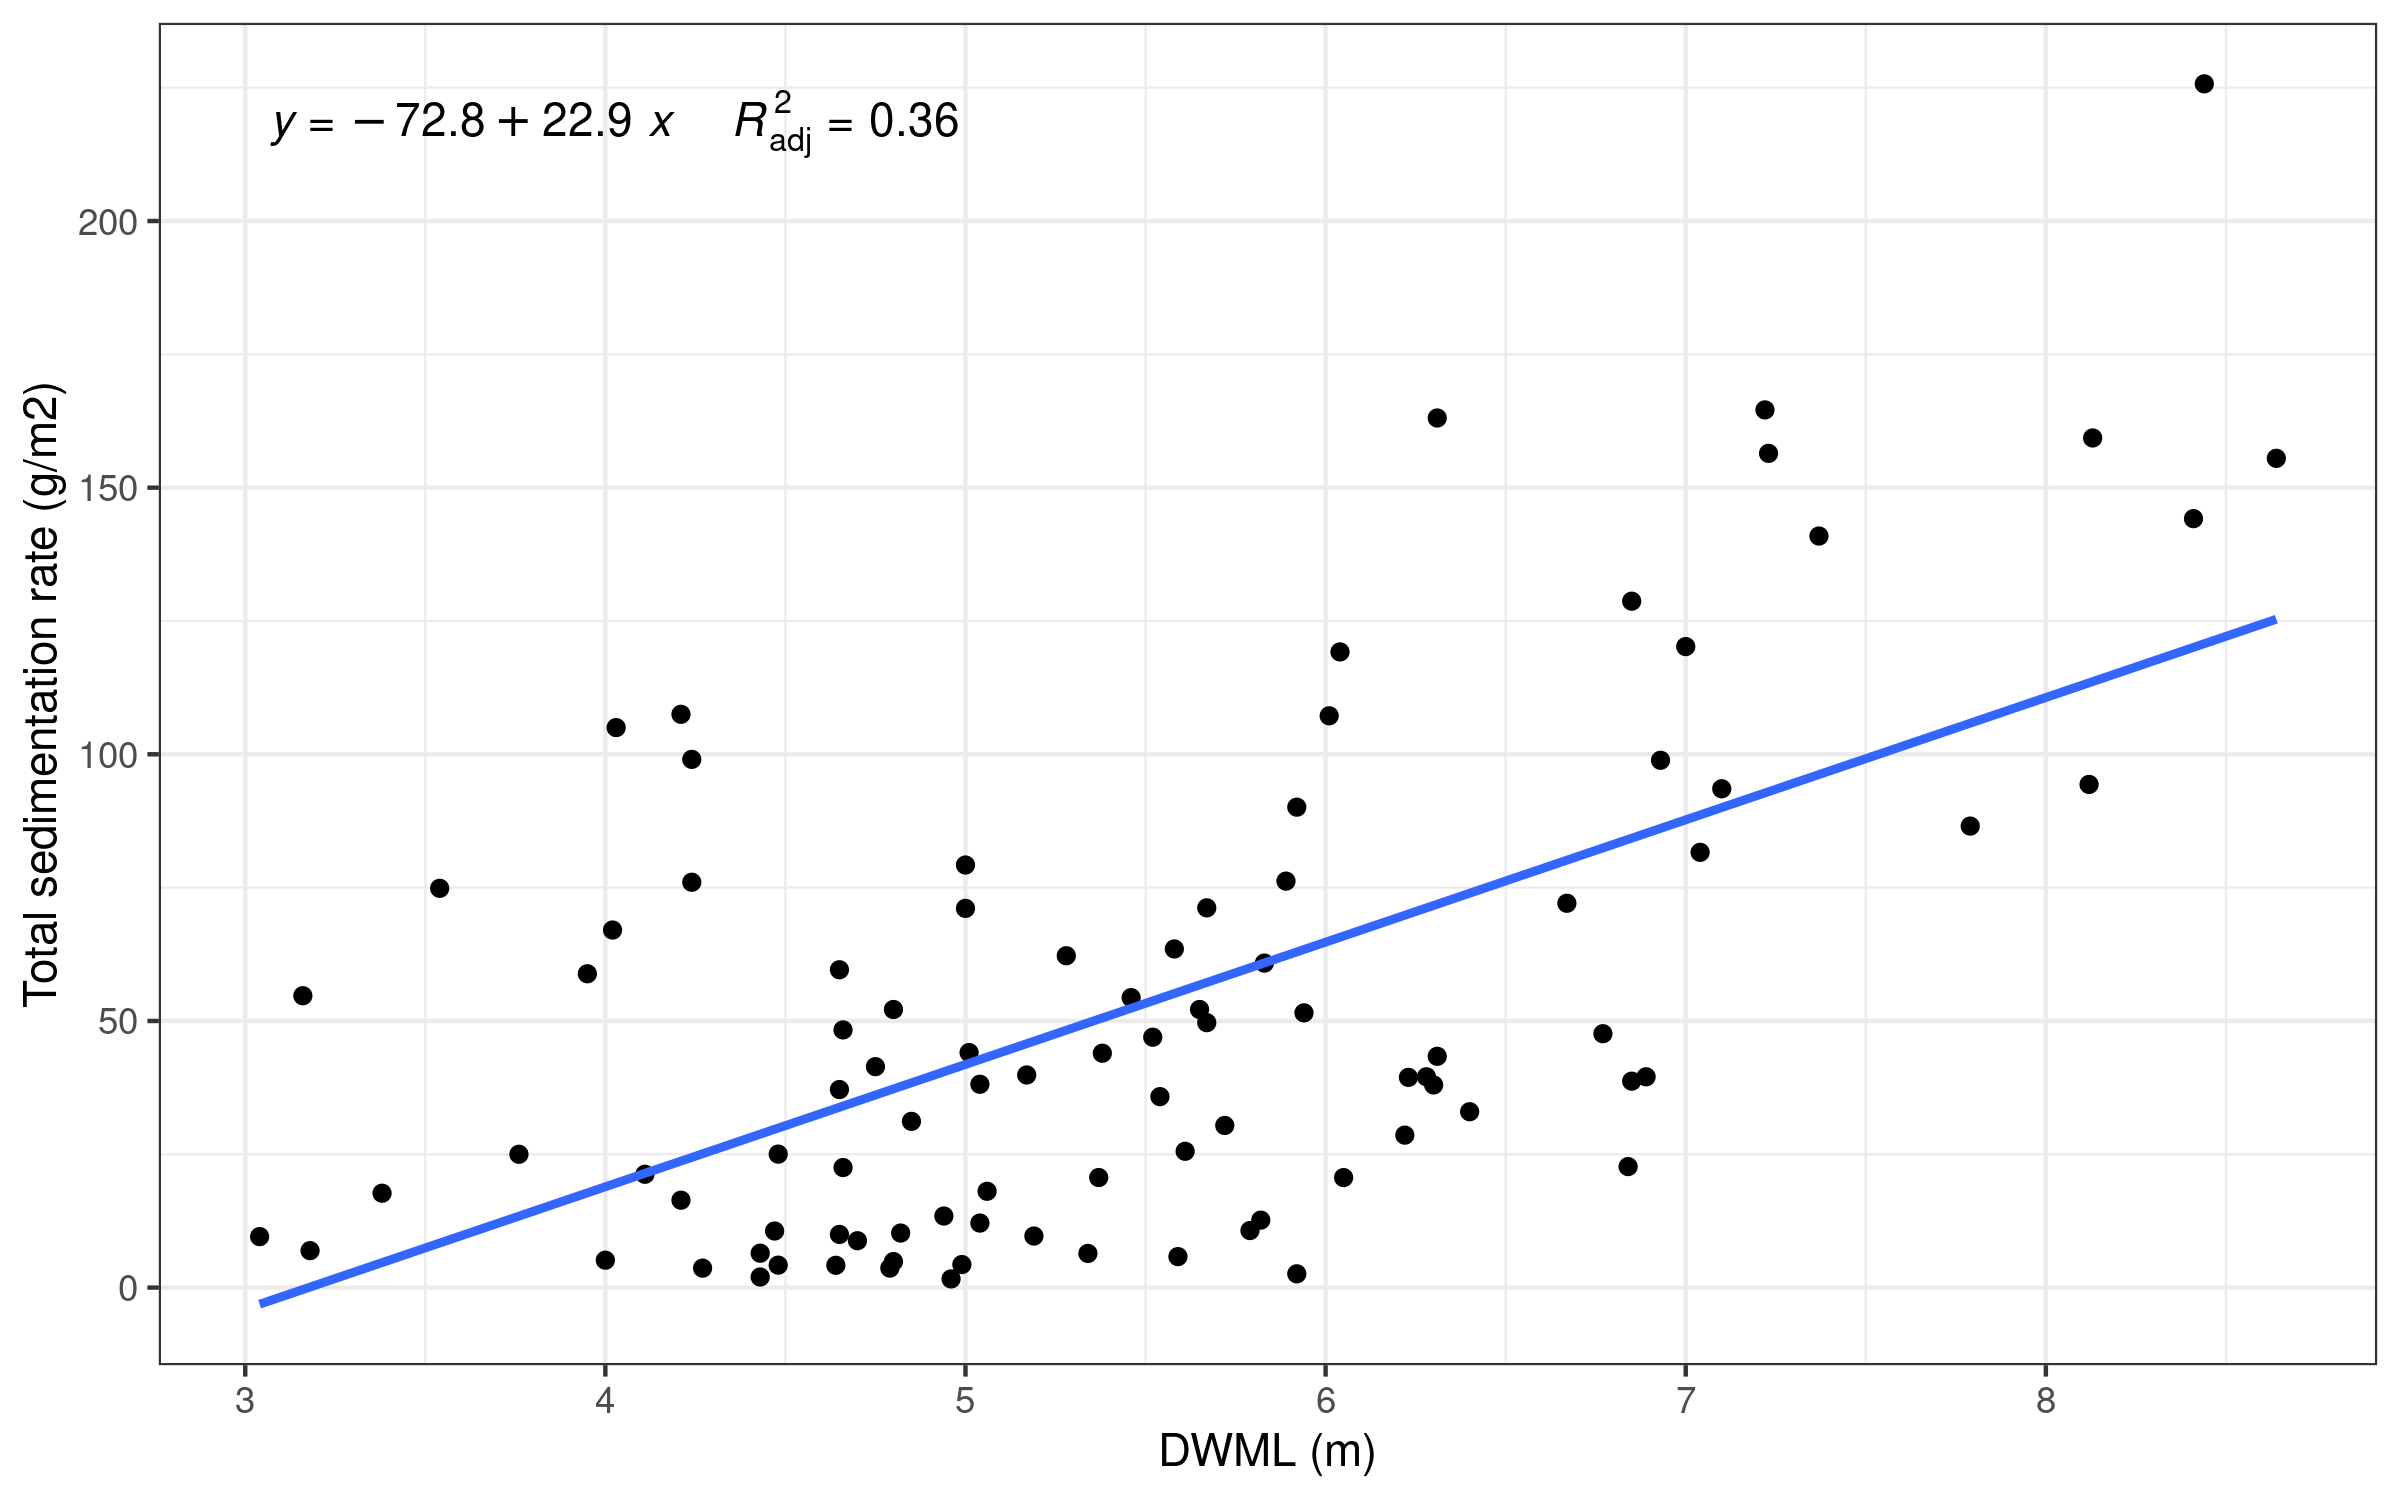 Fig. 10. Original relationship
between water mixed layer depth (DWML) and total sedimentation rate
according to Douglas & Rippey 2000.
Sedimentation rate
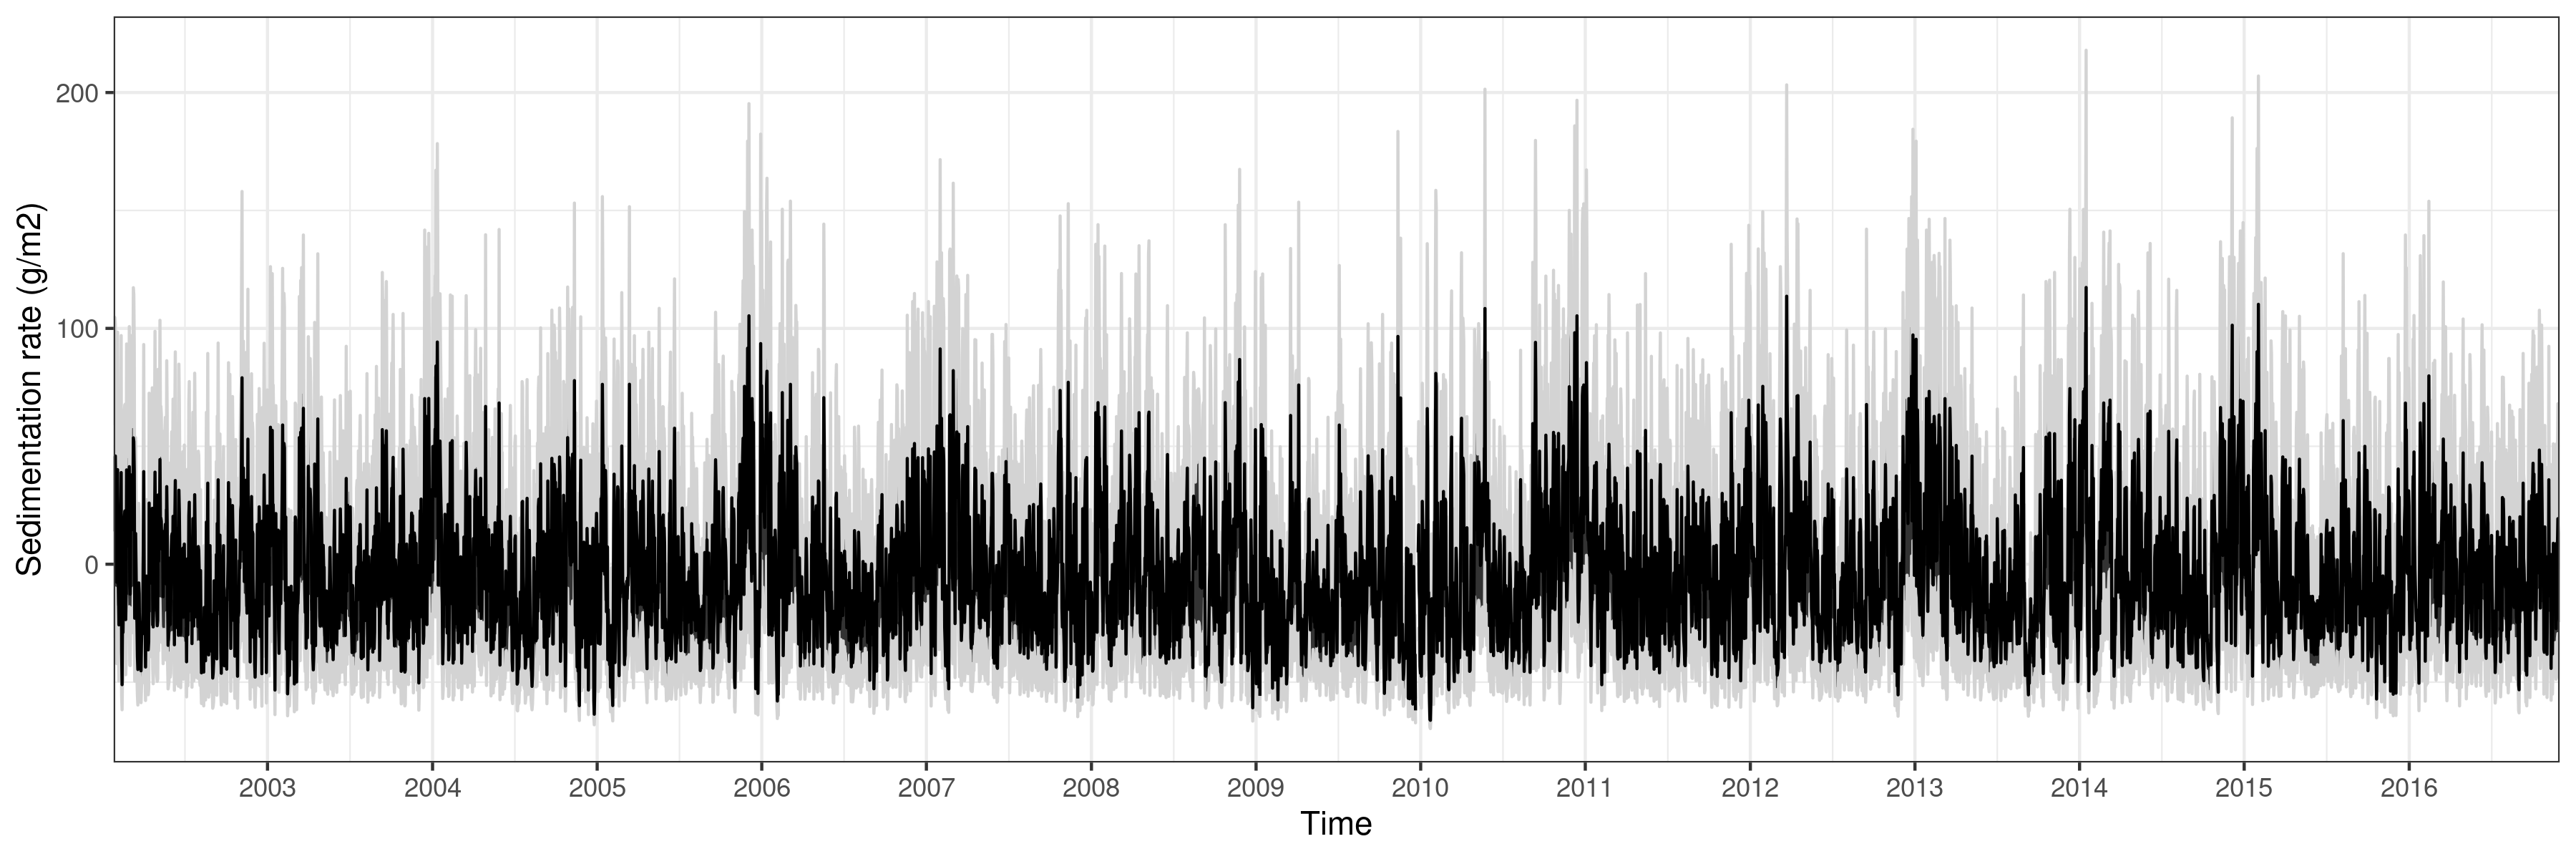
Fig. 11. Mean sedimentation rate (g/m2) (± SD) over time (2003 - 2017).
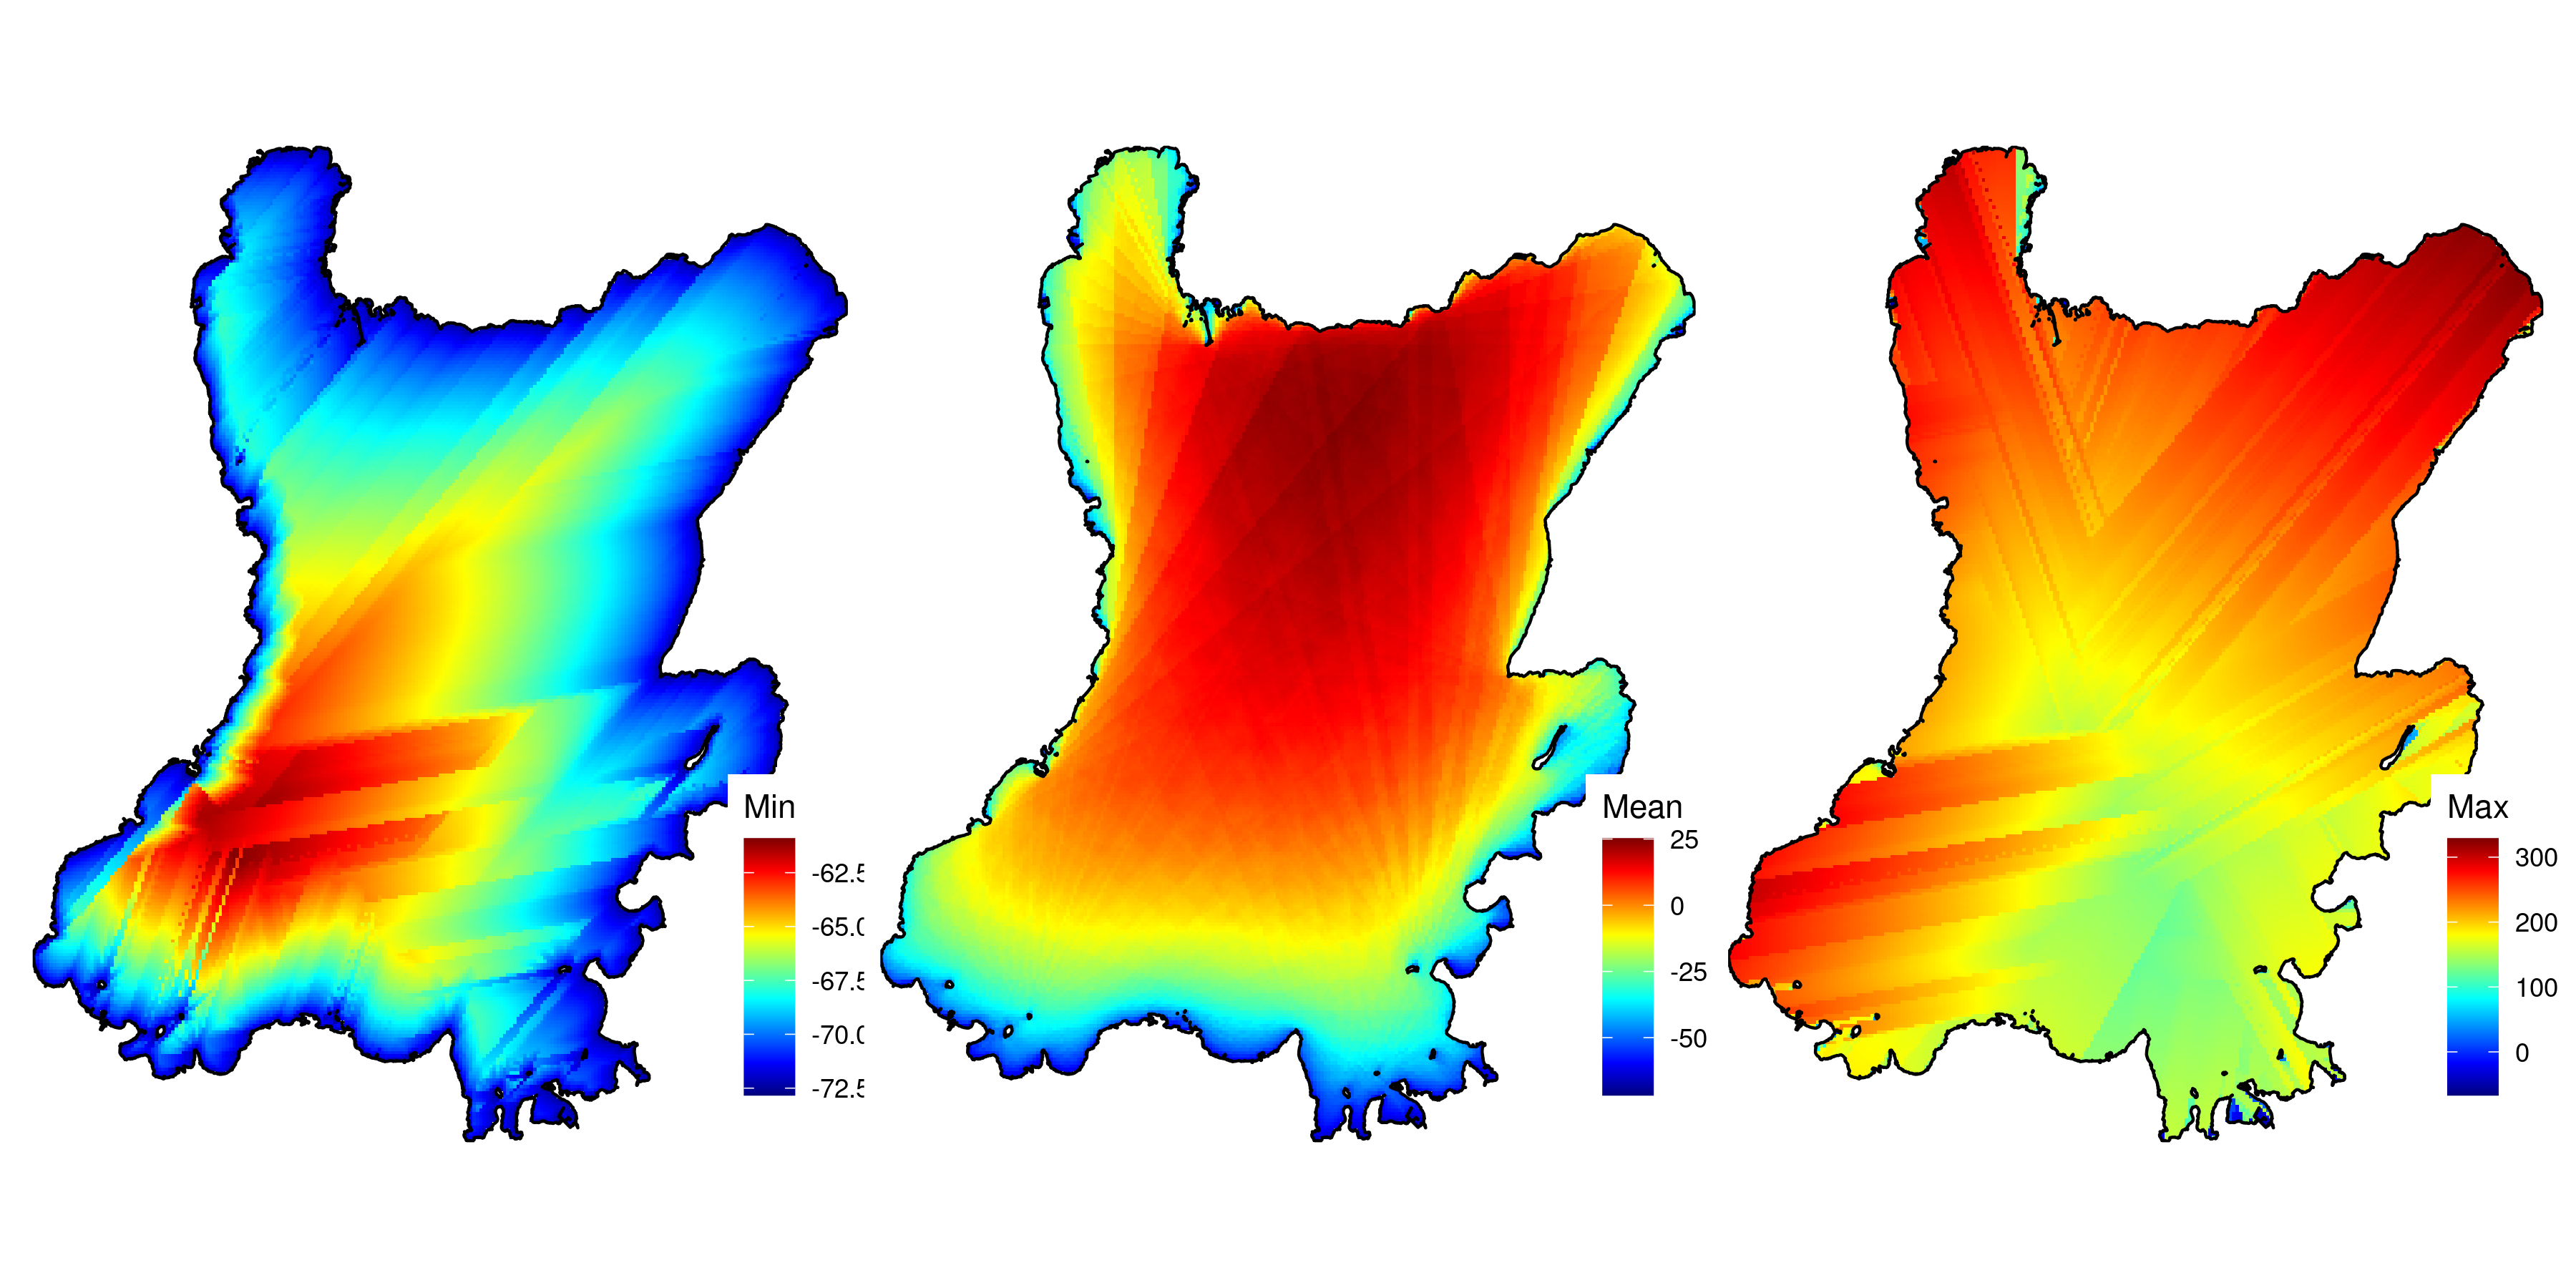 Fig. 12. Map of minimum, mean and
maximum sedimentation rate (g/m2) of all years (2003 - 2017).
Total sedimentation (mg/l)
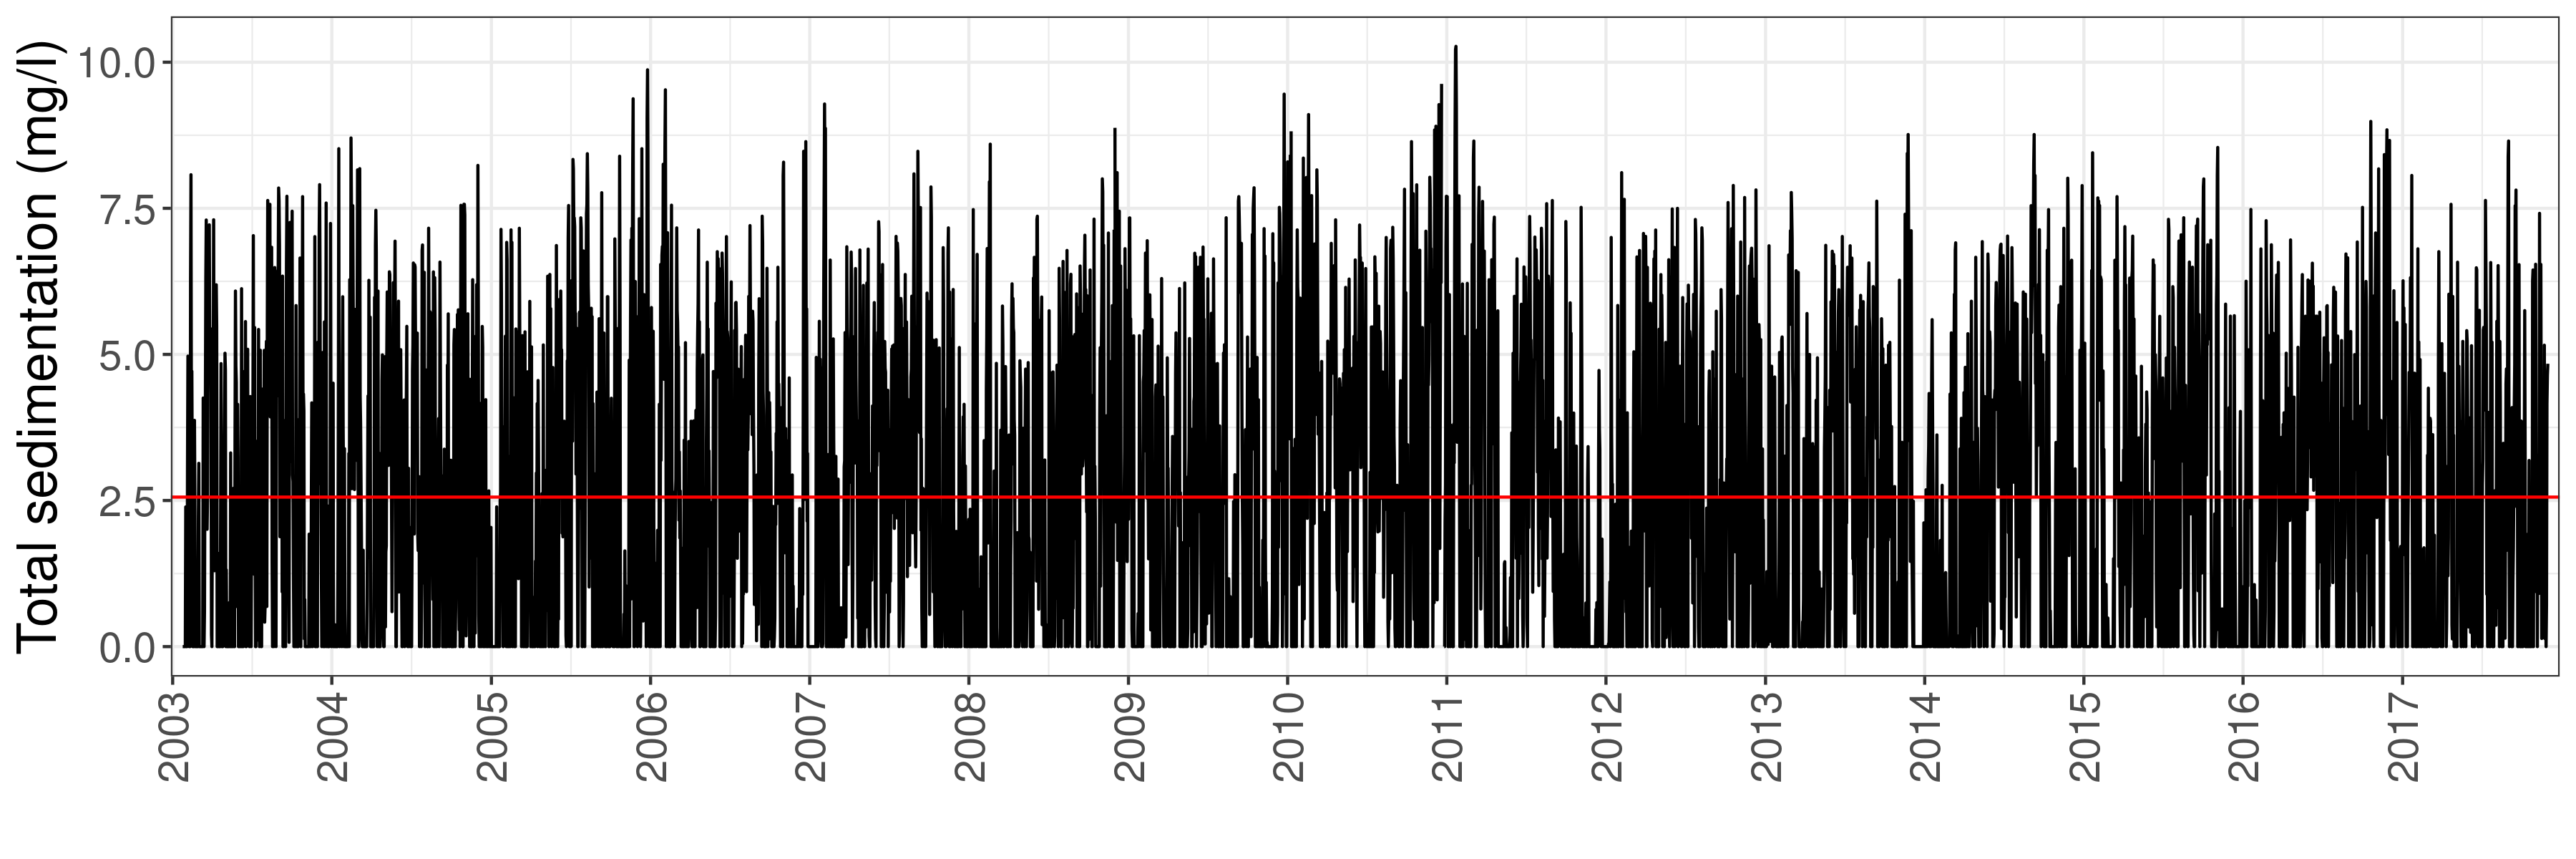
Fig. 13. Mean total sedimentation (mg/l) over time (2003 - 2017).
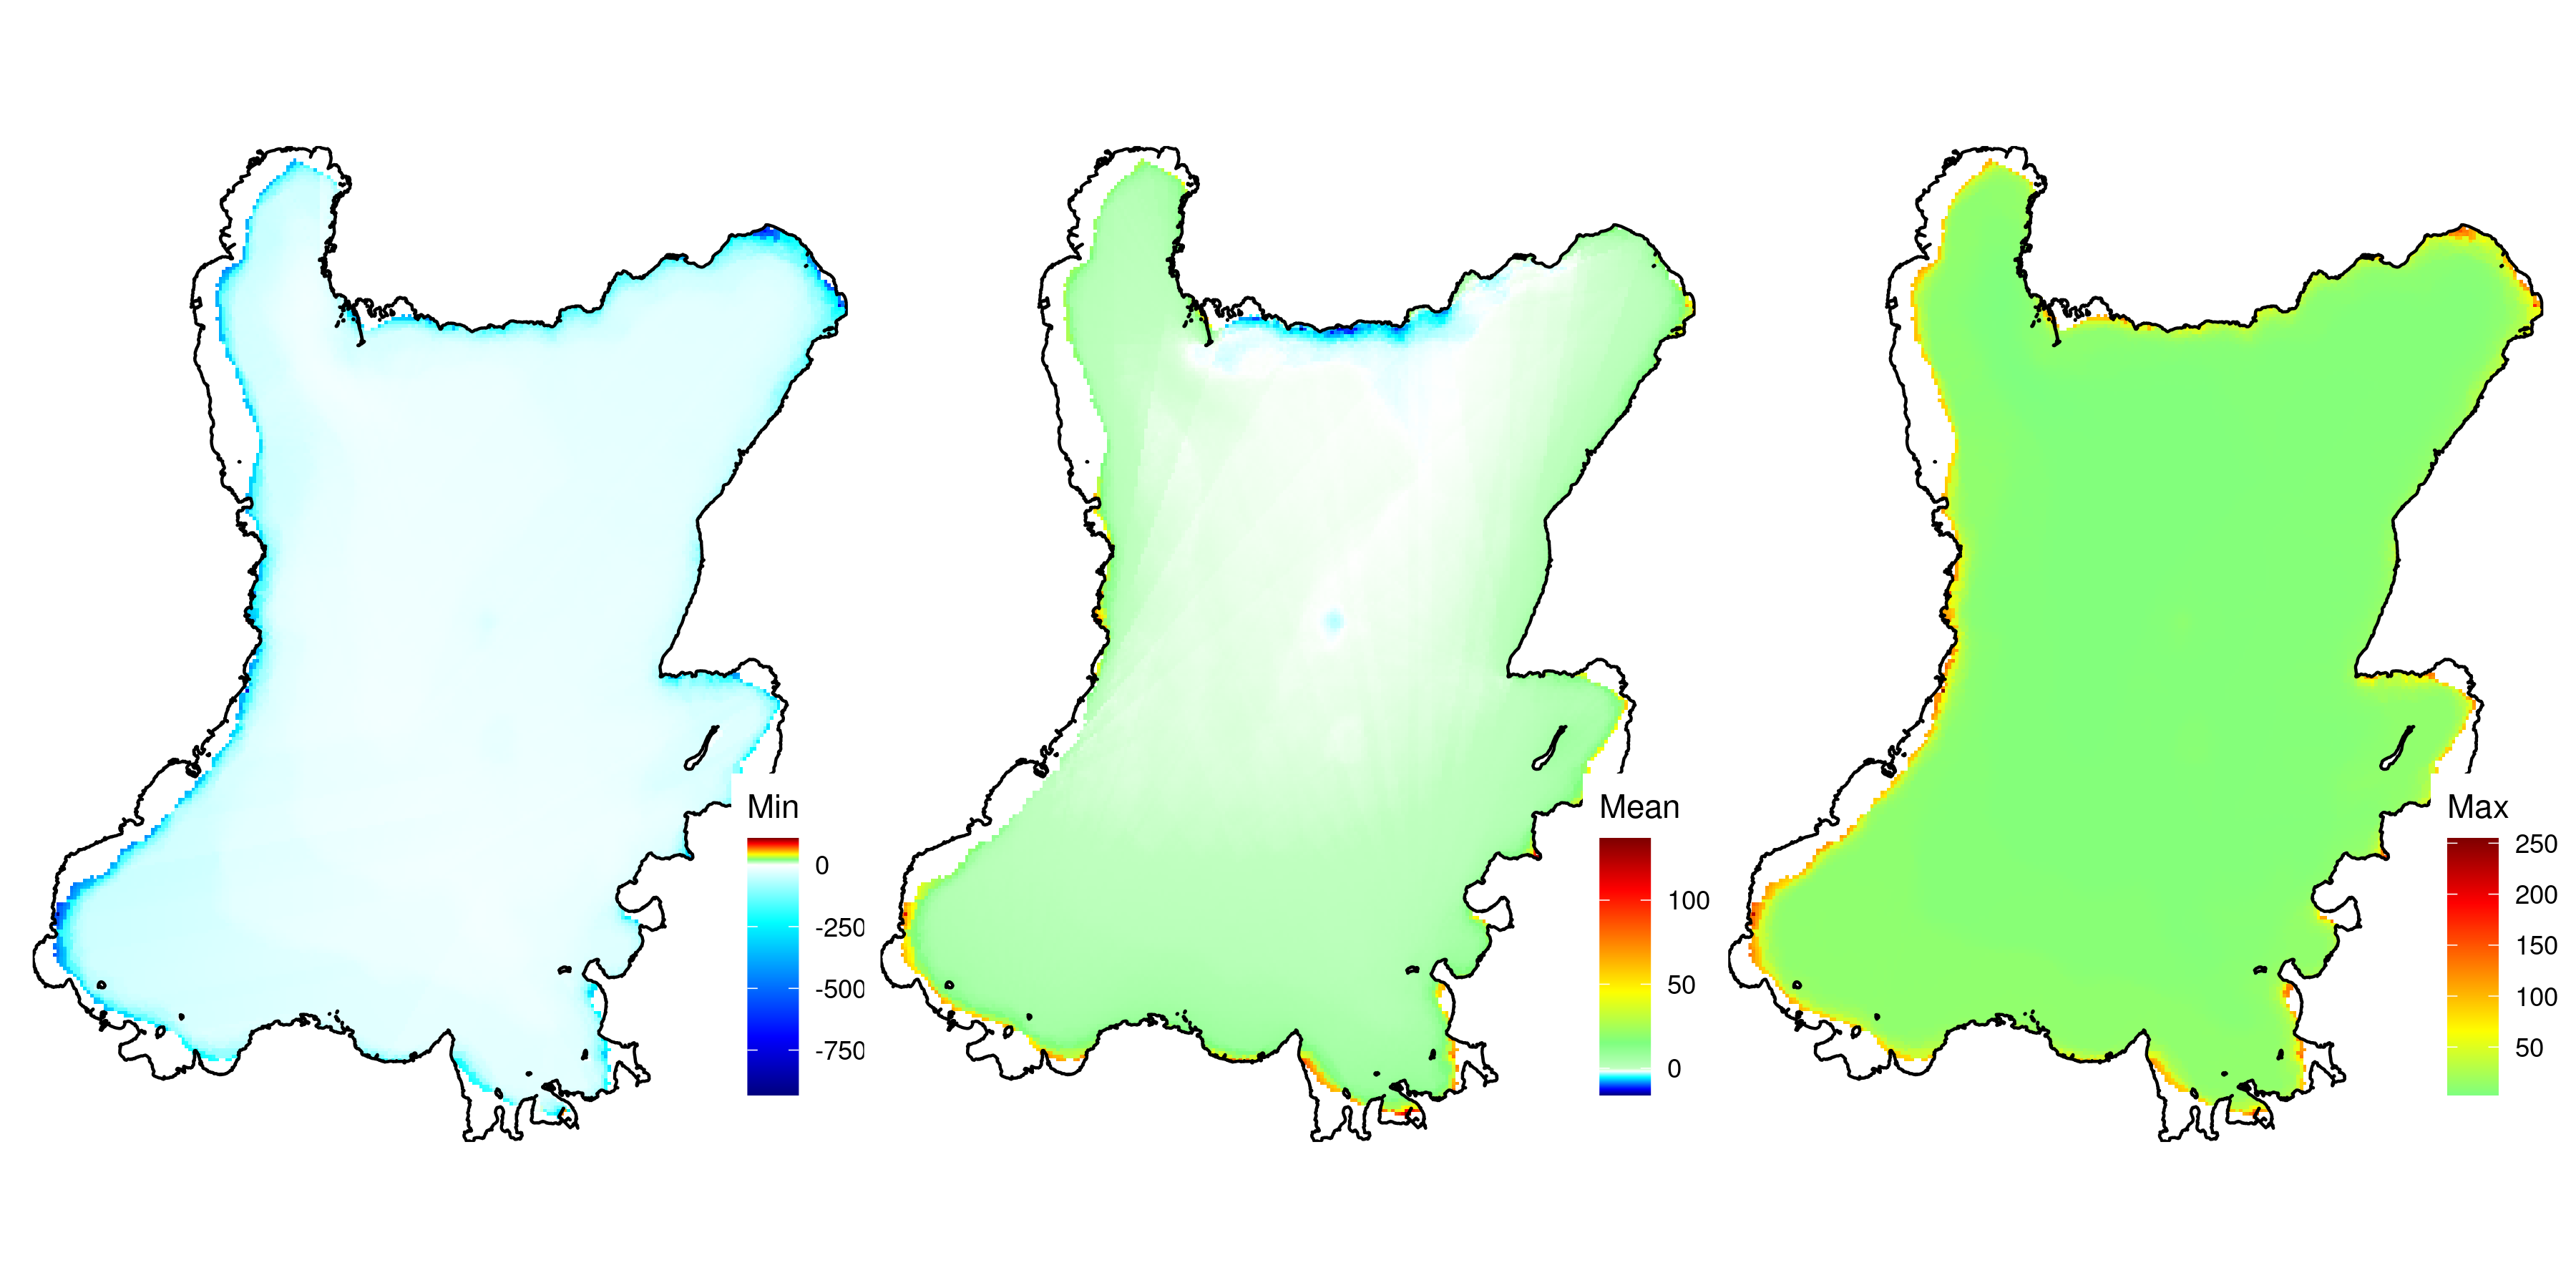 Fig. 14. Map of minimum, mean and
maximum total sedimentation (mg/l) of all years (2003 - 2017).
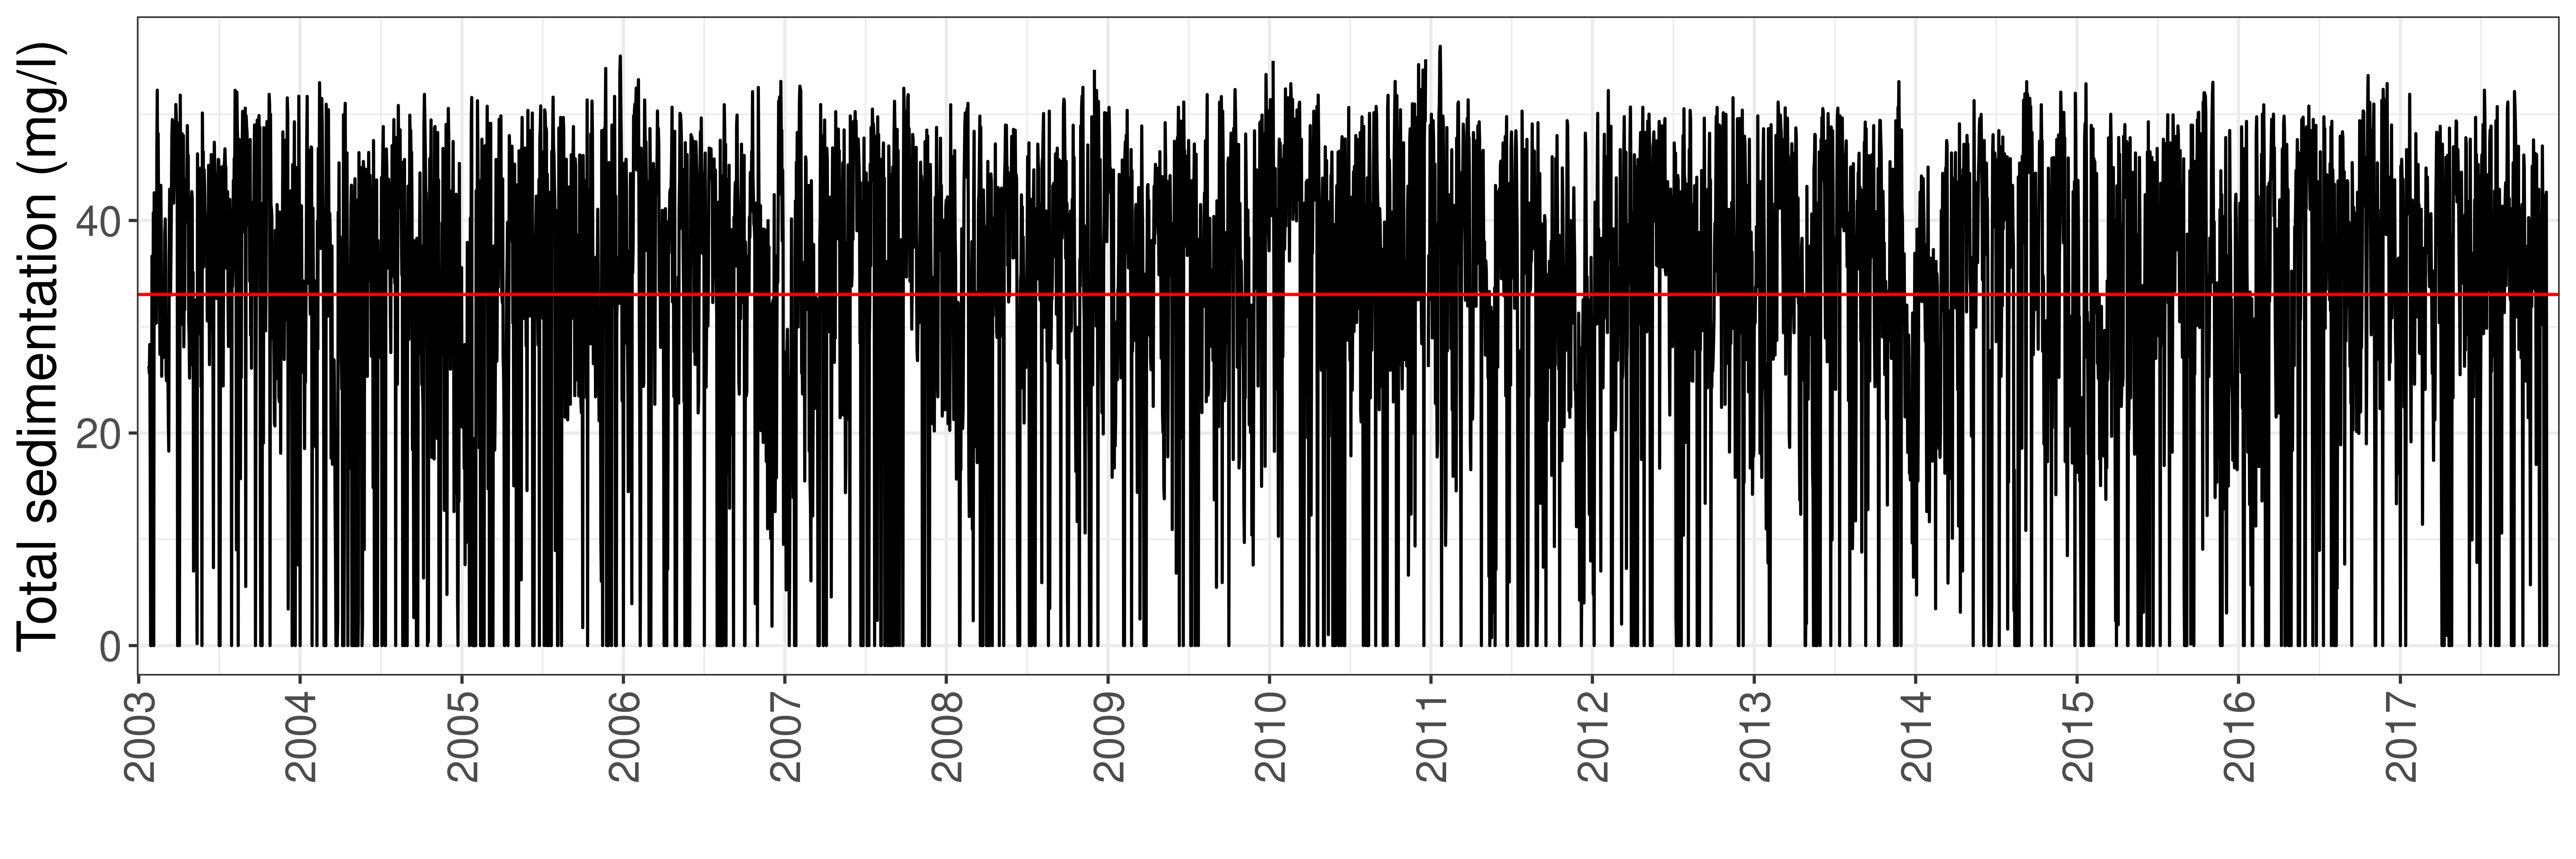
Fig. 15. Mean total sedimentation (mg/l) for Kinnegon Bay over time (2003 - 2017).
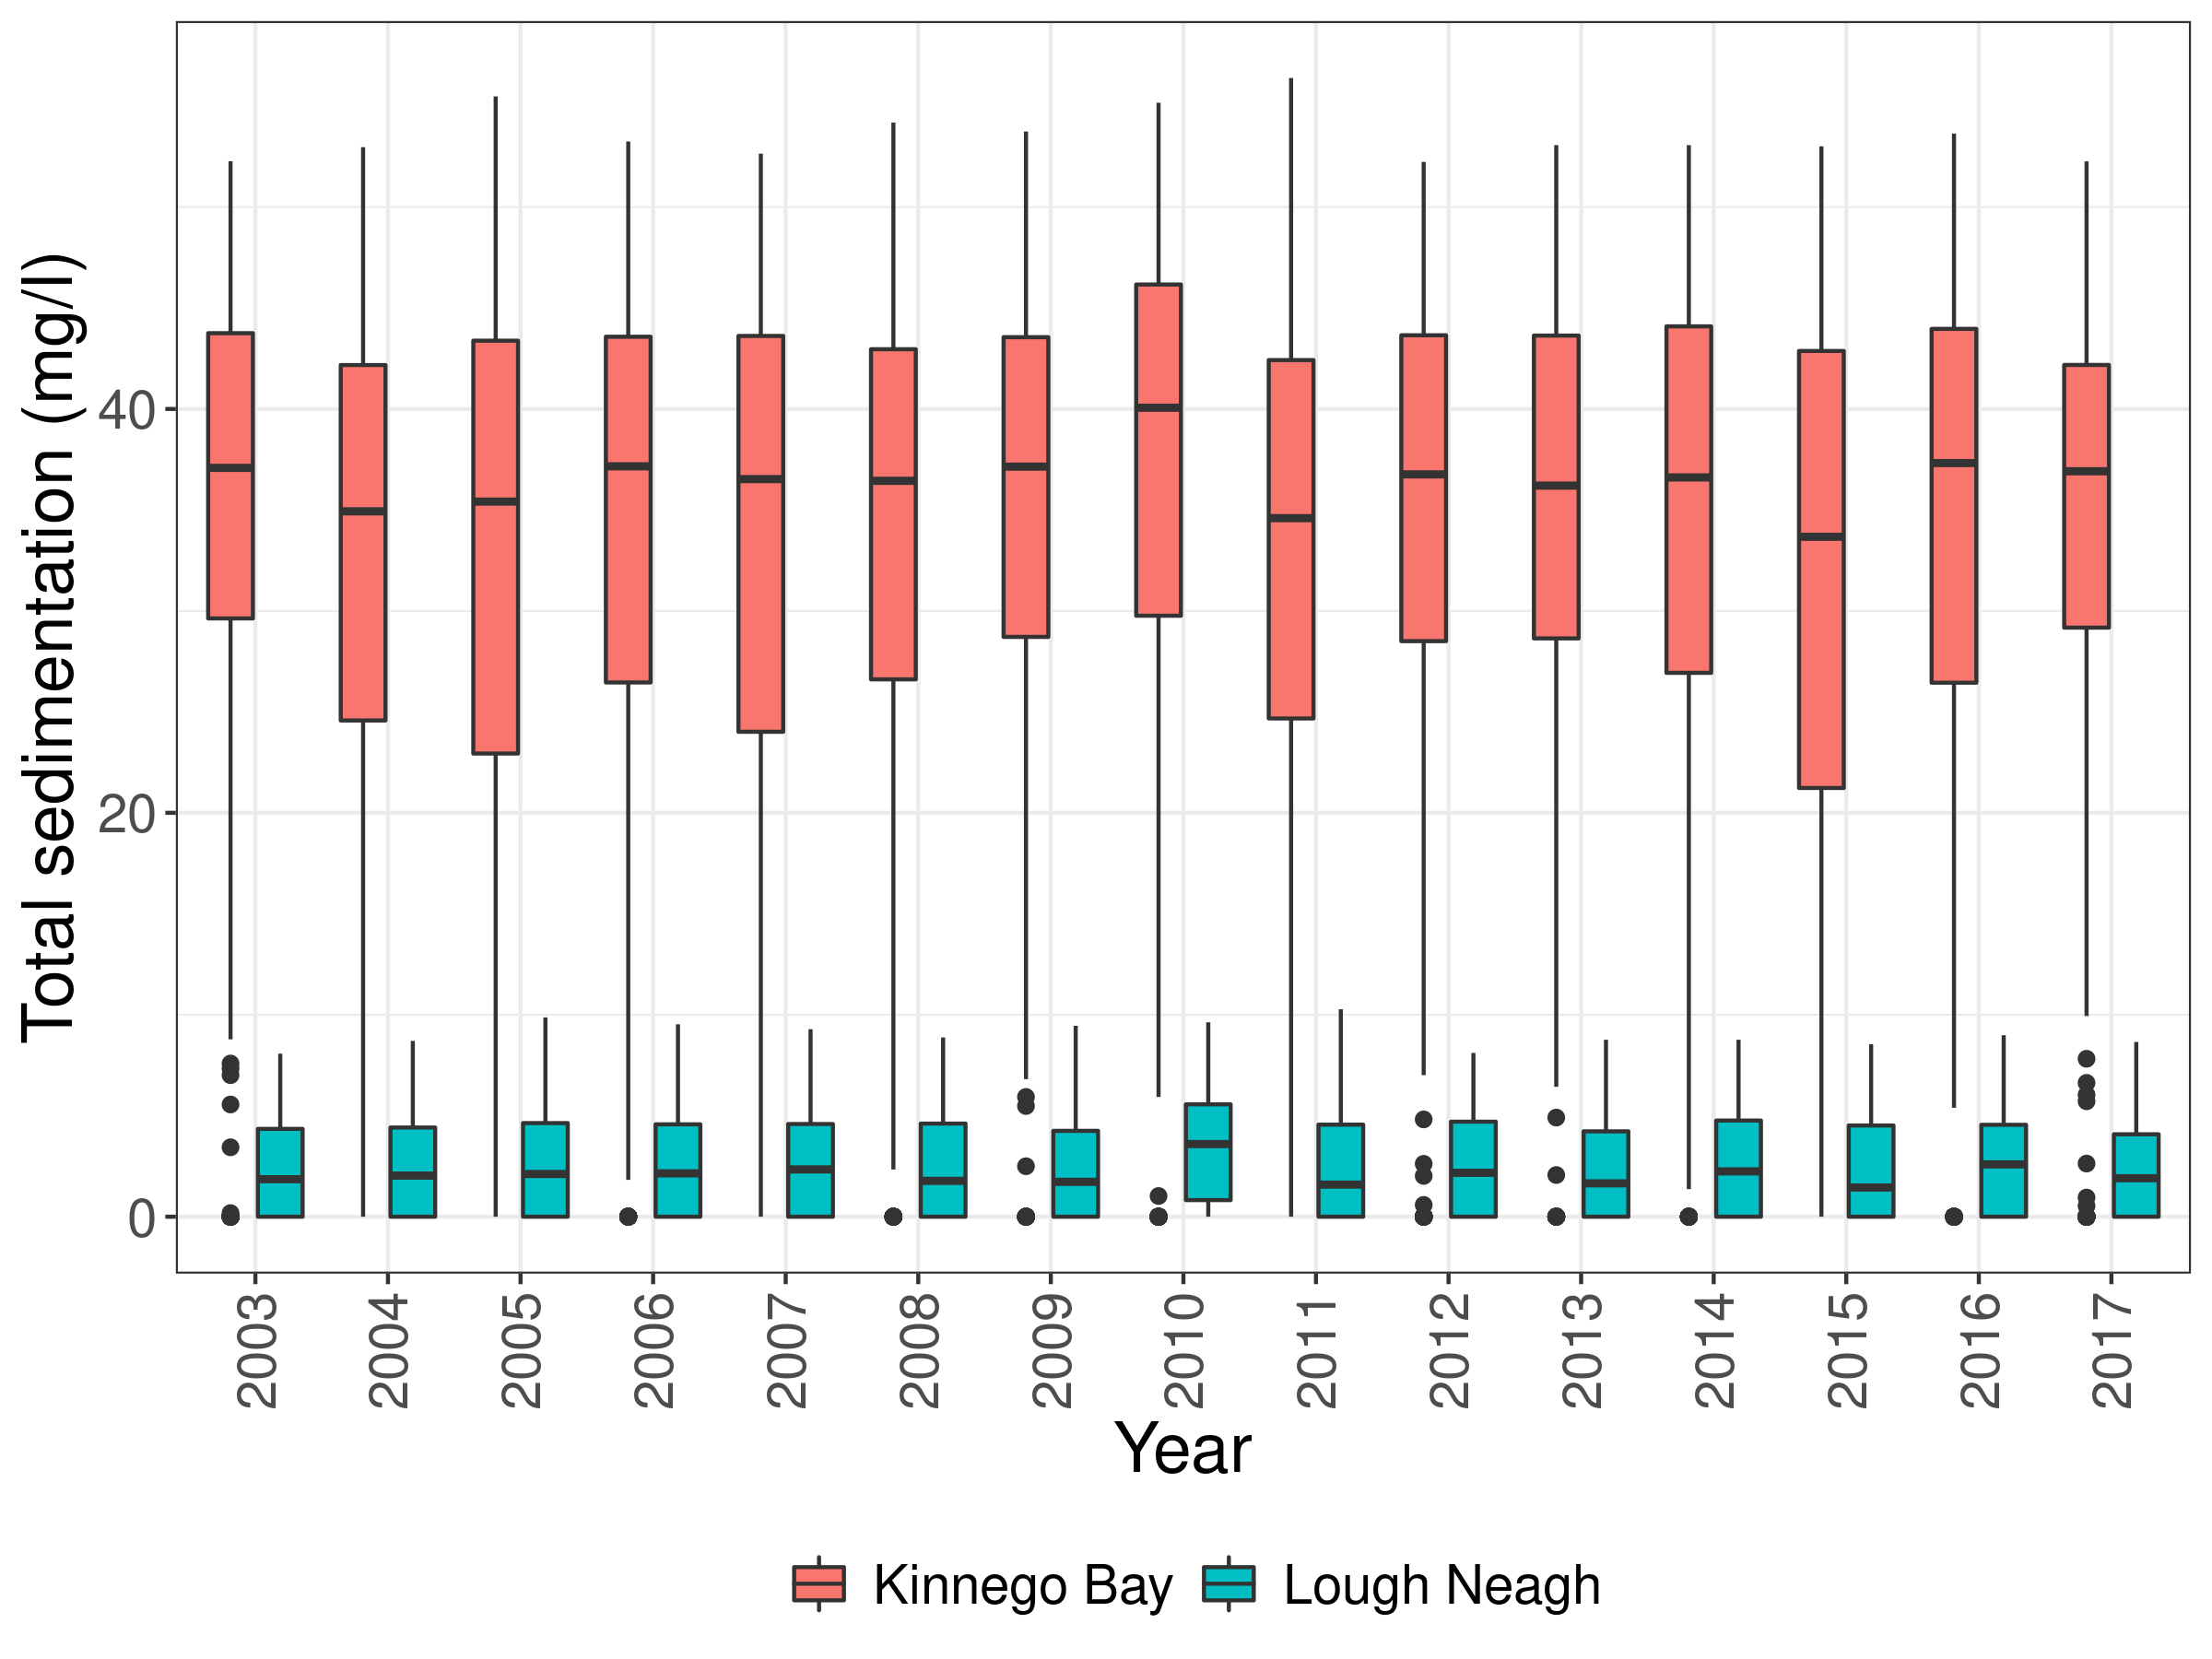 Fig. 16. Comparison of yearly
total sedimentation (mg/l) for Kinnegon Bay versus the entire Lough.
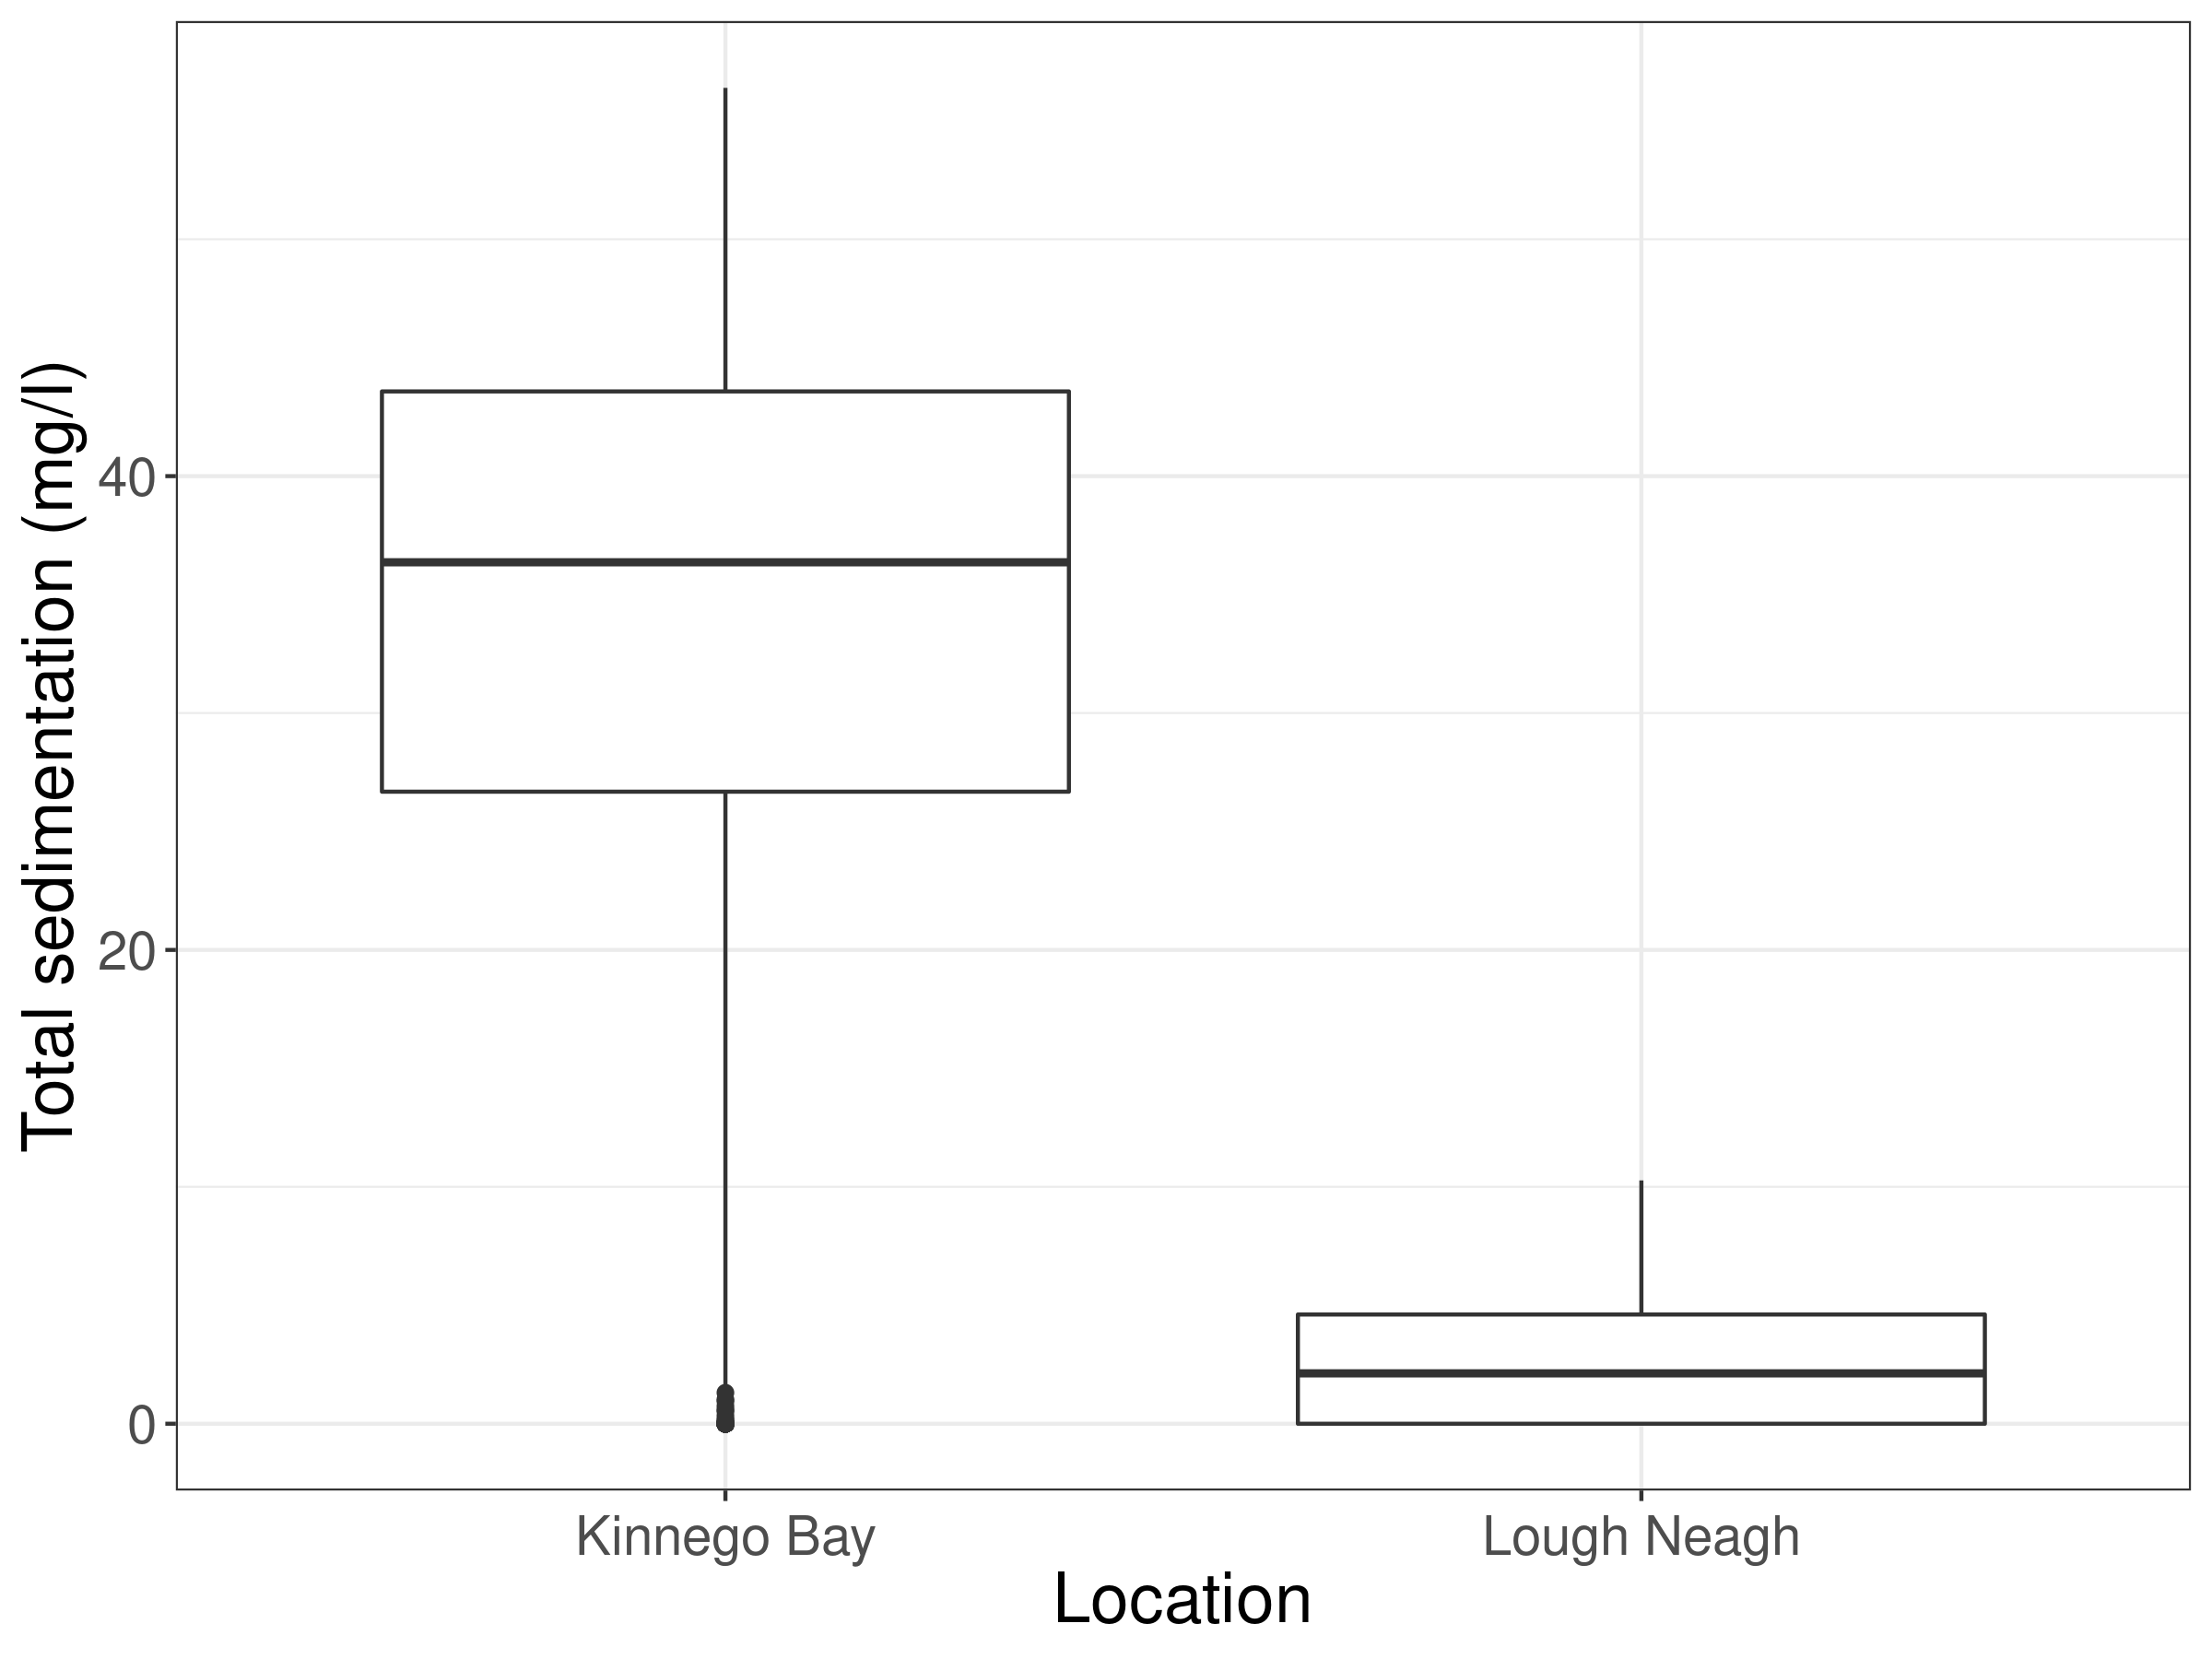
Fig. 17. Comparison of total sedimentation from Kinnego Bay versus the entire Lough.
References
Douglas and Rippey 2000 - The random redistribution of sediment by wind in a lake
Supplementary Figures
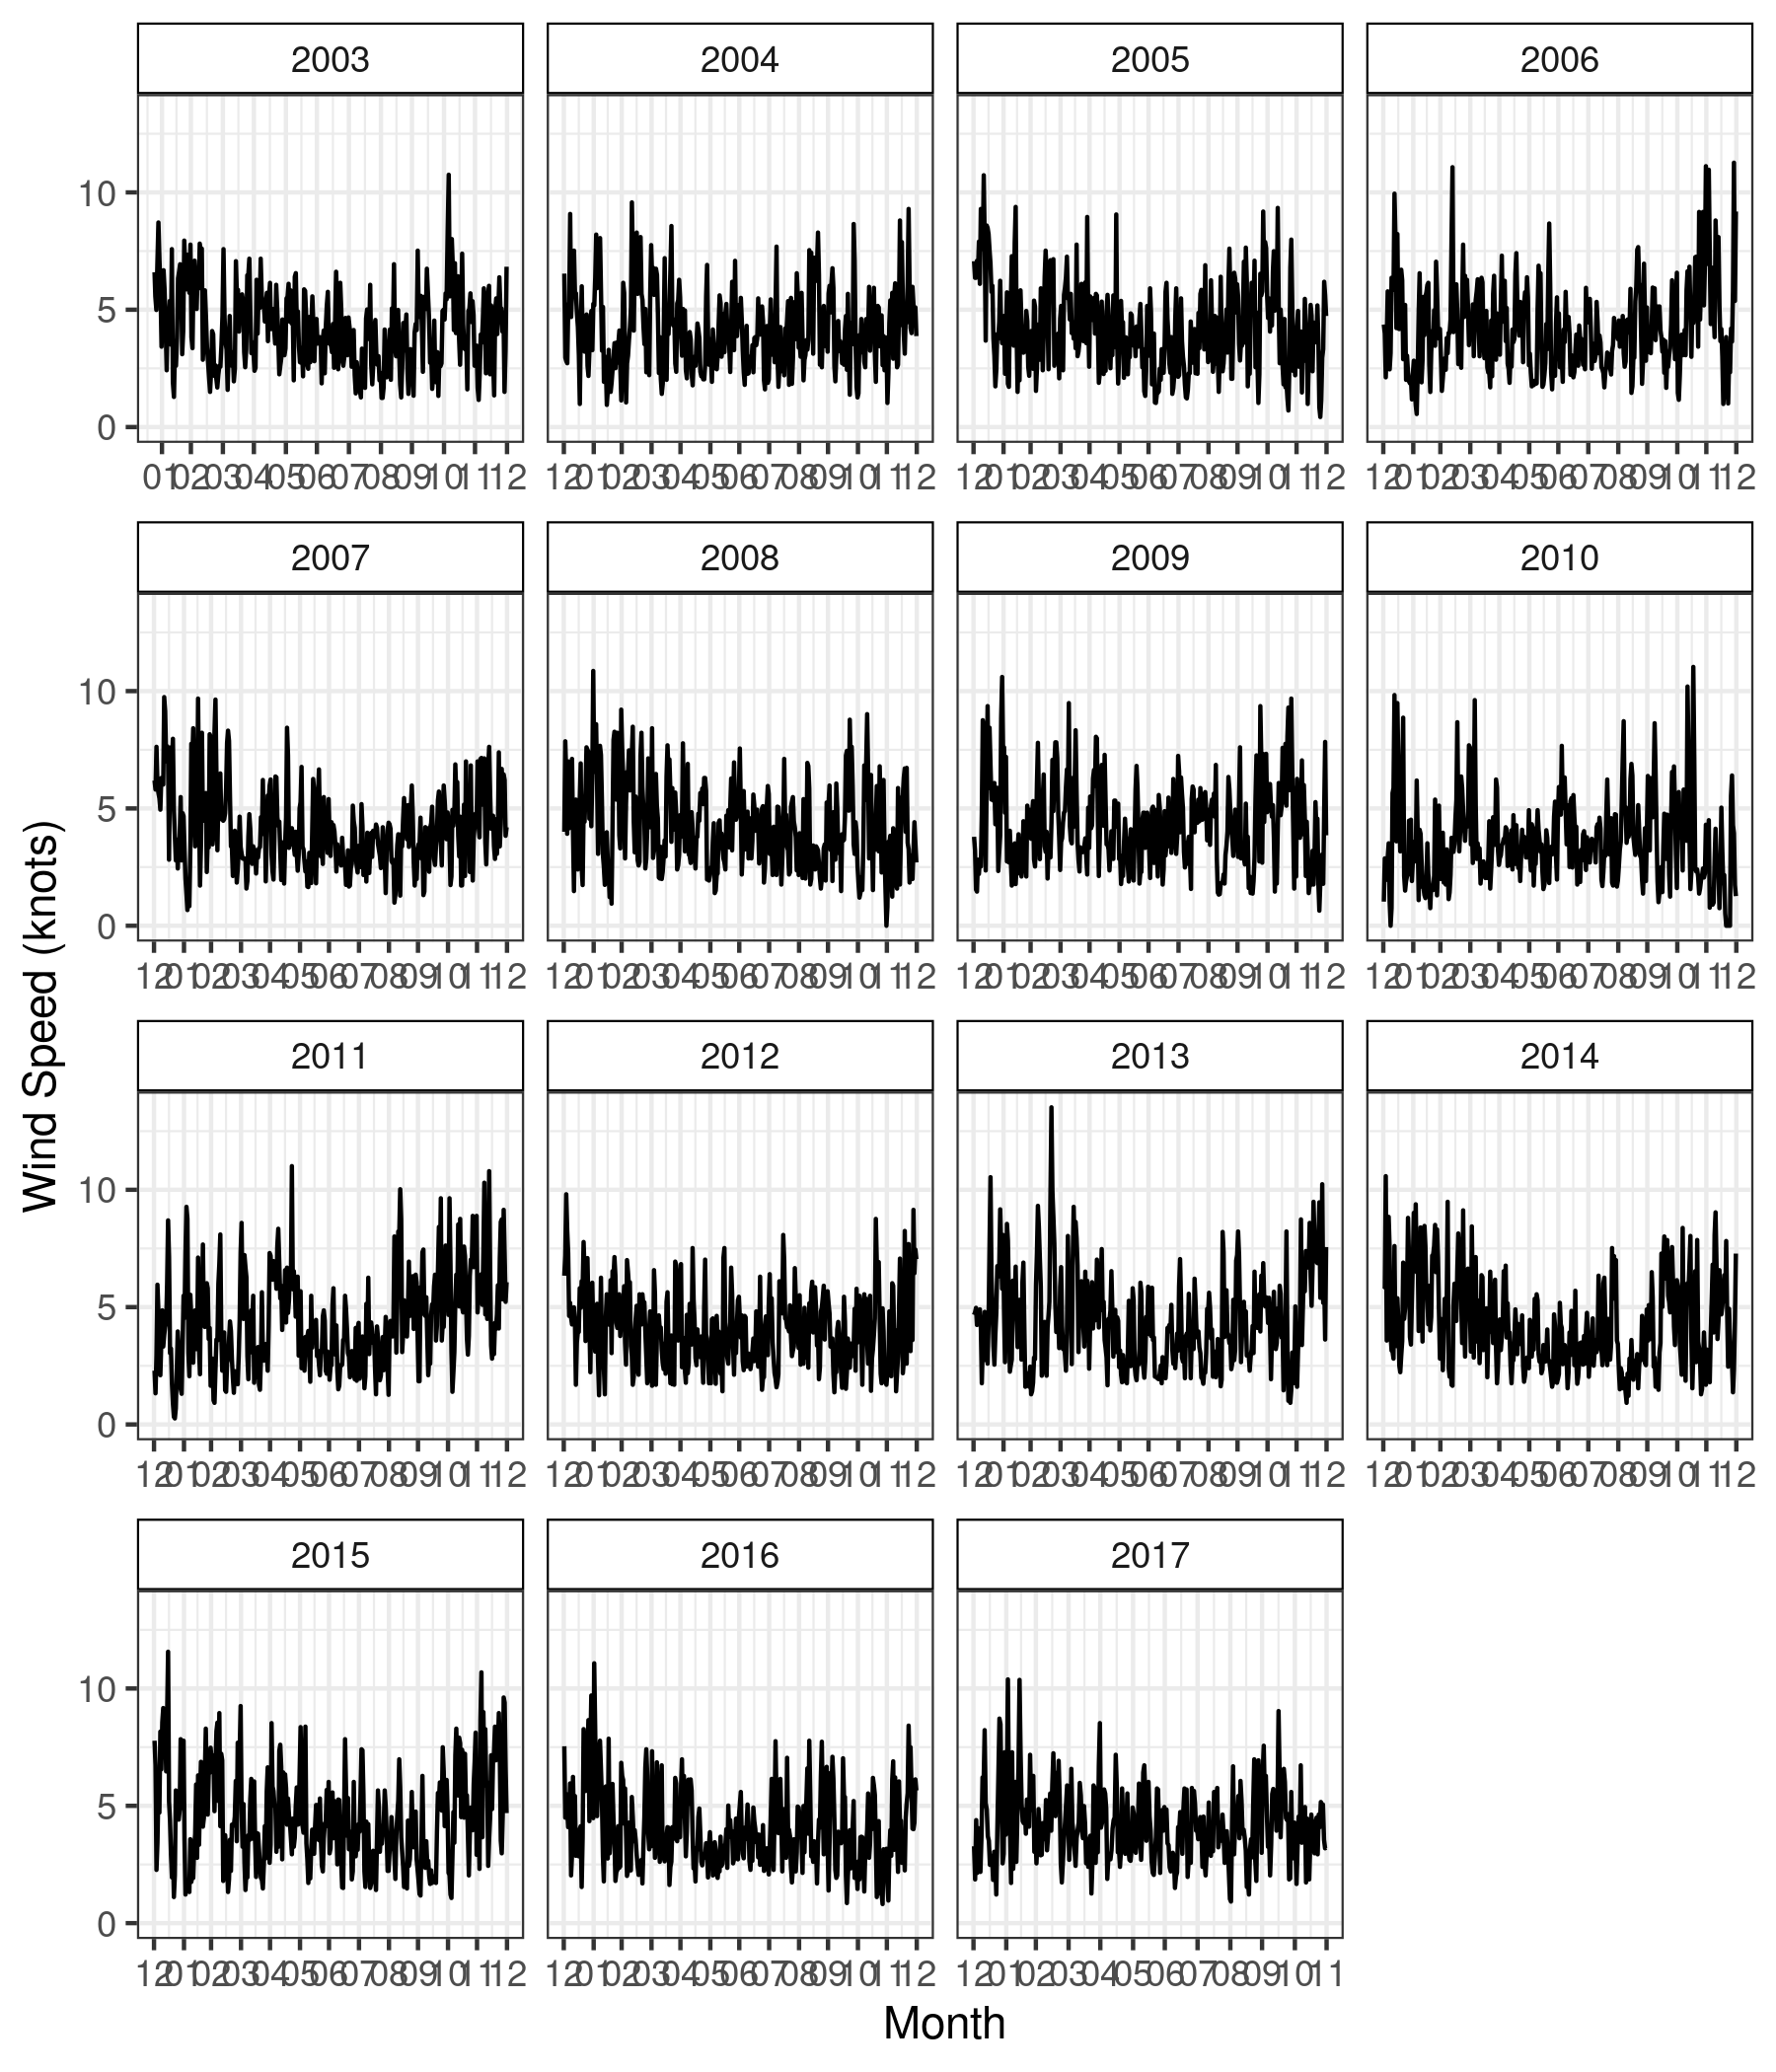
Fig. S1. Yearly wind speed from 2003 - 2017.
Fig. S2. Yearly wind speed from 2003 - 2017.
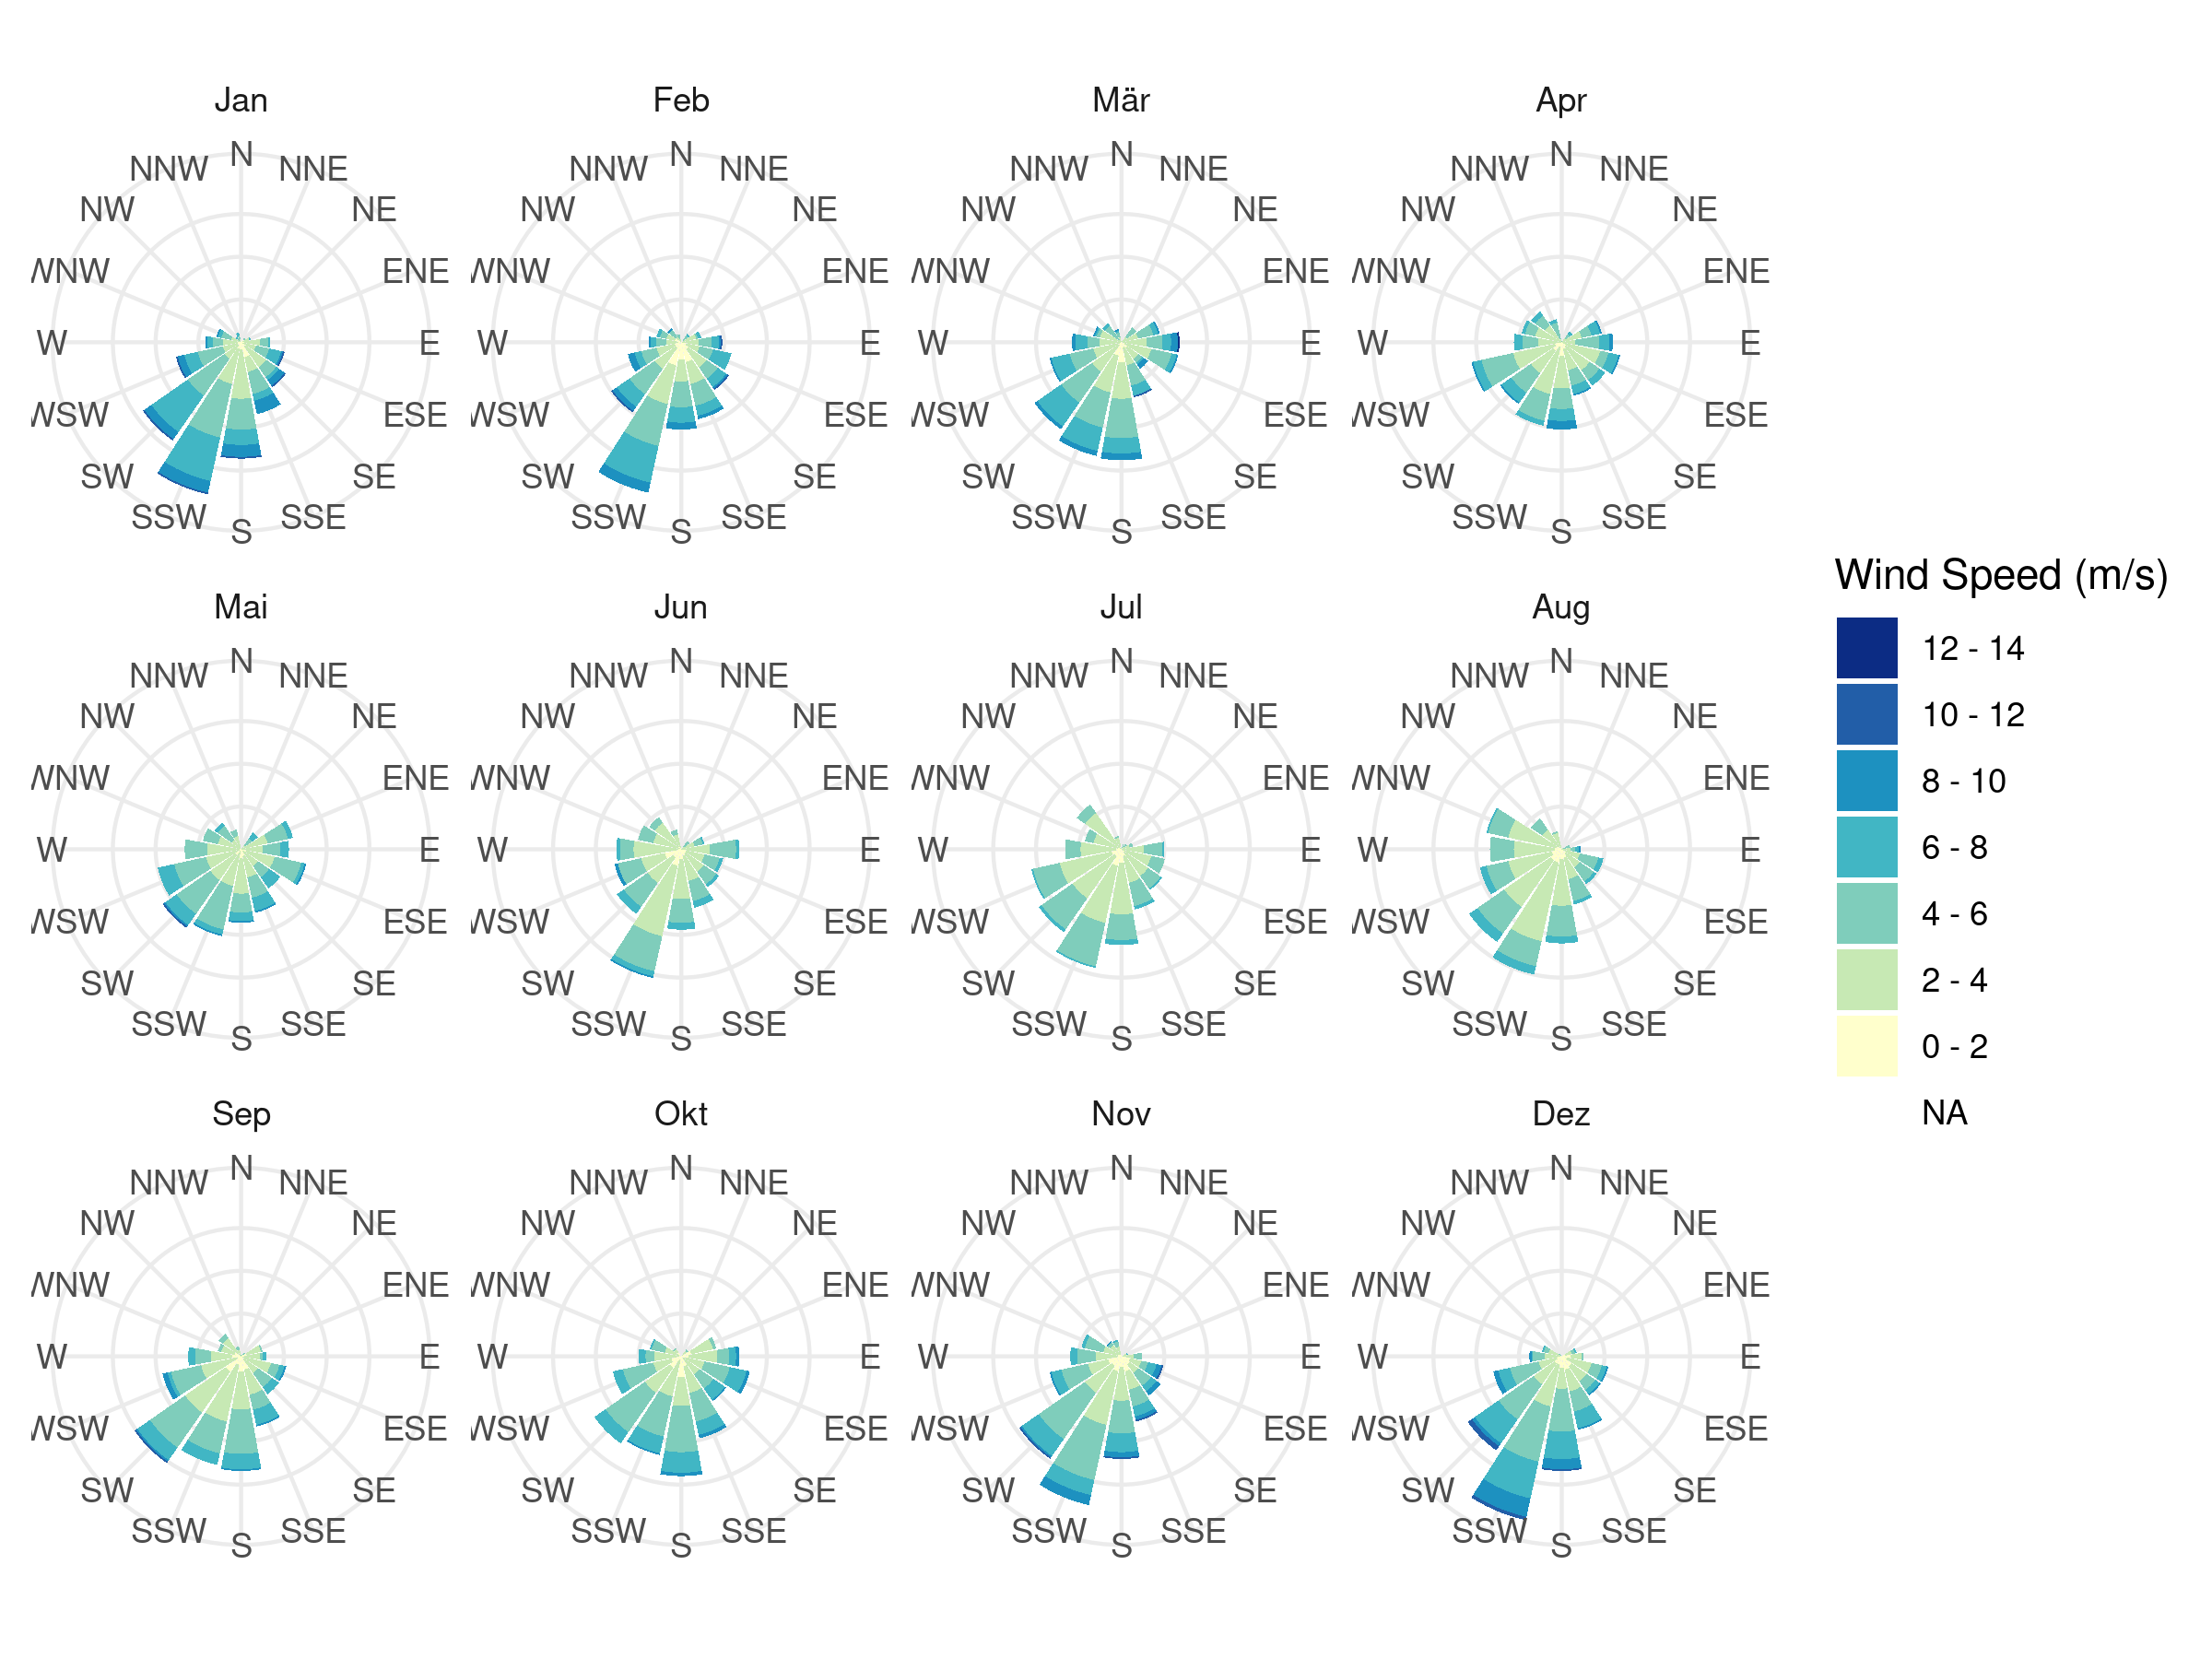
Fig. S3. Monthly polar diagram of wind direction and wind speed from 2003 - 2017.
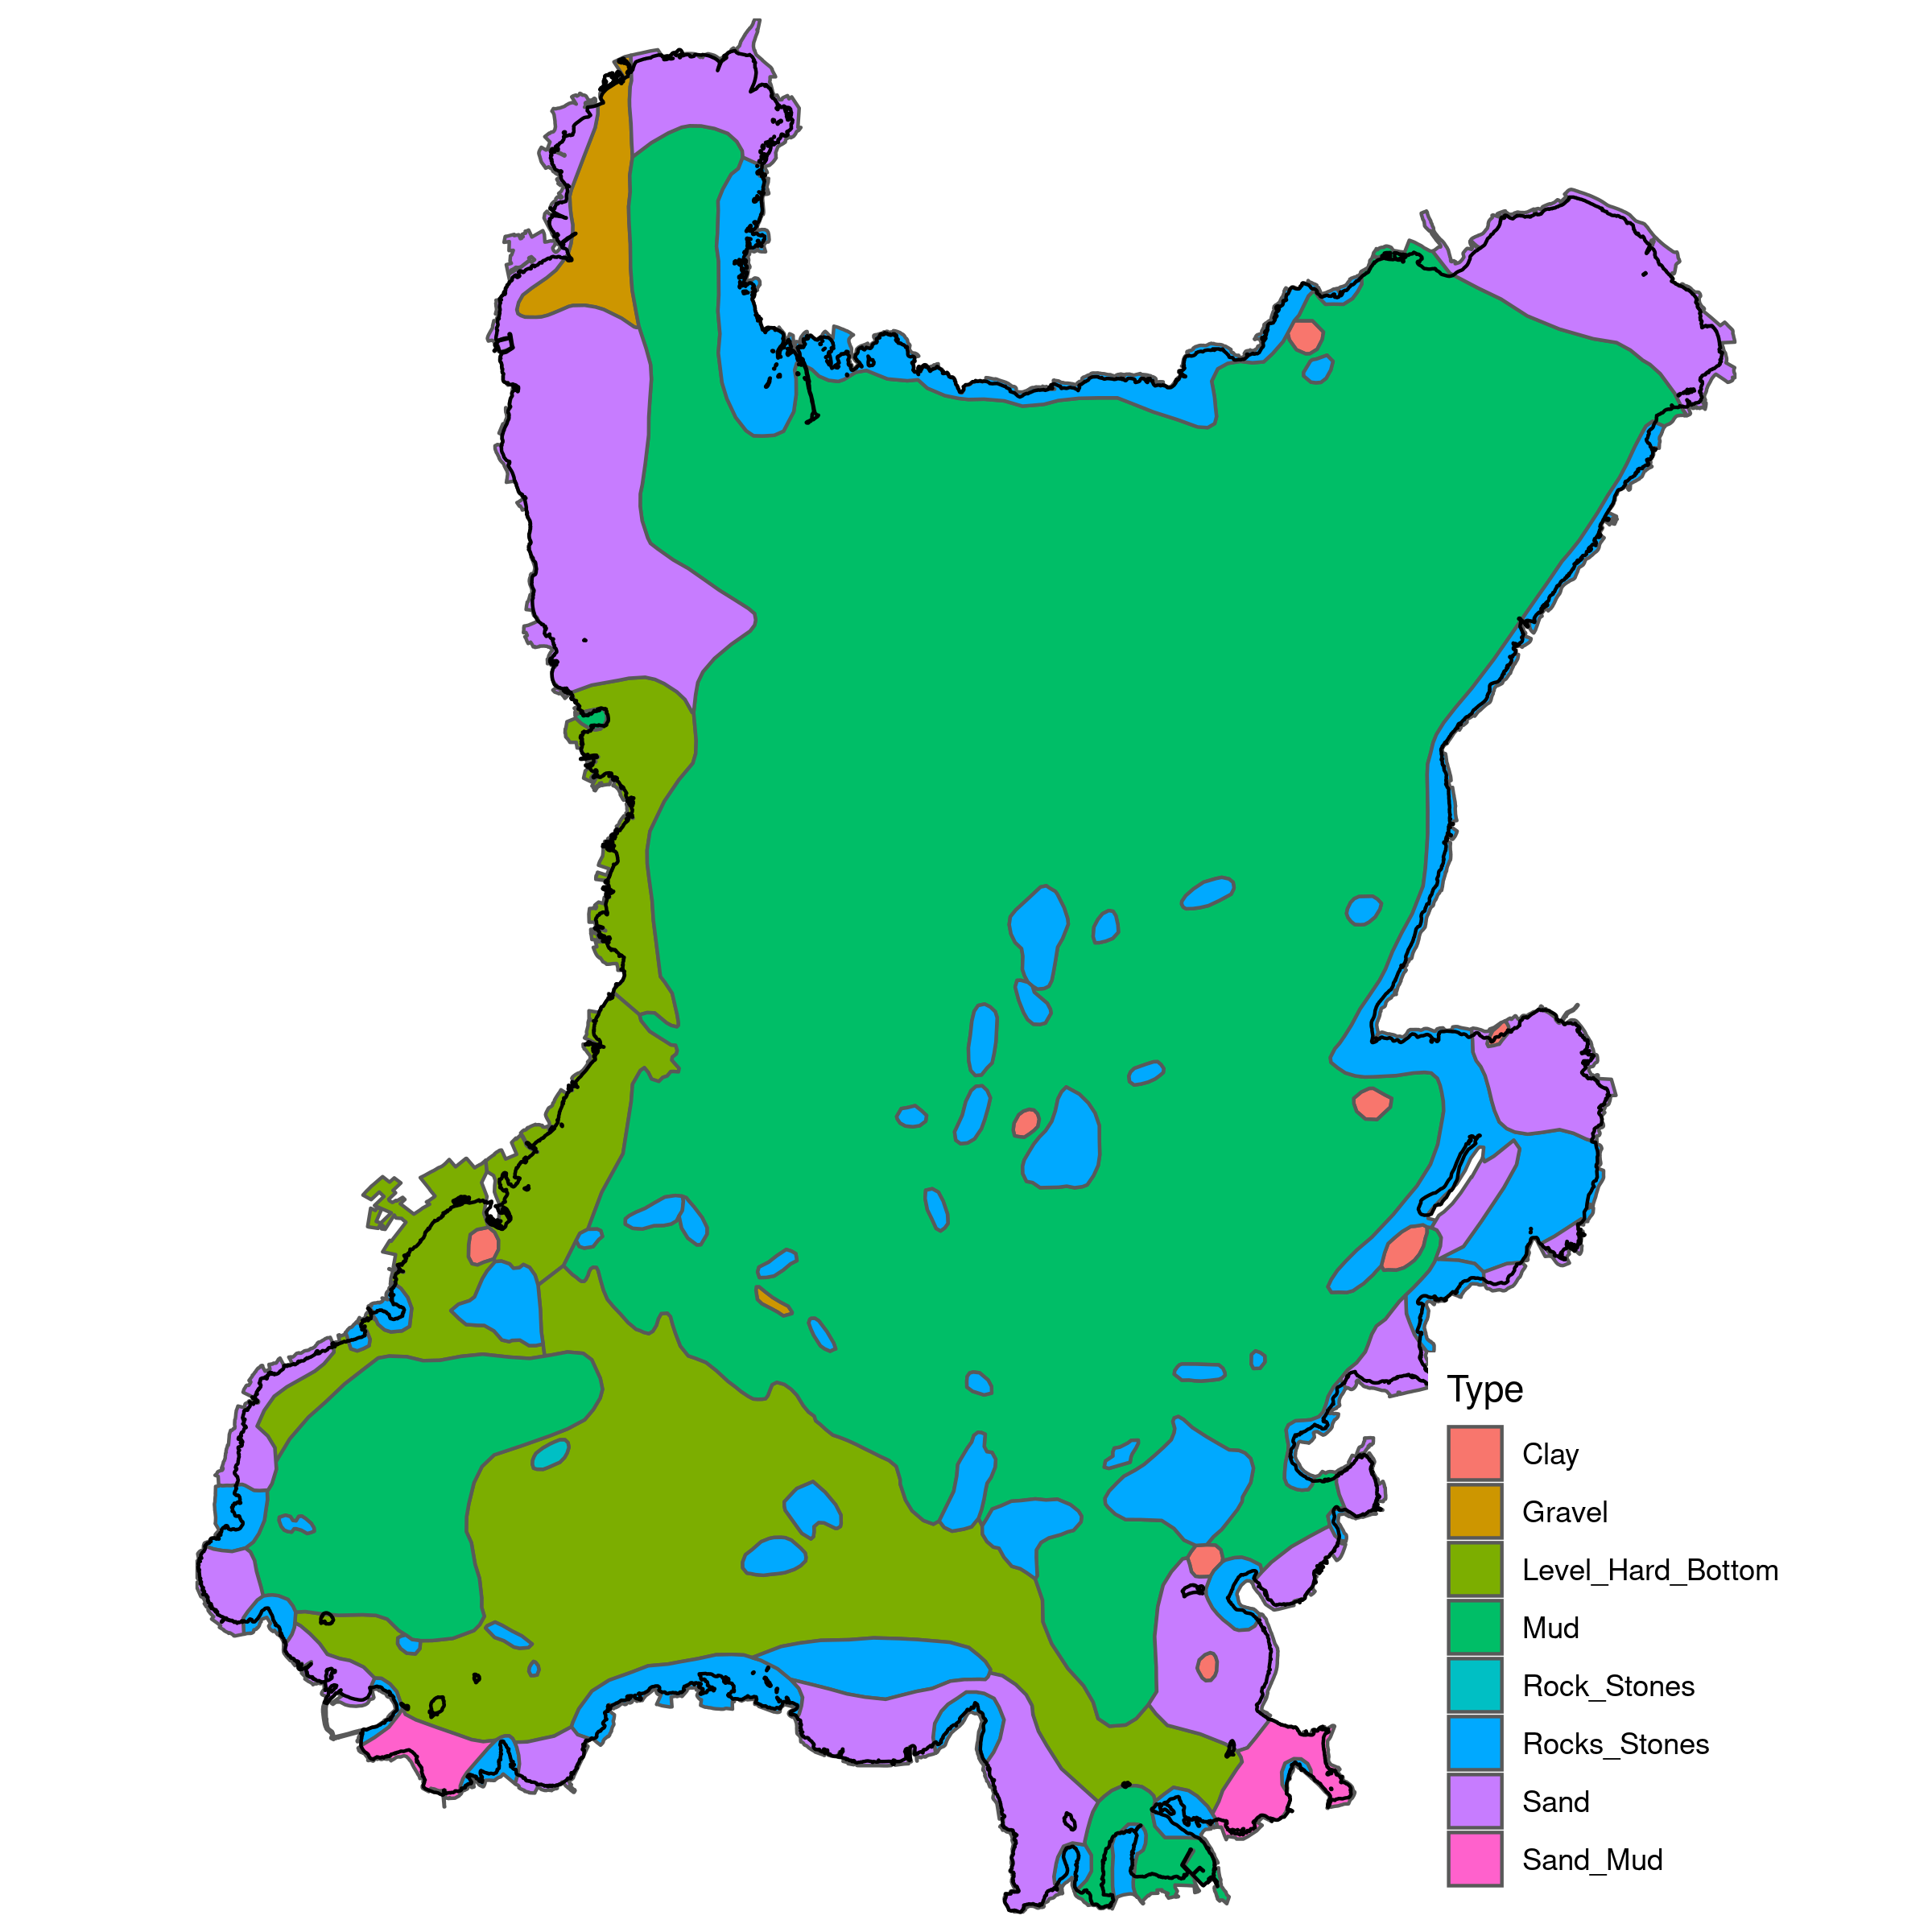
Fig. S4. Map of substrate types in Lough Neagh.
Fig. S5. Linear relationship between DWML and total sedimentation rate separated by locations, adapted from Douglas & Rippey 2000.
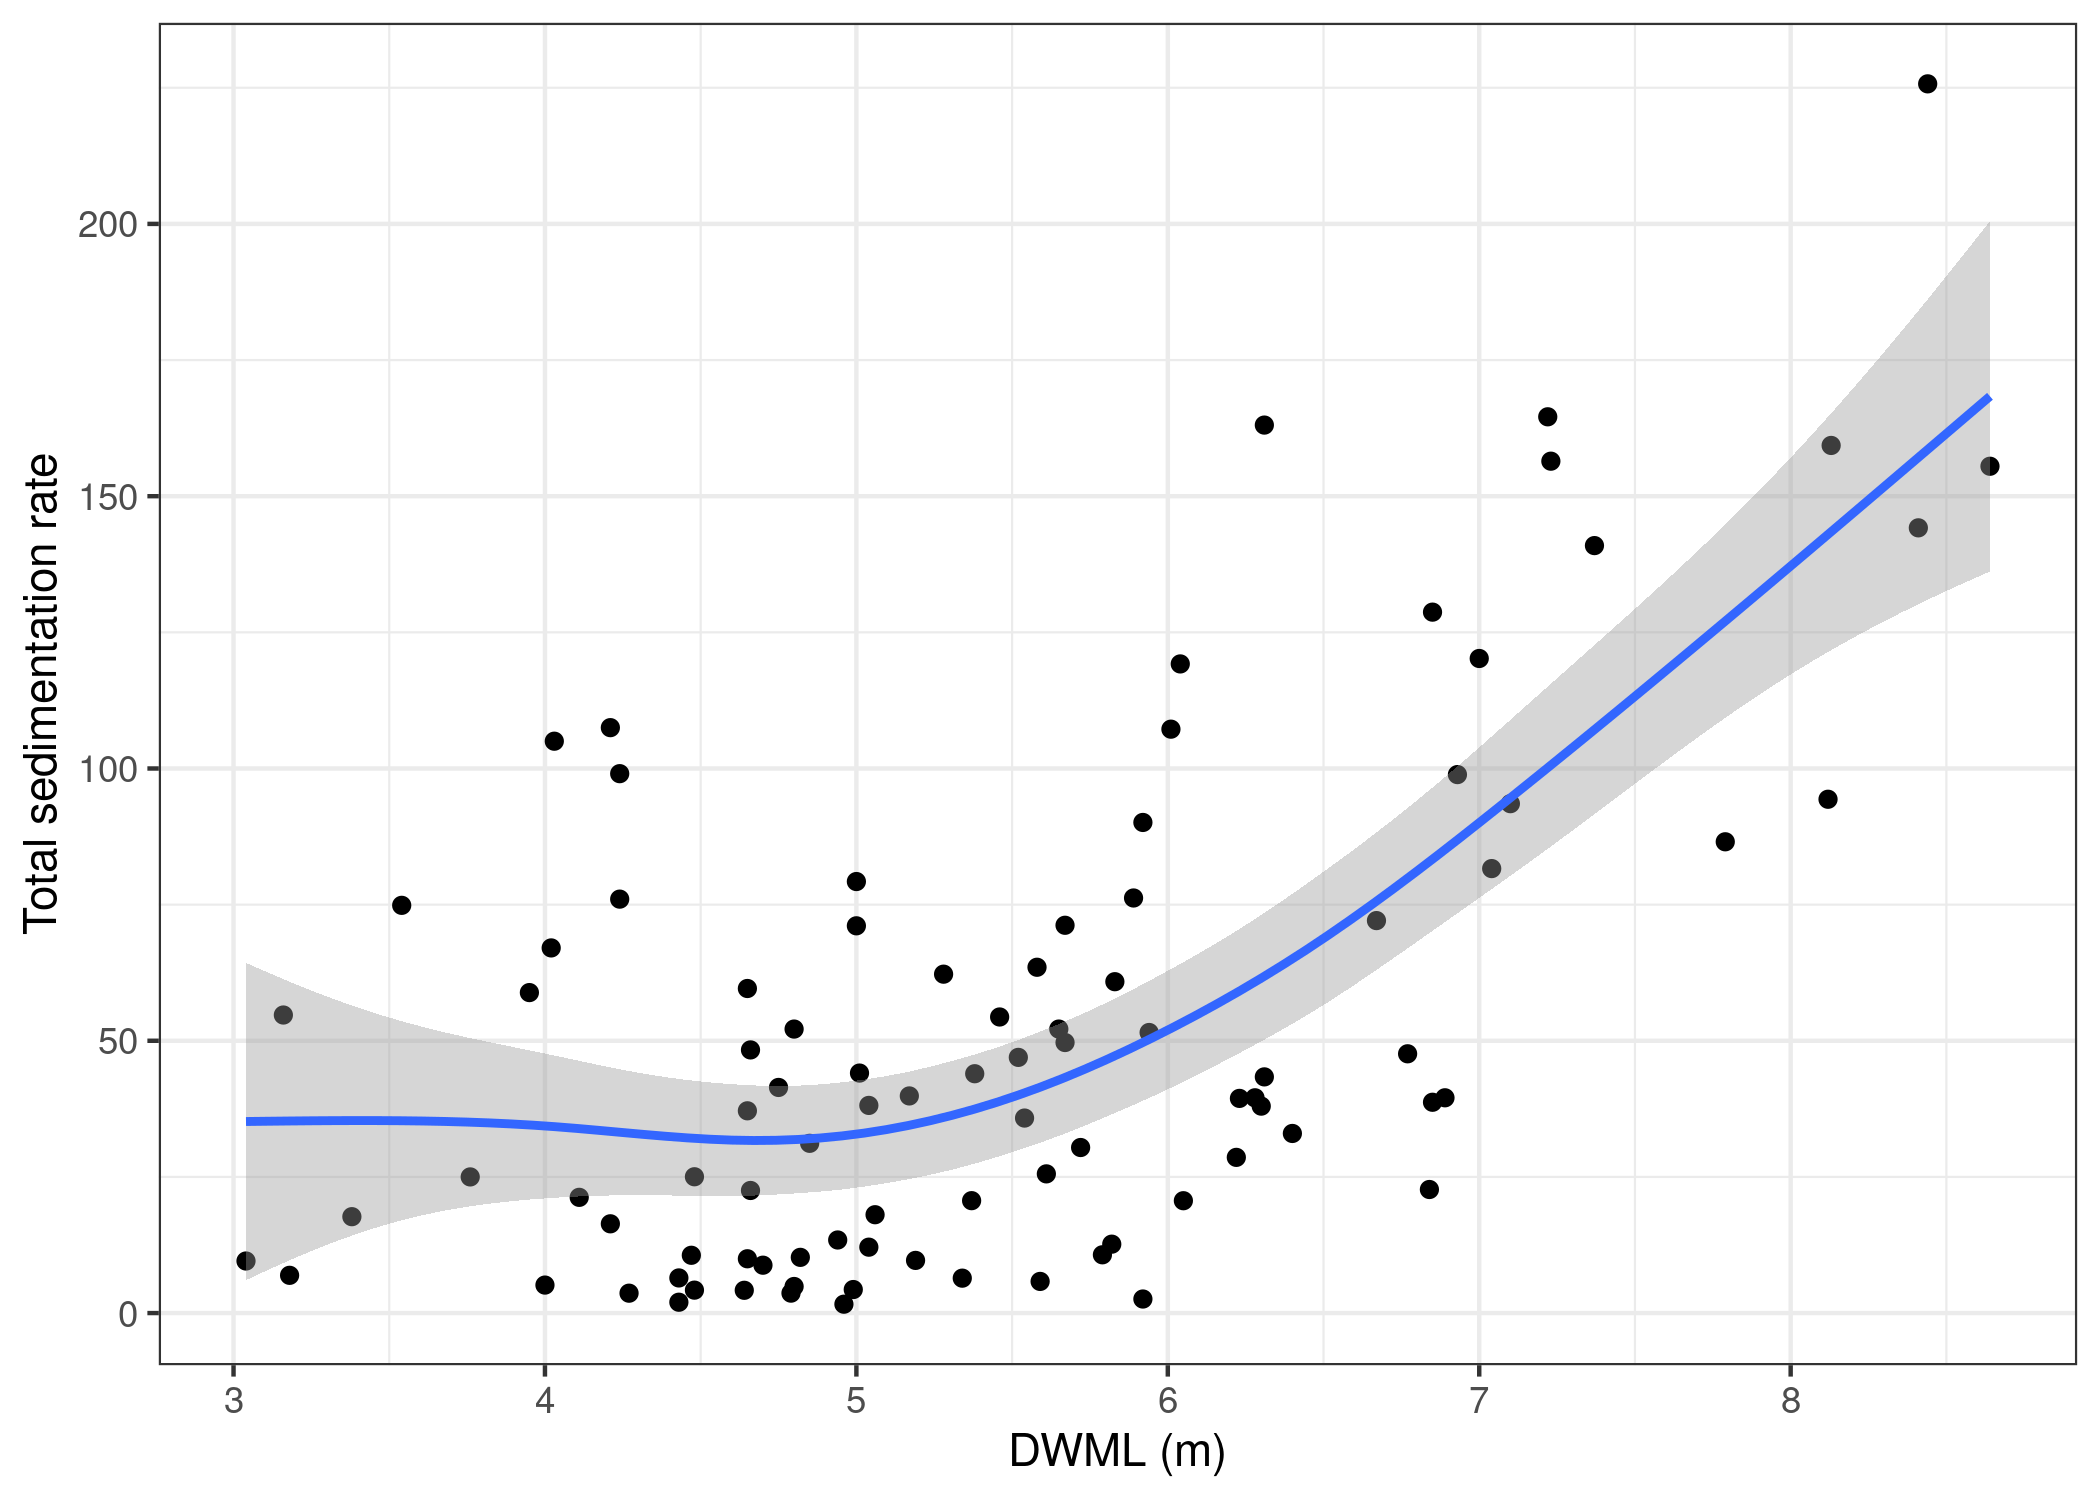 Fig. S6. Non-linear relationship
between DWML and total sedimentation rate separated by locations. Data
derived from Douglas & Rippey 2000.
