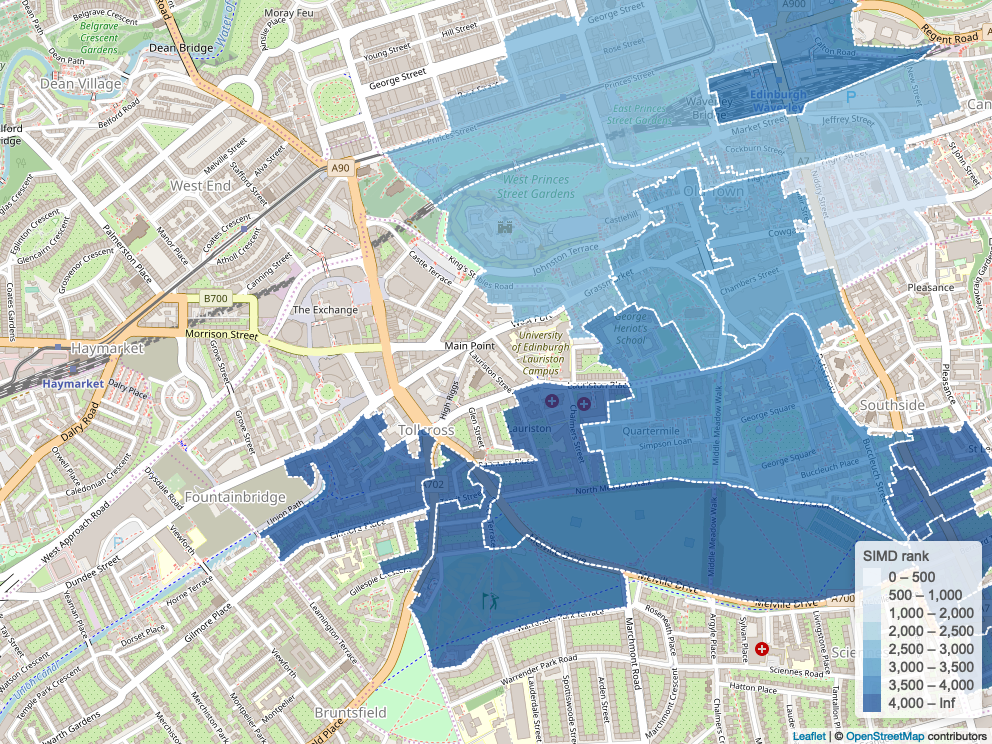
A guide for analysts to quickly create customised maps in pdf or png format without requiring licensed mapping software using the rgdal and leaflet packages.
Author: Richard Haigh
Date of Intial Upload: 1/11/2019
Written - R Desktop 3.5.2
Environment: RStudio v1.2.1335
Software Requirements: PhantomJS (available at https://phantomjs.org) - *optional
Packages: SPARQL v1.16, tidyverse v1.2.1, leaflet v2.0.2, rgdal v1,4-6, mapview v2.7.0, webshot v0.5.1
This is intended to be a guide for analysts and statisticians with a mid-level knowledge of R and programming fundamentals that will aid them in creating customised maps. Use this if you wish for a pdf or png output file that shows your desired geography level breakdown (be it LA, DZ or SPC) and can shade each geog area by a given variable such as population, wealth or any other quantifiable numeric measurement.
You can use this with an existing dataset providing it has a breakdown of your chosen geography level. You must also have access to the software stated above.
Using this guide, you can quickly create ouptut such as this without using any licensed mapping software, such as QGIS or Arc:

