- Overview
- Development Environment Setup
- Architecture of diagnostics system
- Currently implemented diagnostics
- Ideas for Possible improvements
According to our estimations, Erigon is used by hundreds of people. Some users are individuals, others - companies that use it for internal purposes, and there are also companies that "sell" access to their Erigon nodes to other individuals and companies. Very often, users encounter issues when working with Erigon. We can classify them roughly in the following categories by their cause:
- Caused by the mismatching expectation. User expects Erigon to do something that it cannot do.
- Caused by accidental user errors (typos in the command line, for example).
- Caused by underlying software or hardware issues on user’s system (for example, running out of disk space, faulty memory, bug in operating system).
- Caused by bugs in Erigon.
- Caused by bugs in libraries that Erigon uses.
- Caused by other systems that are used in conjunction with Erigon (for example, Consensus Layer implementations).
This classification should be viewed as "work in progress" and we will refine it as we move on with the project. As we communicate with the users about these issues, we would like to first determine whether it is an issue of type (1), (2), (3), or (4), and so on, or perhaps a new kind of issue. Some issues, for example, of type (4), which are the most “interesting” for Erigon developers, can be further classified. Often, it is enough to ask the user to show error message or console output or log file to identify the cause. Often the issues are easy to reproduce if developers have the same type of node that user has. But there are many cases where even looking at the console output is not enough to diagnose the issue. Moreover, the issue may be transient and disappear when the user tries to restart the system with some additional tracing code. Our prediction is that as the complexity of Erigon as a system grows, the diagnostics of user issues will pose bigger and bigger challenge unless it is addressed in a systematic way.
We do not know if this possible solution will be workable, but we should try. In order to address the problem described above in a systematic way, we need to create a system and/or a process for dealing with user issues, i.e. to diagnose their cause. Diagnostics require gathering information about the user’s Erigon node. Some information should be gathered in any case, because it is universally useful for investigating the cause of most issues: Version of Erigon. Basic parameters of the user’s systems and its hardware, for example, available and used memory, available disk space. Snippet of the recent console output.
Further investigation often requires more data, and probing for such data is usually done in an interactive manner, in order to optimise for the amount of communication. This applies both to human communication (when diagnostics is done in our current way), and to the communications between diagnostics system and user’s Erigon node. Diagnostics may be performed by the diagnostics system in the manual mode, where probing for more data is done by the human operator, who uses the diagnostics system to visualise the data received before, and decides what else needs to be seen. This would be initial mode of operation for the diagnostics system, as we start to learn what capabilities it should have. It is conceivable that as the diagnostics system develops, it may be able to perform diagnostics automatically using some pattern matching and heuristics.
Since the diagnostics system is an application which is only very loosely connected with Erigon, and so far is more self-contained, learning it and working with it should require much less time than learning to work with the Erigon code. Also, working with the diagnostics system requires understanding how Erigon is run and operated by the user, and hopefully should also give some exposure to what kind of issues usually occur and what are useful diagnostics to deal with them.
Therefore, we think it can be very useful to ask for contributions (improvements) to the diagnostics system as a part of our recruiting process (to pre-screen the candidates who are interested and capable), and also as a part of on-boarding for the developers who have recently joined the team. For worthy improvements, bounties can be paid, since we do not necessarily want people to work for free.
- Golang installed locally
- Erigon Node running locally (if needed, please review the Erigon Node quick setup guide below)
Clone the Erigon repository
git clone --recurse-submodules -j8 https://github.com/ledgerwatch/erigon.git
Change into the repo, and make sure you are on the devel branch
cd erigon
git checkout devel
Build the repo
make erigon
Run the Node. To make sure that it connects to the diagnostics system, add the --metrics flag.
The <data_directory> field will be the directory path to your database. The sepolia chain and the --internalcl options will allow for quicker setup for testing
./build/bin/erigon --datadir <data_directory> --chain sepolia --internalcl --metrics
Check the prometheus logs by navigating to the url below
http://localhost:6060/debug/metrics/prometheus
To set and use a custom address and port, here a link to more information on this step
git clone https://github.com/ledgerwatch/diagnostics.git
cd diagnostics
make build
This will create diagnostics executable in ./_bin directory.
To run with premade self-signed certificates for TLS (mandatory for HTTP/2), use this command:
./_bin/diagnostics --tls.cert _demo-tls/diagnostics.crt --tls.key _demo-tls/diagnostics-key.pem --tls.cacerts _demo-tls/CA-cert.pem
This may take a while (and currently there is no way to tell if it's ready in terminal, just try to open browser UI). There could be TLS Handshake error in the terminal. Also, your browser may tell you it is "unsafe". Proceed anyway, it cannot be unsafe in the way browser means because it's running on your machine.
The above command can also be run with Make:
make run-self-signed
To view the application in your browser, go to the URL https://localhost:8080/ui. Your browser will likely ask to accept the risks (due to self-signed certificate), do that.
Link to more information on this step
Link to more information on this step
Running the tests including integration and end to end can be done using the Makefile:
make test
Linting with golangci:
make lint
In the browser, go to the URL https://localhost:8080/ui. Your browser will likely ask to accept the risks (due to self-signed certificate), do that.
For an Erigon node to be connected to the diagnostics system, it needs to expose metrics using this command line flag:
--metrics
By default, the metrics are exposed on localhost and port 6060. In order to expose them on a different networking interface and/or different port,
the following command line flags can be used:
--metrics.addr <IP of interface> --metrics.port <port>
If you are not sure what kind of node to run, you can try Ethereum Sepolia testnet with Caplin (Erigon's experimental embedded Consensus Layer support).
Caplin works on Sepolia in devel branch of Erigon, but this wll be included into the next release. Build Erigon from devel branch, choose data directory
and run this command:
erigon --datadir <data_directory> --chain sepolia --internalcl --metrics
The flag --internalcl enables Caplin, which means that you won't need to install a Consensus Layer separately, and this will make your work simpler.
In order to check is the metrics are exposed on given interface or port, you can check it in the browser by going to
http://<metrics.addr>:<metrics.port>/debug/metrics/prometheus
If metrics are exposed, textual representation of metrics will be displayed in the browser.
First, in the browser window, create a new operator session. Choose an arbitrary name. In real operations, one would choose the name that can be easily correlate to the node being supported, for example, name or pseudonym of the person or the company operating the node.
After new session is created, it will be allocated a unique 8-digit PIN number. The pin is then displayed together with the session number on the screen.
Currently, generation of PIN numbers is not secure and always follows the same sequence, which makes testing easier. For example, the first
allocated session PIN is always 47779410.
Next, while making sure that erigon node is already running in the system, start a new console window, run the following command, specifying the session PIN at the end of the --diagnostics.url command line flag.
Since the website is using self-signed certificate without properly allocated CName, one needs to use --insecure flag to be able to connect.
./build/bin/erigon support --metrics.urls http://<metrics.addr>:<metrics.port>/debug/metrics --diagnostics.url https://localhost:8080/support/47779410 --insecure
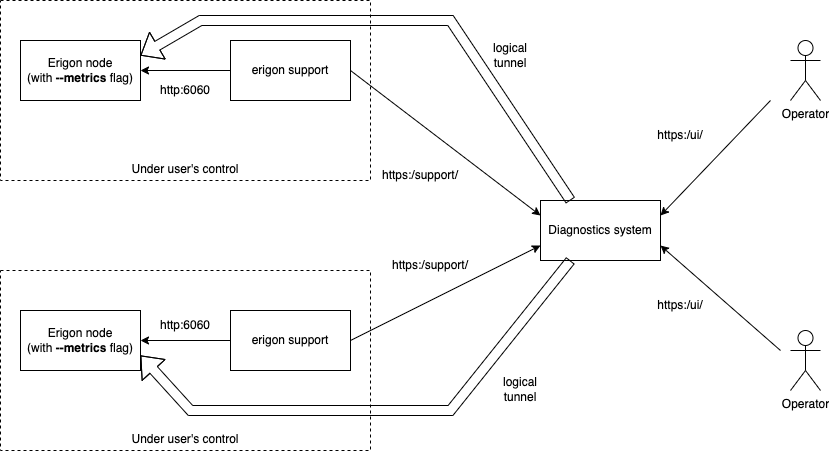
Following diagram shows schematically how the process of diagnostics works. Erigon nodes that can be diagnosed, need to be running with --metrics flag.
Diagnostics system (HTTP/2 website) needs to be running somewhere. For the public use, it can be a website managed by Erigon team, for example. For
personal and testing use, this can be locally run website with self-signed certificates.
In order to connect Erigon node to the Diagnostics system, user needs to start a process with a command erigon support, as described earlier.
The initiations of network connections are shown as solid single arrows. One can see that erigon support initiates connections to both Erigon node
and the diagnostics system. Then, it uses the feature of HTTP/2 called "duplex connection", to create a logical tunnel that allows diagnostics system
to make HTTP requests to the Erigon node, and receive the information exposed on the metrics port. The URLs used to connect erigon support to the
diagnostics system, start with /support/ prefix, followed by the PIN of the session. In the code inside cmd/root.go, this corresponds to the
BridgeHandler type.
Operators (those who are trying to assist the Erigon node users) also access Diagnostics system, but in the form of User Interface, built using HTML
and Javascript. The URLs used for such access, start with ui/ prefix. In the code inside cmd/root.go, this corresponds to the UiHandler type.
Operator can look at the code version that Erigon node has been built with. The corresponding code in Erigon is in the file internal/erigon_node/erigon_client.go.
The code on the side of the diagnostics system is spread across files api/ui_handler.go (invocation of Version method),
internal/erigon_node/erigon_client.go, assets/template/session.html (template in the format of html/template package, the part where the button Fetch Versions is defined with
the javascript handler), assets/script/session.js (function fetchContent), assets/template/versions.html (html template
for the content fetched by the fetchContent javascript function and inserted into the HTML div element).
Operator can look at the command line arguments that were used to launch Erigon node. The corresponding code in Erigon is in the file internal/erigon_node/erigon_client.go.
The code on the side of the diagnostics system is spread across files api/ui_handler.go (invocation of CMDLineArgs method),
internal/erigon_node/erigon_client.go, assets/template/session.html (html template, the part where the button Fetch Cmd Line is defined with
the javascript handler), assets/script/session.js (function fetchContent), assets/template/cmd_line.html (html template
for the content fetched by the fetchContent javascript function and inserted into the HTML div element).
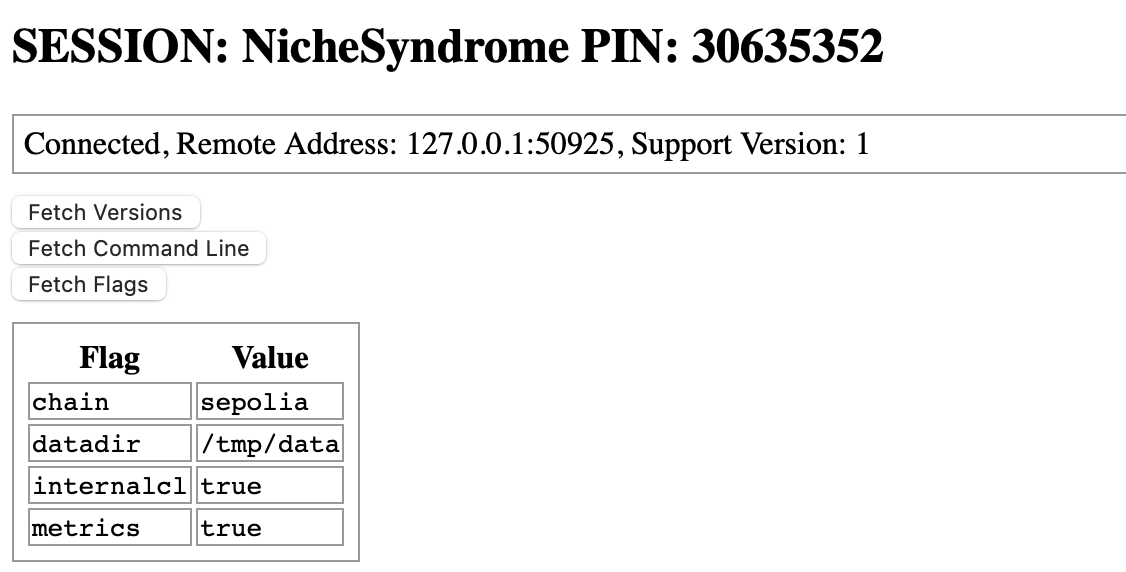
Operator can look at the flags that are set in cli context by the user to launch Erigon node. The corresponding code in Erigon is in the file internal/erigon_node/erigon_client.go. This is particularly useful when user launches Erigon using a config file with --config and Command line arguments cannot fully capture the true state of the 'launch setting'. The returned flags are the result after parsing command line argument and config file by Erigon.
The code on the side of the diagnostics system is spread across files api/ui_handler.go (invocation of Flags method), internal/erigon_client.go, assets/template/session.html (html template the part where the button Fetch Flags is defined with the javascript handler), assets/script/session.js (function fetchContent), assets/template/flags.html (html template for the content fetched by the fetchContent javascript function and inserted into the HTML div element).
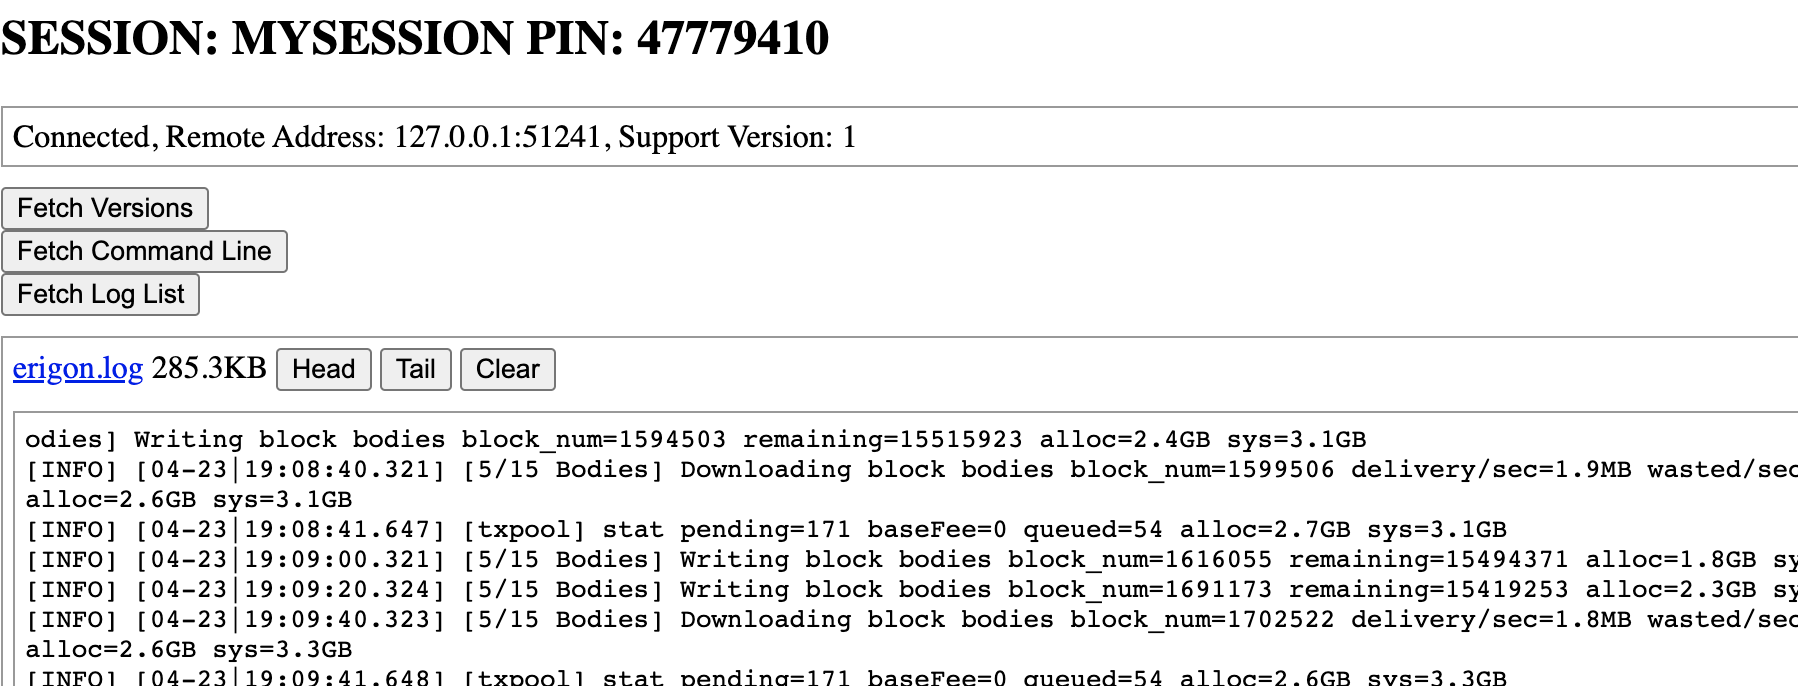
Since version 2.43.0, Erigon nodes write logs by default with INFO level into <datadir>/logs directory, there is log rotation. Using diagnostics system,
these logs can be looked at and downloaded to the operator's computer. Viewing the logs is one of the most frequent requests of the operator to the user,
and it makes sense to make this process much more convenient and efficient. The corresponding code in Erigon is in the file internal/erigon_node/erigon_client.go.
Note that the codes does not give access to any other files in the file system, only to the directory dedicated to the logs.
The code on the side of the diagnostics system is spread across files api/ui_handler.go (invocation of LogTail, LogHead, LogList and LogDownload methods),
internal/erigon_node/erigon_client.go, assets/template/session.html (html template, the part where the button Fetch Logs is defined with
the javascript handler), assets/script/session.js (function fetchContent), assets/template/log_list.html (html template
for the content fetched by the fetchContent javascript function and inserted into the HTML div element), assets/template/log_read.html (html template
for the buttons Head, Tail and Clear with the invocations of fetchLogPart and clearLog javascript functions, as well as construction of the
HTML link that activates the download of a log file). The download of a log file is implemented by the transmitLogFile function inside internal/erigon_client.go.
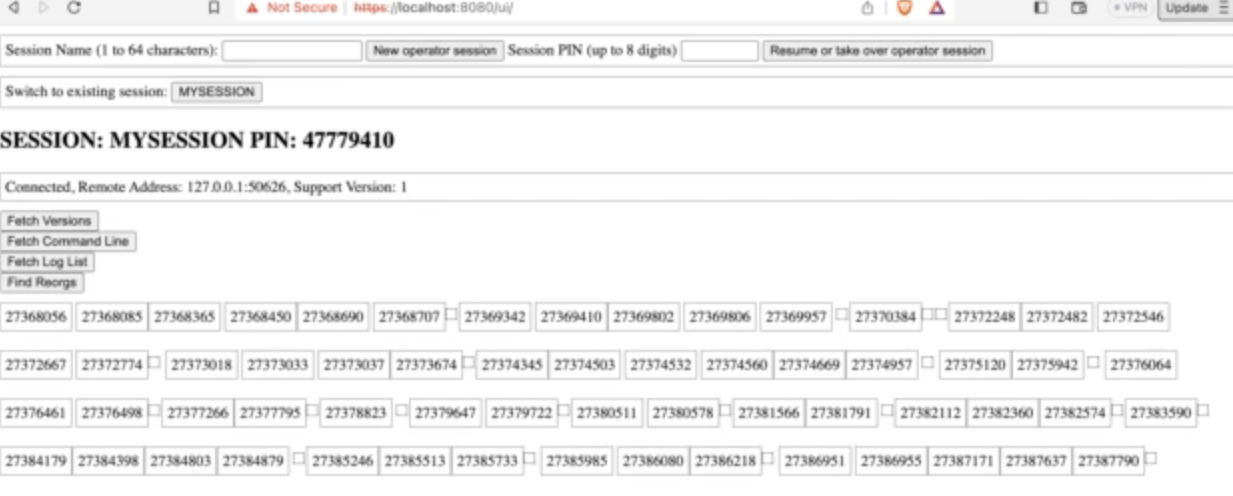
This is the first very crude example of how diagnostics system can access Erigon node's database remotely, via erigon support tunnel. Re-orgs can be identified by
the presence of multiple block headers with the same block height but different block hashes.
One of the ideas for the further development of the diagnostics system is the addition of many more such useful "diagnostics scripts", that could be run against Erigon's node's database, to check the state of the node, or certain inconsistencies etc.
The corresponding code in Erigon is in the file internal/sessions/cache.go, and it relies on a feature recently added to the Erigon's code, which is
mdbx.PathDbMap(), the global function that returns the mapping of all currently open MDBX environments (databases), keyed by the paths to their directories in the filesystem.
This allows cache.go to create a read-only transaction for any of these environments (databases) and provide remote reading by the diagnostics system.
The code on the side of the diagnostics system is internal/erigon_node/reorgs.go. The function findReorgs generates HTML piece by piece, executing two different html templates
(assets/template/reorg_spacer.html and assets/template/reorg_block.html). These continuously generated HTML lines are picked up by javascript function findReorgs
in file assets/script/session.js, which appends them to innerHTML field of the div element. This creates an effect of animation, notifying the operator of the
progress of the scanning for reorgs (with spacer html pieces, one for each 1000 blocks), and showing intermediate results of the scan (with block html pieces,
one for each reorged block found).
This is another example of how the diagnostics system can access the Erigon node's database remotely, via erigon support tunnel.
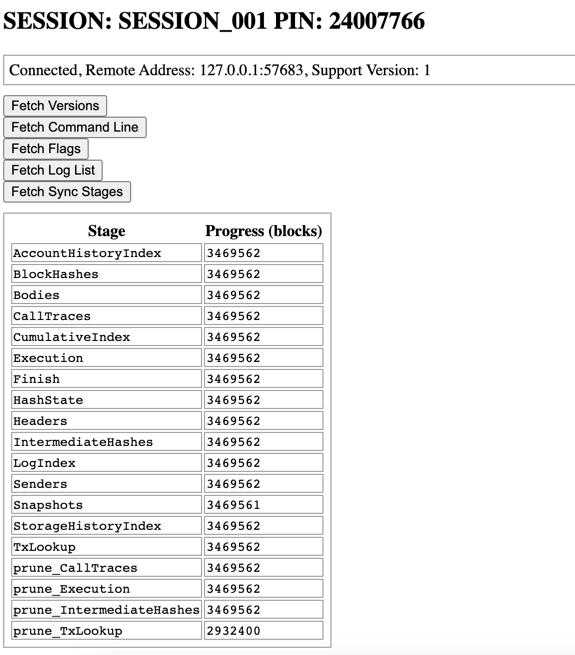
This feature adds an ability to see the node's sync stage, by returning the number of synced blocks per stage.
The code on the side of the diagnostics system is spread across files api/ui_handler.go (invocation of SyncStages method), internal/erigon_node/sync_stages.go, cmd/remote_db.org (using the same remote database access logic as Reorg Scanner), assets/template/session.html
(HTML template the part where the button Fetch Sync Stages is defined with the javascript handler), assets/script/session.js (function fetchContent), assets/template/sync_stages.html
(HTML template for the content fetched by the fetchContent javascript function and inserted into the HTML table).
This is another crude example of monitoring an algorithm involving many items transitoning through series of states. On the erigon side, the code is spread across dataflow/stages.go and diagnostics/header_downloader_stats.go. The parameters considered for monitoring are decided based on header download states used in turbo/stages/headerdownload/header_algos.go and eth/stagedsync/stage_headers.go.
The header downloader algorithm on the diagnostics system side is stored in headers_download.go file. The code in the file is reused from the bodies_download.go file which contains the code for fetching the bodies download state from erigon.
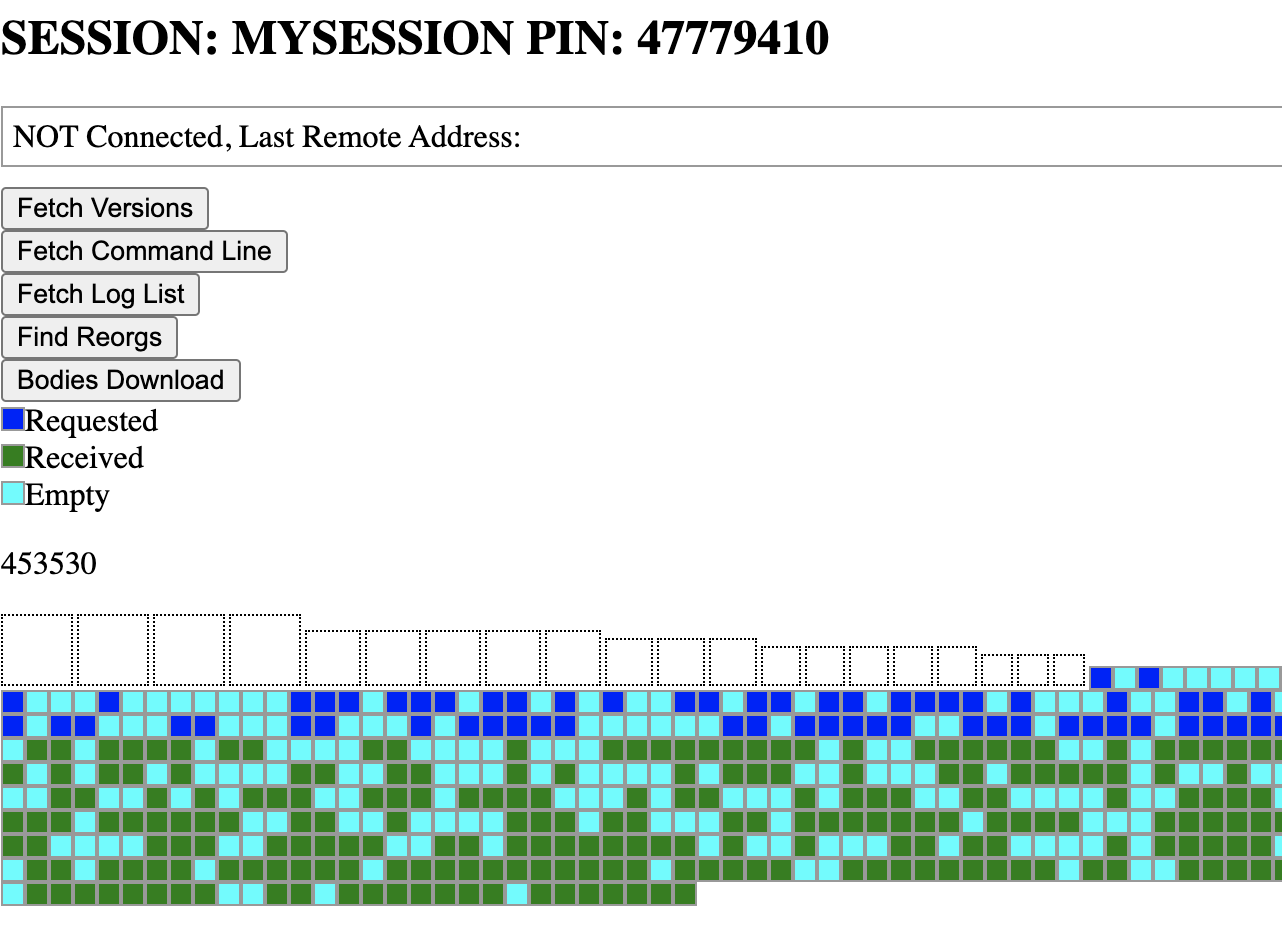
This is the first crude example of monitoring an algorithms involving many items (in that case block bodies) transitioning through the series of states.
On the Erigon side, the code is spread across files dataflow/stages.go, where the states of each block body in the downloading algorithm are listed,
and the structure States is described. This structure allows the body downloader algorithm (in the files eth/stagedsync/stage_bodies.go and
turbo/stages/bodydownload/body_algos.go) to invoke AddChange to report the change of state for any block number. The structure States intends to
have a strict upper bound on memory usage and to be very allocation-light. On the other hand, the function ChangesSince is called by the code in
diagnostics/block_body_download.go to send the recent history of state changes to the diagnostics system (via logical tunnel of erigon support of course).
On the side of the diagnostics system, in the file cmd/bodies_download.go, there are two functions. One, bodies_download is generating output
HTML representing the current view of some limited number of block bodies being downloaded (1000). This function keeps querying the Erigon node
roughly every second and re-generates the HTML (using template in assets/template/body_download.hml). The re-generated HTML is written to, and is
consumed by the javascript function bodiesDownload in the assets/script/session.js, which keeps replacing the innerHTML field in a div element
whenever the new HTML piece is available.
Each state is represented by a distinct colour, with the colour legend is also defined in the template file.
If you are looking at this because you would like to apply to be a part of Erigon development team, the best you can do is to try to first run the diagnostics system locally as described above, then study the code in the repository and think of a way to improve it. This repository has been initially created by a person with very little experience in web server development, web design, javascript, and, more crucially, it has been created in a bit of a rush. Therefore, there should be a lot of things that can be improved in terms of best practices, more pleasant user interface, code simplicity, etc.
There are some functional improvements that could be quite useful, for example:
- Reorg scanner is very basic and it does not have a concept of a "deep" reorg (deeper than 1 block). For such situations, it will just show the consecutive block numbers as all having a reorg. It would be better to aggregate these into deep reorgs, and also perhaps show if there are more than 1 branch at each reorg point.
- For the reorg scanner, add the ability to click on the block numbers and get more information about that particular reorg, for example, block producers for each of the block participating in the reorg, or difference in terms of transactions.
- Adding more "diagnostics scripts" that remotely read DB to check for the current progress of stages in the staged sync.
- Adding a monitoring for header downloader as well as for body downloader.
- Perhaps embedding some metrics visualisation (have no idea how to do it), since all "prometheus"-style metrics are also available to the diagnostics system?
- Ability to extract and analyse go-routine stack traces from Erigon node. To start with, extract something like
debug/pprof/goroutine?debug=2, but for Erigon this would likely result in a lot of go-routines (thousands) with similar traces related to peer management. Some analysis should group them into cluster of similar stack traces and show them as aggregates. - Add log rotation system similar to what has recently been done for Erigon (using lumberjack library).

