This examples intention is to use python 2.7 as a Stochastic (Commerically known as Machine Learning) programming tool.
To install Python go to https://www.python.org/downloads/
In order to run this example you need to install the following dependencies
numpy sklearn matplotlib pandas
To install them use pip. First run the following command to know if pip is already installed:
pip --version
You must see the pip's version installed
If you don't have pip installed use this command:
curl -L https://bootstrap.pypa.io/get-pip.py | python
Once you have pip already installed run:
pip install numpy sklearn matplotlib pandas
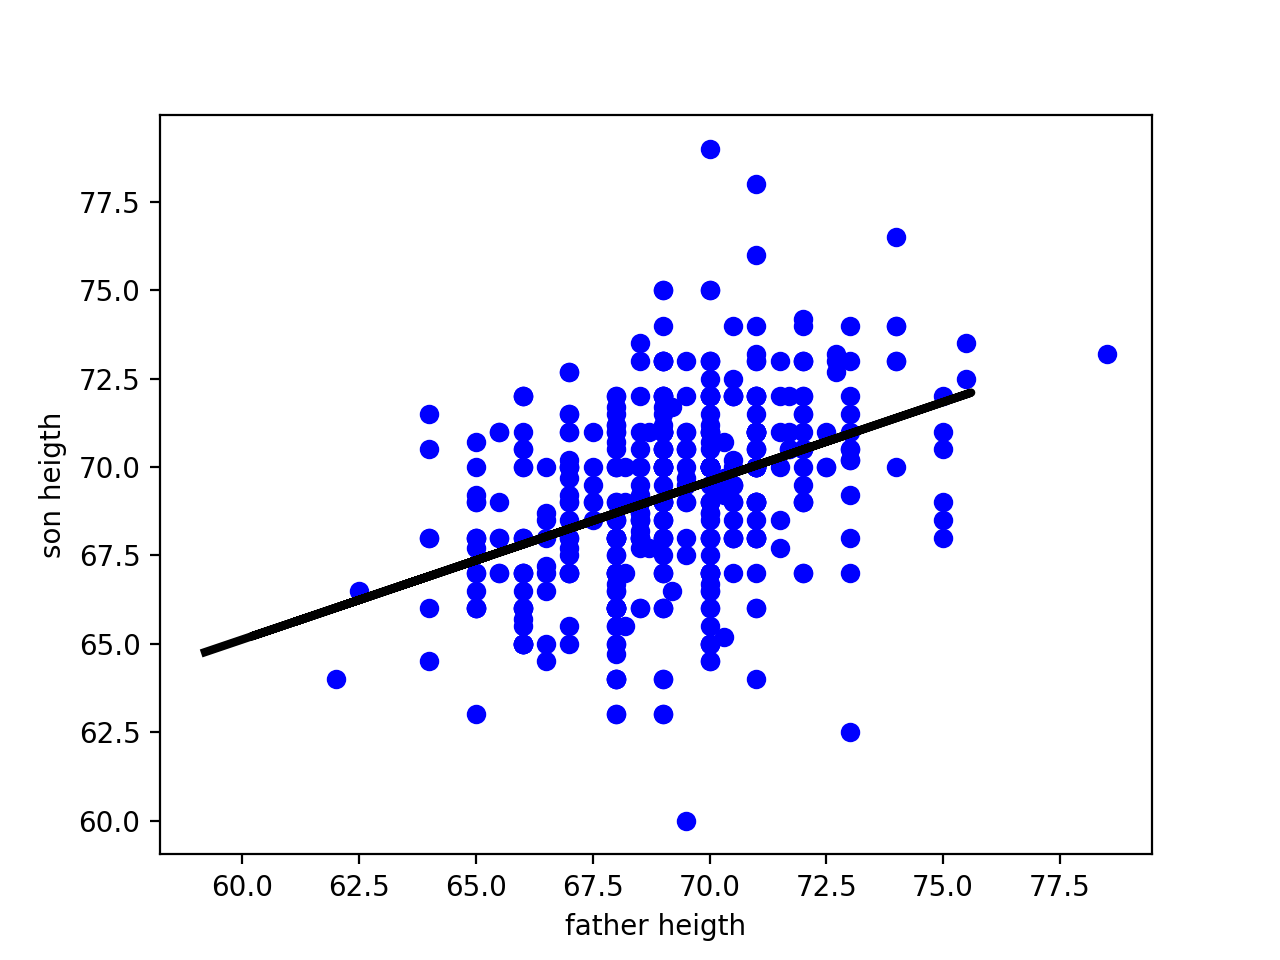
This example is based on the famous Pearson's Father and Son Data analysis for statitsticall analysis. https://en.wikipedia.org/wiki/Karl_Pearson. It intent to predict the heights of a a father's son given a bunch of previous data about that relationship
To execute the example run
python LinearRegression.py
The result must be something like:
   fatherheight  sonheight
0          78.5       73.2
1          75.5       73.5
2          75.5       72.5
3          75.0       71.0
4          75.0       70.5

Training
Giving the data set
[[72.8], [61.1], [67.4], [70.2], [75.6], [60.2], [65.3], [59.2]]
The predictions are
[ 70.85496061  65.61630997  68.43712185  69.69081602  72.10865478
  65.21333685  67.49685123  64.76558893]
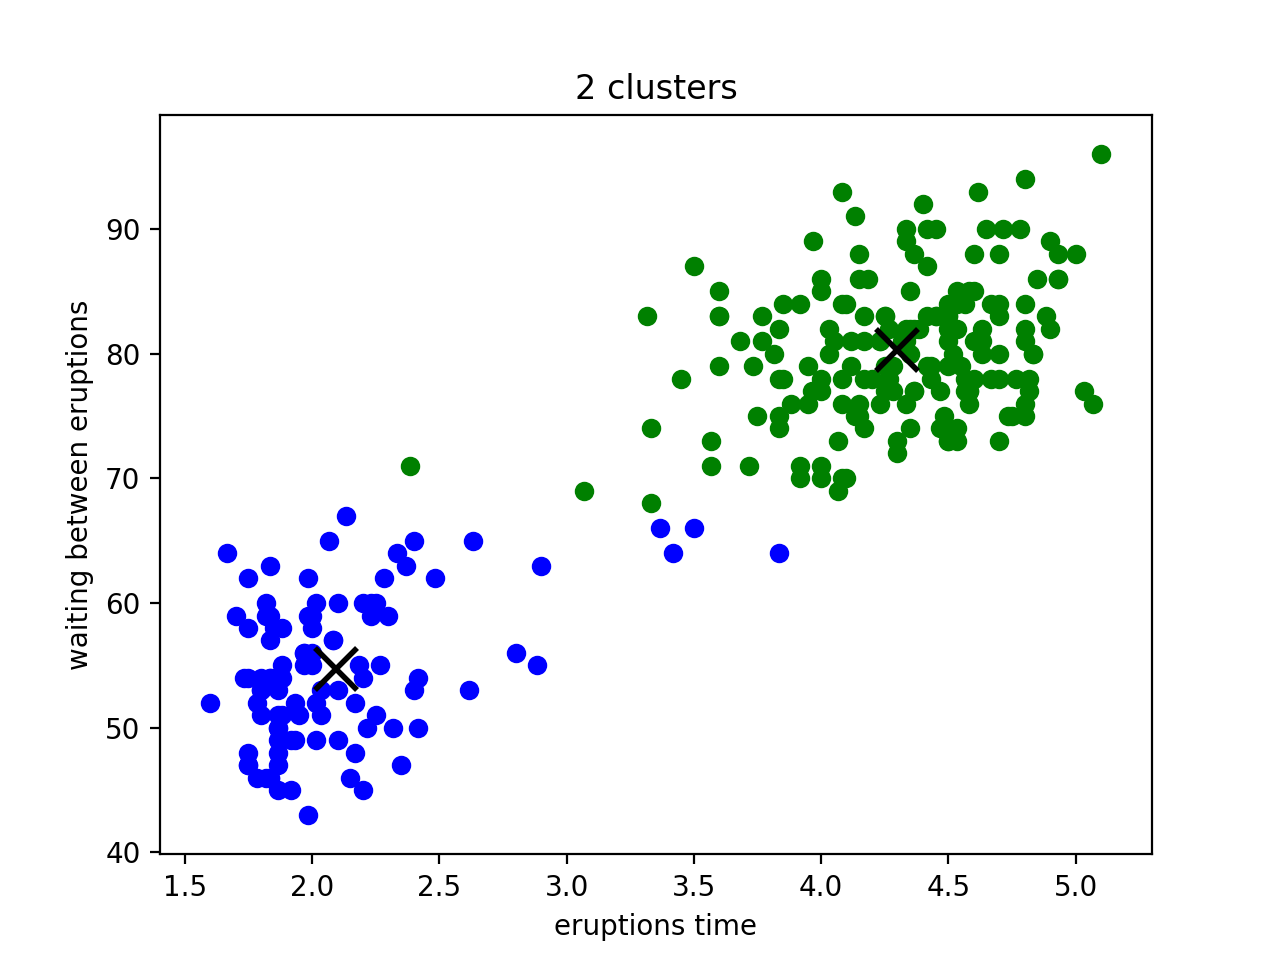
This example is a K-means analysis of the volcanic eruptions duration and waiting time until the next eruption. The objective is to cluster a particular eruption.
The dataset was obtained in this link https://archive.ics.uci.edu/ml/datasets/car+evaluation
You can change the number of clusters in the variable k after the imports part in the LinearRegression.py file
To execute this example you need to run
python K-meansClustering.py
And you'll see an output like:
[0 0 1 0 1 0]
This example use a Tree Decision Tree to Classify the cars according to the given data.
The dataset comes from https://archive.ics.uci.edu/ml/datasets/car+evaluation and its changed a little bit. I just switch string for numbers using find and replace :p.
####Execution
The execution for this example is the same as is for the other ones
pytnon DecisionTree.py

