OpenMetrics exporter for Pure Storage FlashBlade.
This exporter is provided under Best Efforts support by the Pure Portfolio Solutions Group, Open Source Integrations team. For feature requests and bugs please use GitHub Issues. We will address these as soon as we can, but there are no specific SLAs.
This application aims to help monitor Pure Storage FlashBlades by providing an "exporter", which means it extracts data from the Purity API and converts it to the OpenMetrics format, which is for instance consumable by Prometheus.
The stateless design of the exporter allows for easy configuration management as well as scalability for a whole fleet of Pure Storage systems. Each time Prometheus scrapes metrics for a specific system, it should provide the hostname via GET parameter and the API token as Authorization token to this exporter.
To monitor your Pure Storage appliances, you will need to create a new dedicated user on your array, and assign read-only permissions to it. Afterwards, you also have to create a new API key.
The exporter is a Go application based on the Prometheus Go client library and Resty, a simple but reliable HTTP and REST client library for Go . It is preferably built and launched via Docker. You can also scale the exporter deployment to multiple containers on Kubernetes thanks to the stateless nature of the application.
docker pull quay.io/purestorage/pure-fb-om-exporter:<release>where the release tag follows the semantic versioning.
Binary downloads of the exporter can be found on the Releases page.
The following commands describe how to run a typical build :
# clone the repository
git clone git@github.com:PureStorage-OpenConnect/pure-fb-openmetrics-exporter.git

# modify the code and build the package
cd pure-fb-openmetrics-exporter
...
make build
The newly built exporter executable can be found in the ./out/bin directory.
Optionally, to build the binary with the vendor cache, you may use
make build-with-vendor
The provided dockerfile can be used to generate a docker image of the exporter. It accepts the version of the package as the build parameter, therefore you can build the image using docker as follows
docker build -t pure-fb-ome:$VERSION .Authentication is used by the exporter as the mechanism to cross authenticate to the scraped appliance, therefore for each array it is required to provide the REST API token for an account that has a 'readonly' role. The api-token can be provided in two ways
- using the HTTP Authorization header of type 'Bearer', or
- via a configuration map in a specific configuration file.
The first option requires specifying the api-token value as the authorization parameter of the specific job in the Prometheus configuration file. The second option provides the FlashBlade/api-token key-pair map for a list of arrays in a simple YAML configuration file that is passed as parameter to the exporter. This makes possible to write more concise Prometheus configuration files and also to configure other scrapers that cannot use the HTTP authentication header.
The exporter can be started in TLS mode (HTTPS, mutually exclusive with the HTTP mode) by providing the X.509 certificate and key files in the command parameters. Self-signed certificates are also accepted.
usage: pure-fb-om-exporter [-h|--help] [-a|--address "<value>"] [-p|--port <integer>] [-d|--debug] [-t|--tokens <file>] [-k|--key <file>] [-c|--cert <file>]

                           Pure Storage FB OpenMetrics exporter

Arguments:

  -h  --help     Print help information
  -a  --address  IP address for this exporter to bind to. Default: 0.0.0.0
  -p  --port     Port for this exporter to listen. Default: 9491
  -d  --debug    Enable debug. Default: false
  -t  --tokens   API token(s) map file
  -c  --cert     SSL/TLS certificate file. Required only for TLS
  -k  --key      SSL/TLS private key file. Required only for TLS
The array token configuration file must have to following syntax:
<array_id1>:
  address: <ip-address>|<hosname1>
  api_token: <api-token1>
<array_id2>:
  address: <ip-address2>|<hostname2>
  api_token: <api-token2>
...
<array_idN>:
  address: <ip-addressN>|<hostnameN>
api_token: <api-tokenN>The exporter uses a RESTful API schema to provide Prometheus scraping endpoints.
Authentication
Authentication is used by the exporter as the mechanism to cross authenticate to the scraped appliance, therefore for each array it is required to provide the REST API token for an account that has a 'readonly' role. The api-token must be provided in the http request using the HTTP Authorization header of type 'Bearer'. This is achieved by specifying the api-token value as the authorization parameter of the specific job in the Prometheus configuration file.
The exporter understands the following requests:
| URL | GET parameters | description |
|---|---|---|
| http://<exporter-host>:<port>/metrics | endpoint | Full array metrics |
| http://<exporter-host>:<port>/metrics/array | endpoint | Array metrics |
| http://<exporter-host>:<port>/metrics/clients | endpoint | Clients metrics |
| http://<exporter-host>:<port>/metrics/usage | endpoint | Quotas usage metrics |
| http://<exporter-host>:<port>/metrics/policies | endpoint | NFS policies info metrics |
Depending on the target array, scraping for the whole set of metrics could result into timeout issues, in which case it is suggested either to increase the scraping timeout or to scrape each single endpoint instead.
In a typical production scenario, it is recommended to use a visual frontend for your metrics, such as Grafana. Grafana allows you to use your Prometheus instance as a datasource, and create Graphs and other visualizations from PromQL queries. Grafana, Prometheus, are all easy to run as docker containers.
To spin up a very basic set of those containers, use the following commands:
# Pure exporter
docker run -d -p 9491:9491 --name pure-fb-om-exporter quay.io/purestorage/pure-fb-om-exporter:<version>

# Prometheus with config via bind-volume (create config first!)
docker run -d -p 9090:9090 --name=prometheus -v /tmp/prometheus-pure.yml:/etc/prometheus/prometheus.yml -v /tmp/prometheus-data:/prometheus prom/prometheus:latest

# Grafana
docker run -d -p 3000:3000 --name=grafana -v /tmp/grafana-data:/var/lib/grafana grafana/grafana
Please have a look at the documentation of each image/application for adequate configuration examples.
A simple but complete example to deploy a full monitoring stack on kubernetes can be found in the examples directory
- Pure FlashBlade REST APIs are not designed for efficiently reporting on full clients and objects quota KPIs, therefrore it is suggested to scrape the "array" metrics preferably and use the "clients" and "usage" metrics individually and with a lower frequency than the other.. In any case, as a general rule, it is advisable to do not lower the scraping interval down to less than 30 sec. In case you experience timeout issues, you may want to increase the Prometheus scraping timeout and interval approriately.
| Metric Name | Description |
|---|---|
| purefb_alerts_open | FlashBlade open alert events |
| purefb_info | FlashBlade system information |
| purefb_array_http_specific_performance_latency_usec | FlashBlade array HTTP specific latency |
| purefb_array_http_specific_performance_throughput_iops | FlashBlade array HTTP specific throughput |
| purefb_array_nfs_specific_performance_latency_usec | FlashBlade array NFS specific latency |
| purefb_array_nfs_specific_performance_throughput_iops | FlashBlade array NFS specific throughput |
| purefb_array_performance_latency_usec | FlashBlade array latency |
| purefb_array_performance_throughput_iops | FlashBlade array throughput |
| purefb_array_performance_bandwidth_bytes | FlashBlade array throughput |
| purefb_array_performance_average_bytes | FlashBlade array average operations size |
| purefb_array_performance_replication | FlashBlade array replication throughput |
| purefb_array_s3_performance_latency_usec | FlashBlade array latency |
| purefb_array_s3_performance_throughput_iops | FlashBlade array throughput |
| purefb_array_space_data_reduction_ratio | FlashBlade space data reduction |
| purefb_array_space_bytes | FlashBlade space in bytes |
| purefb_array_space_parity | FlashBlade space parity |
| purefb_array_space_utilization | FlashBlade array space utilization in percent |
| purefb_buckets_performance_latency_usec | FlashBlade buckets latency |
| purefb_buckets_performance_throughput_iops | FlashBlade buckets throughput |
| purefb_buckets_performance_bandwidth_bytes | FlashBlade buckets bandwidth |
| purefb_buckets_performance_average_bytes | FlashBlade buckets average operations size |
| purefb_buckets_s3_specific_performance_latency_usec | FlashBlade buckets S3 specific latency |
| purefb_buckets_s3_specific_performance_throughput_iops | FlashBlade buckets S3 specific throughput |
| purefb_buckets_space_data_reduction_ratio | FlashBlade buckets space data reduction |
| purefb_buckets_space_bytes | FlashBlade buckets space in bytes |
| purefb_clients_performance_latency_usec | FlashBlade clients latency |
| purefb_clients_performance_throughput_iops | FlashBlade clients throughput |
| purefb_clients_performance_bandwidth_bytes | FlashBlade clients bandwidth |
| purefb_clients_performance_average_bytes | FlashBlade clients average operations size |
| purefb_file_systems_performance_latency_usec | FlashBlade file systems latency |
| purefb_file_systems_performance_throughput_iops | FlashBlade file systems throughput |
| purefb_file_systems_performance_bandwidth_bytes | FlashBlade file systems bandwidth |
| purefb_file_systems_performance_average_bytes | FlashBlade file systems average operations size |
| purefb_file_systems_space_data_reduction_ratio | FlashBlade file systems space data reduction |
| purefb_file_systems_space_bytes | FlashBlade file systems space in bytes |
| purefb_hardware_health | FlashBlade hardware component health status |
| purefb_hardware_connectors_performance_throughput_pkts | FlashBlade hardware connectors performance throughput |
| purefb_hardware_connectors_performance_bandwidth_bytes | FlashBlade hardware connectors performance bandwidth |
| purefb_shardware_connectors_performance_errors | FlashBlade hardware connectors performance errors per sec |
| purefb_file_system_usage_users_bytes | FlashBlade file system users usage |
| purefb_file_system_usage_groups_bytes | FlashBlade file system groups usage |
| purefb_nfs_export_rule | FlashBlade NFS export policies information |
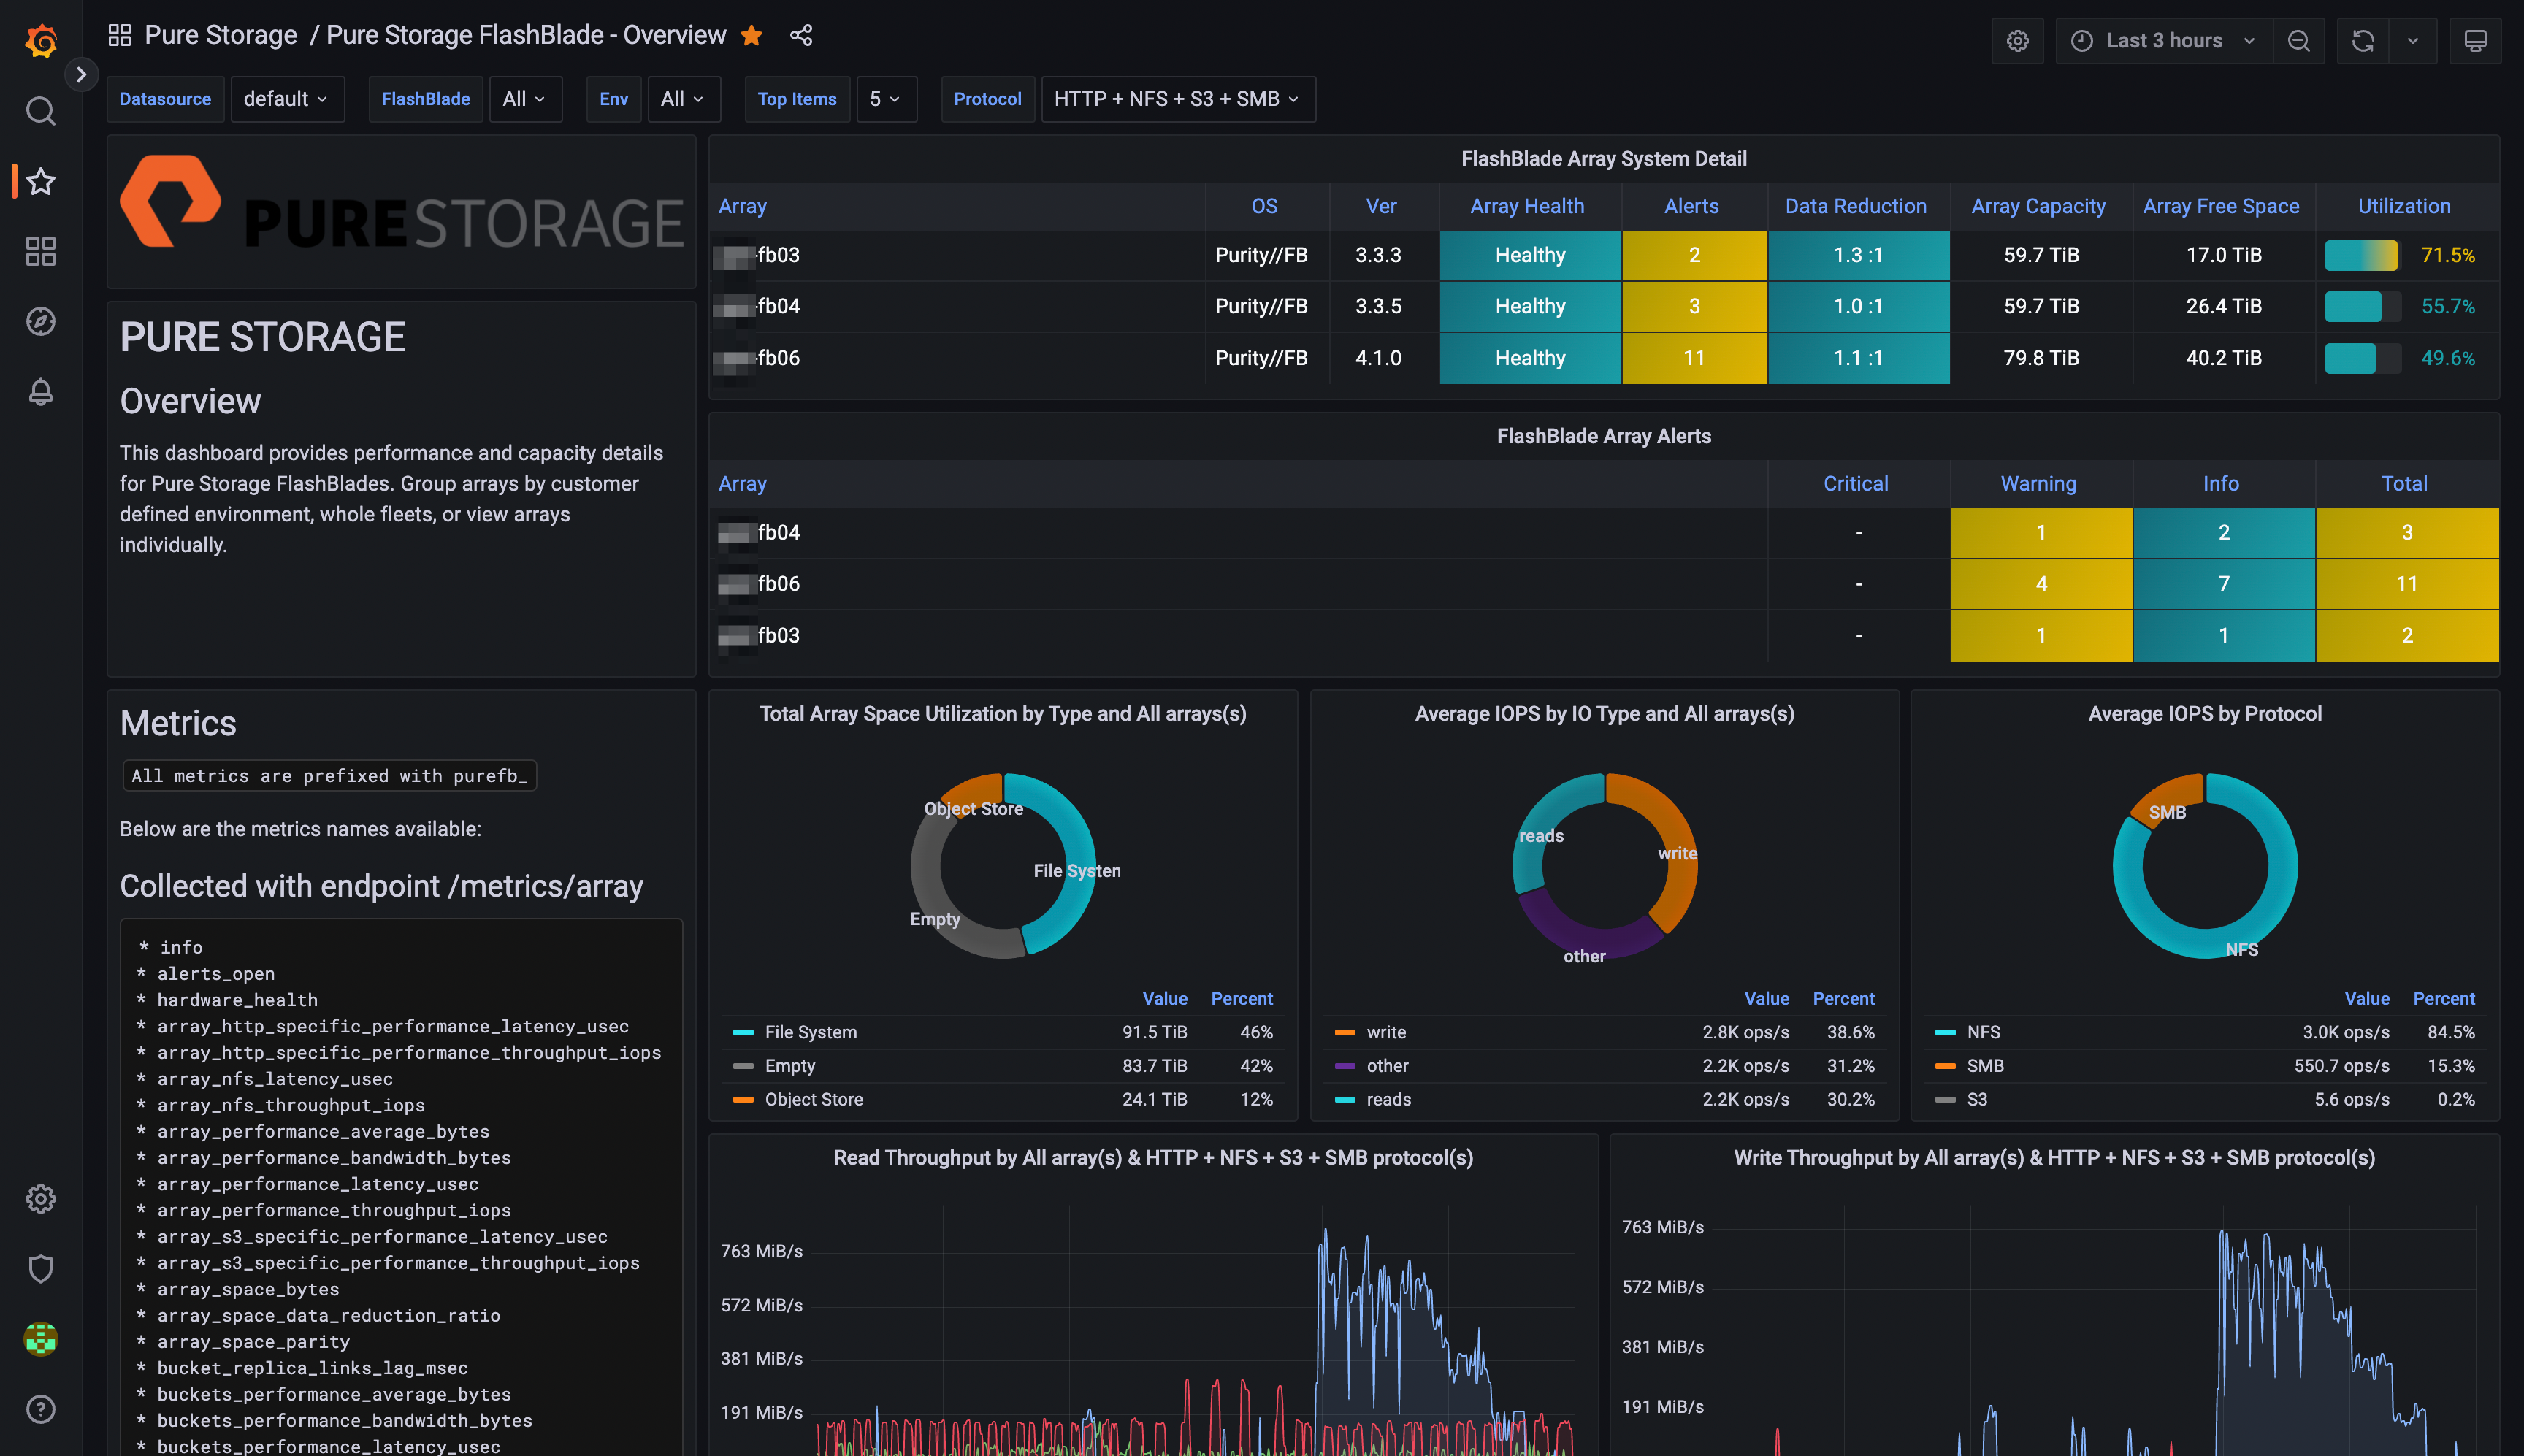
Take a holistic overview of your Pure Storage FlashBlade estate on-premise with Prometheus and Grafana to summarize statistics such as:
- FlashBlade Utilization
- Purity OS version
- Data Reduction Rate
- Number and type of open alerts
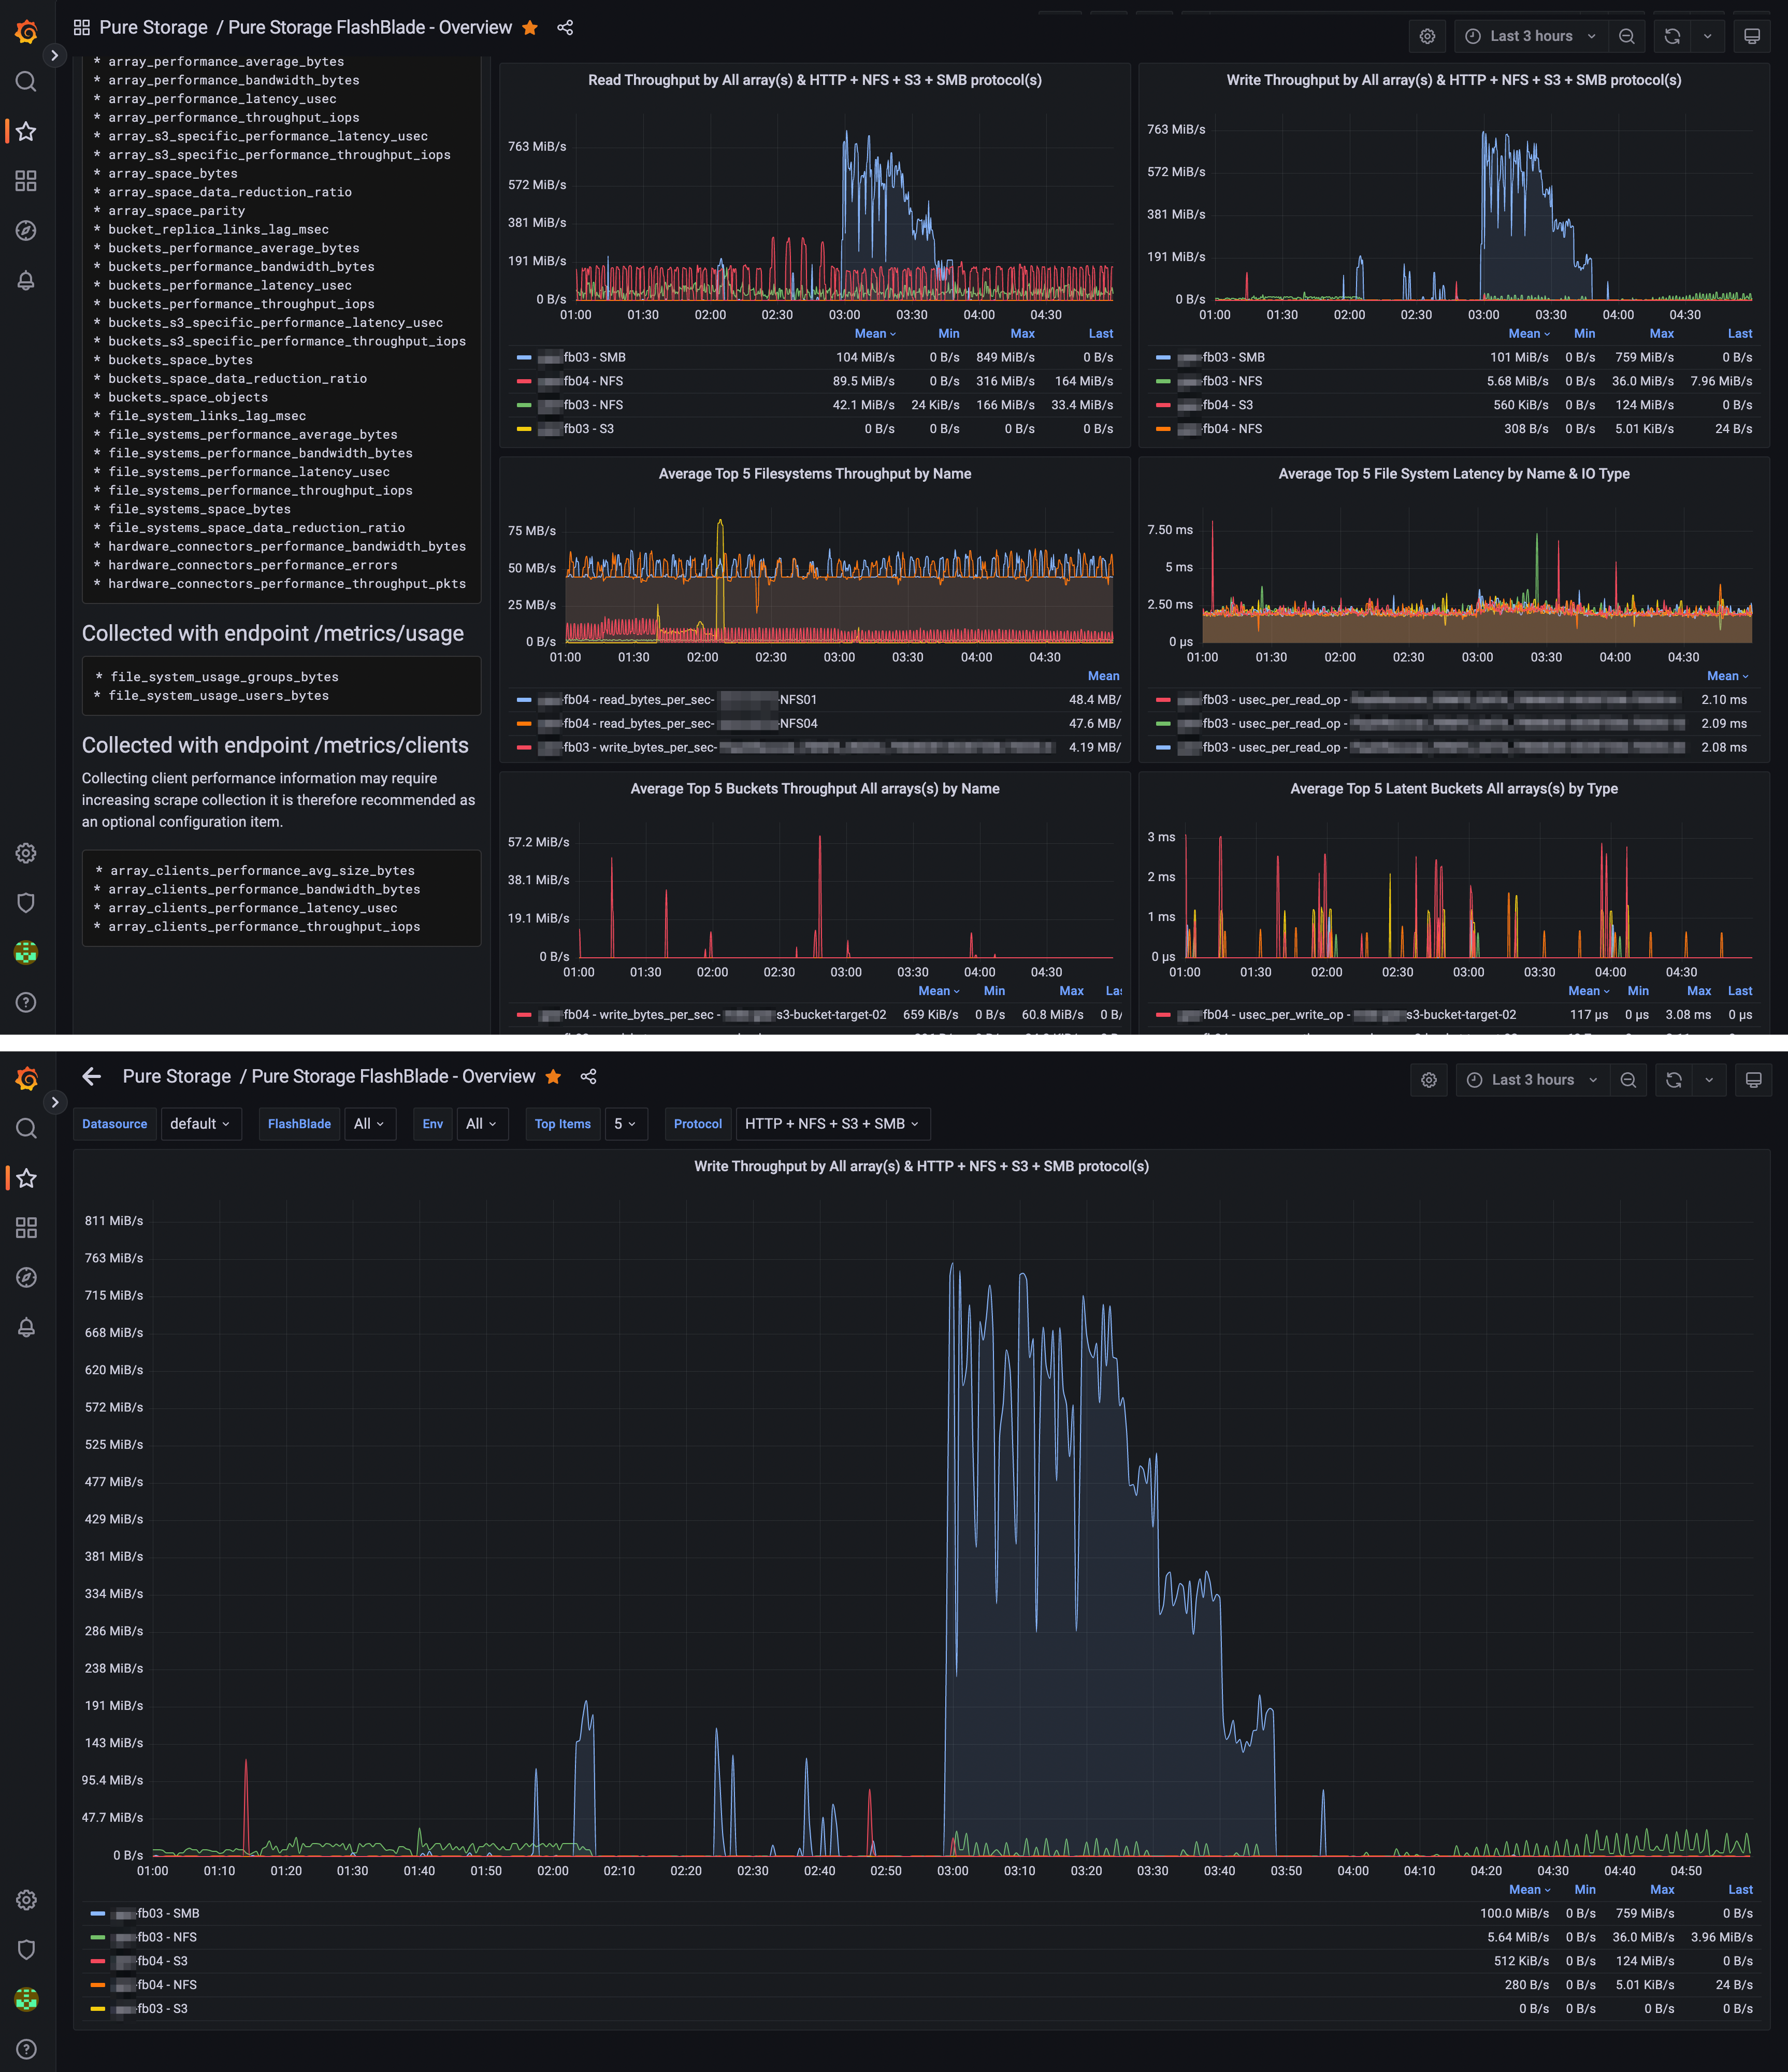
Drill down into specific arrays and identify top busy hosts while correlating read and write operations and throughput to quickly highlight or eliminate investigation enquiries.


For more information on dependencies, and notes to deploy -- take look at the examples for Grafana and Prometheus in the extra/grafana/ and extra/prometheus/ folders respectively.
This project is licensed under the Apache 2.0 License - see the LICENSE file for details
