Stock markets have been crucial for global economy, with prices fluctuating daily. Investors rely heavily on predicting future stock prices by analyzing past performance through graphs, making a stock price dashboard essential for anyone studying the market.
- Visualizing stock price and volume history to deduce value trends.
- Identifying subtle hints in price and volume for insightful analysis.
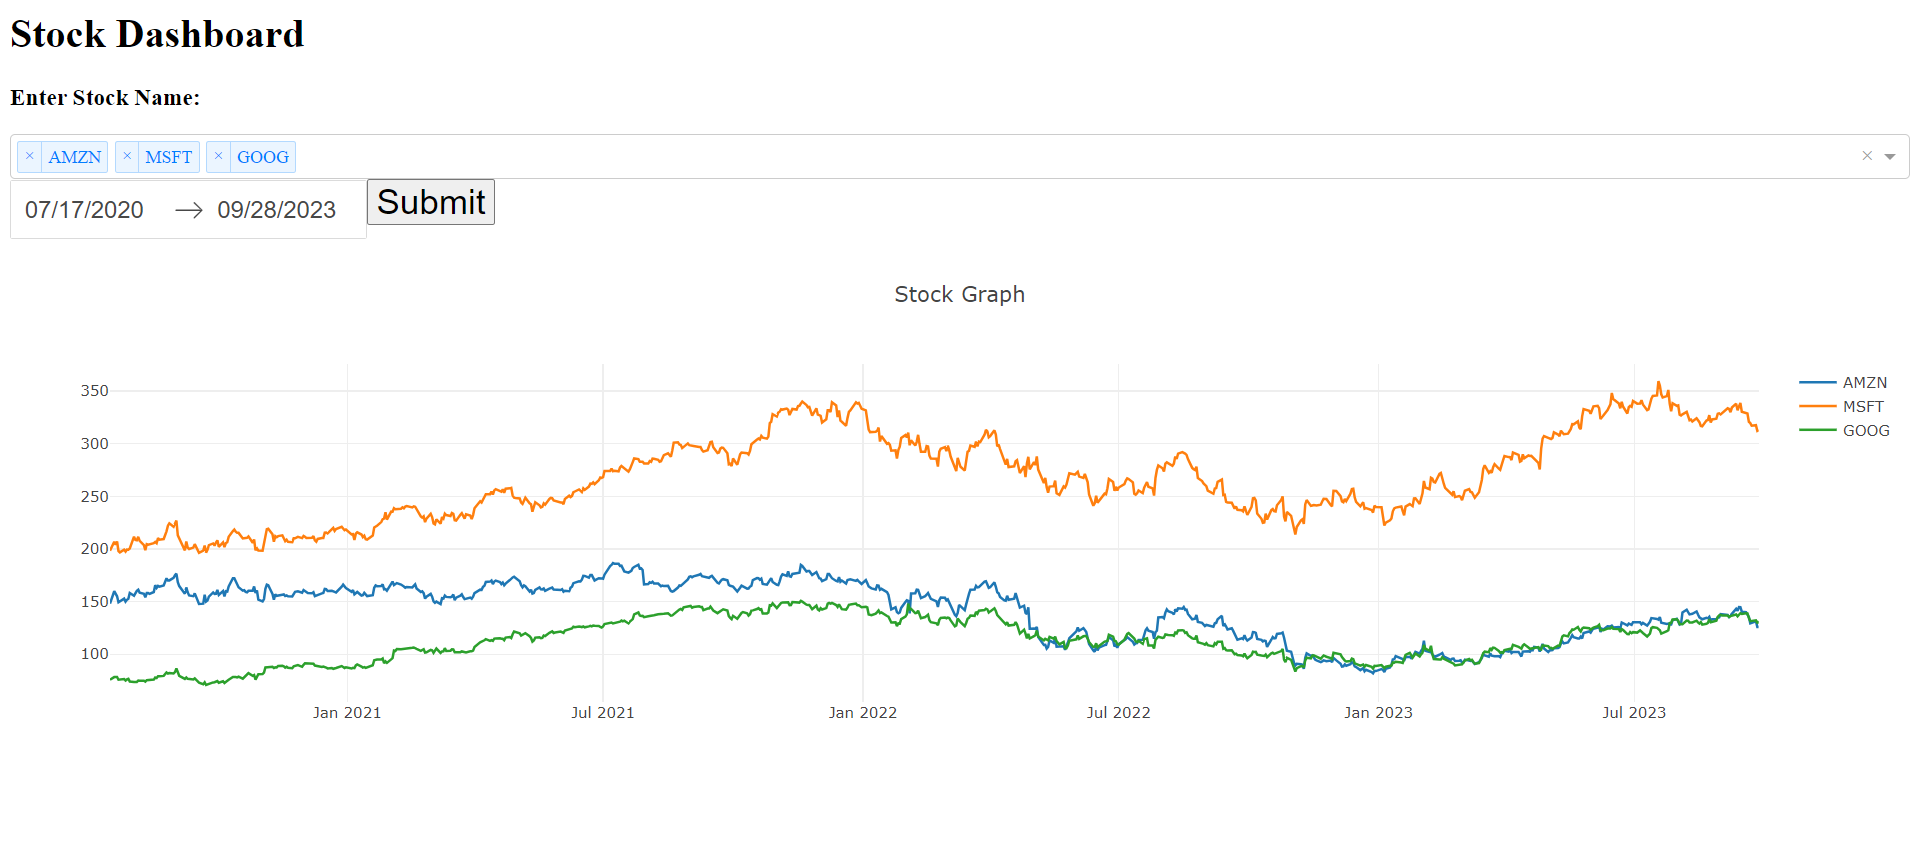
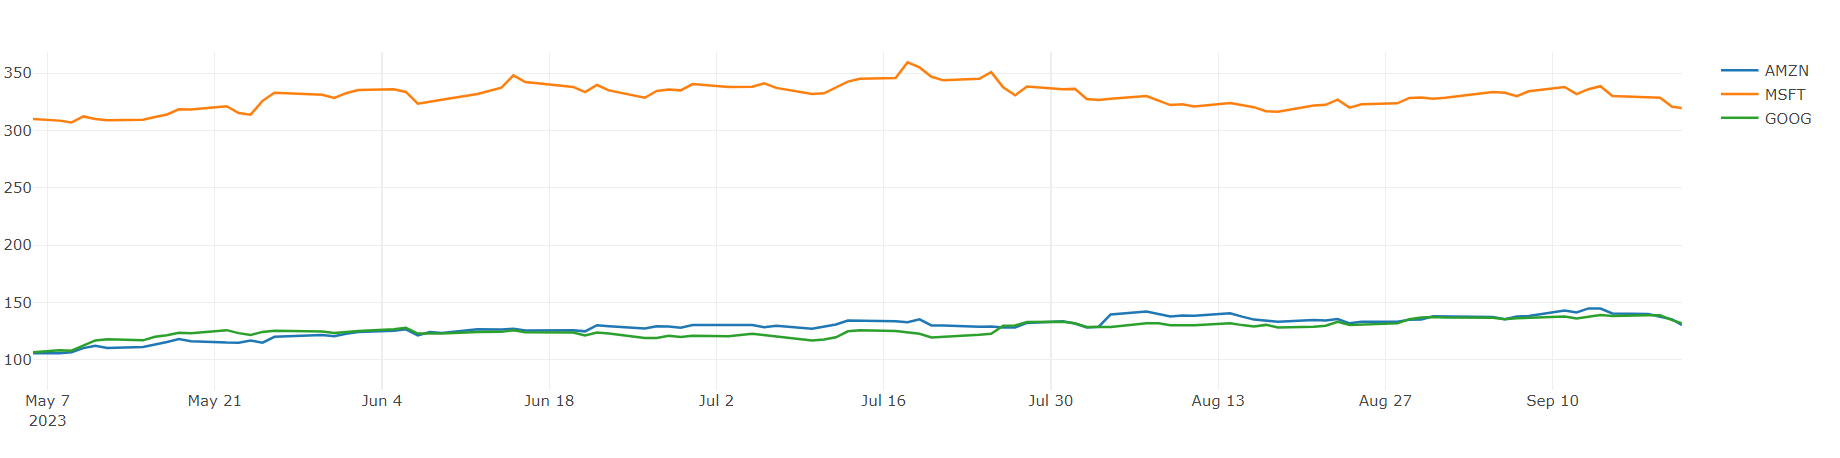
- Comparing performance of multiple stocks over customizable date ranges.
- Analyzing trends for effective and low-risk market entry points.
The Stock Price Dashboard utilizes Plotly and Dash for the frontend, and Python for the backend, providing a user-friendly and interactive experience. Users can create either Visualization Dashboards for individual stock analysis or Comparison Dashboards for side-by-side stock comparisons.

Python, Plotly, Dash, Modern Web Browser.
The dashboard provides real-time stock prices with a selection of 250 companies for analysis and comparison. It offers a range of date selection for historical stock price viewing and comparison.
The dashboard underwent rigorous testing for single and comparison visualizations, proving its reliability and efficiency in providing accurate stock data and visual representations for analysis.

-
Visualization Dashboard:
-
Select company.
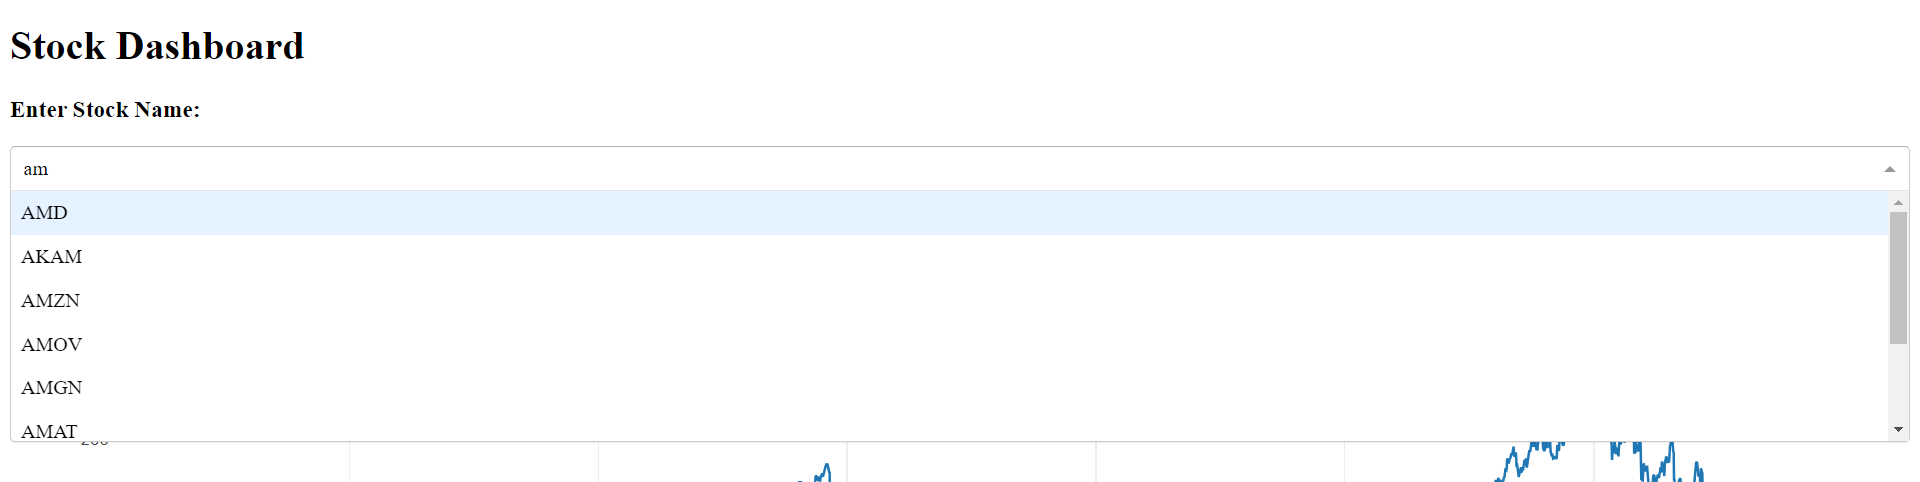
-
Choose date range.
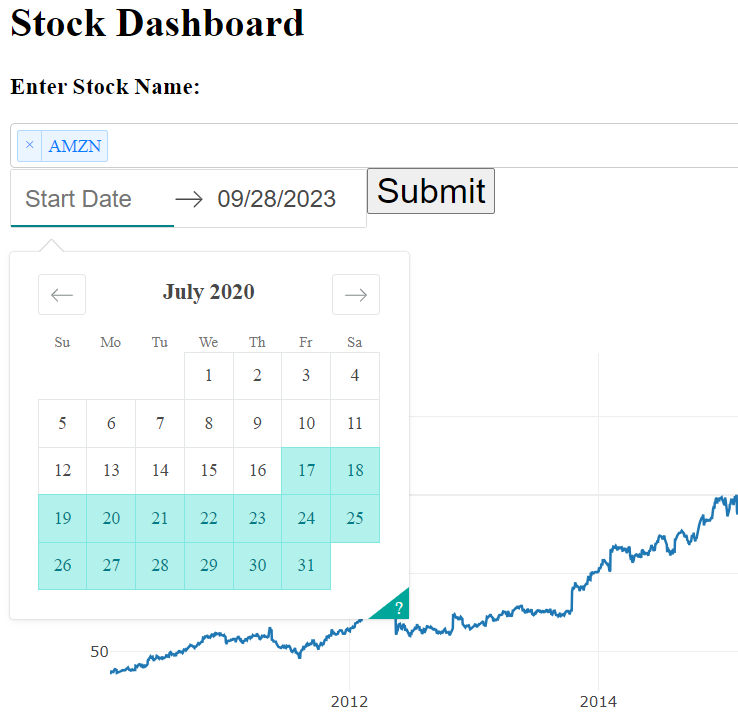
-
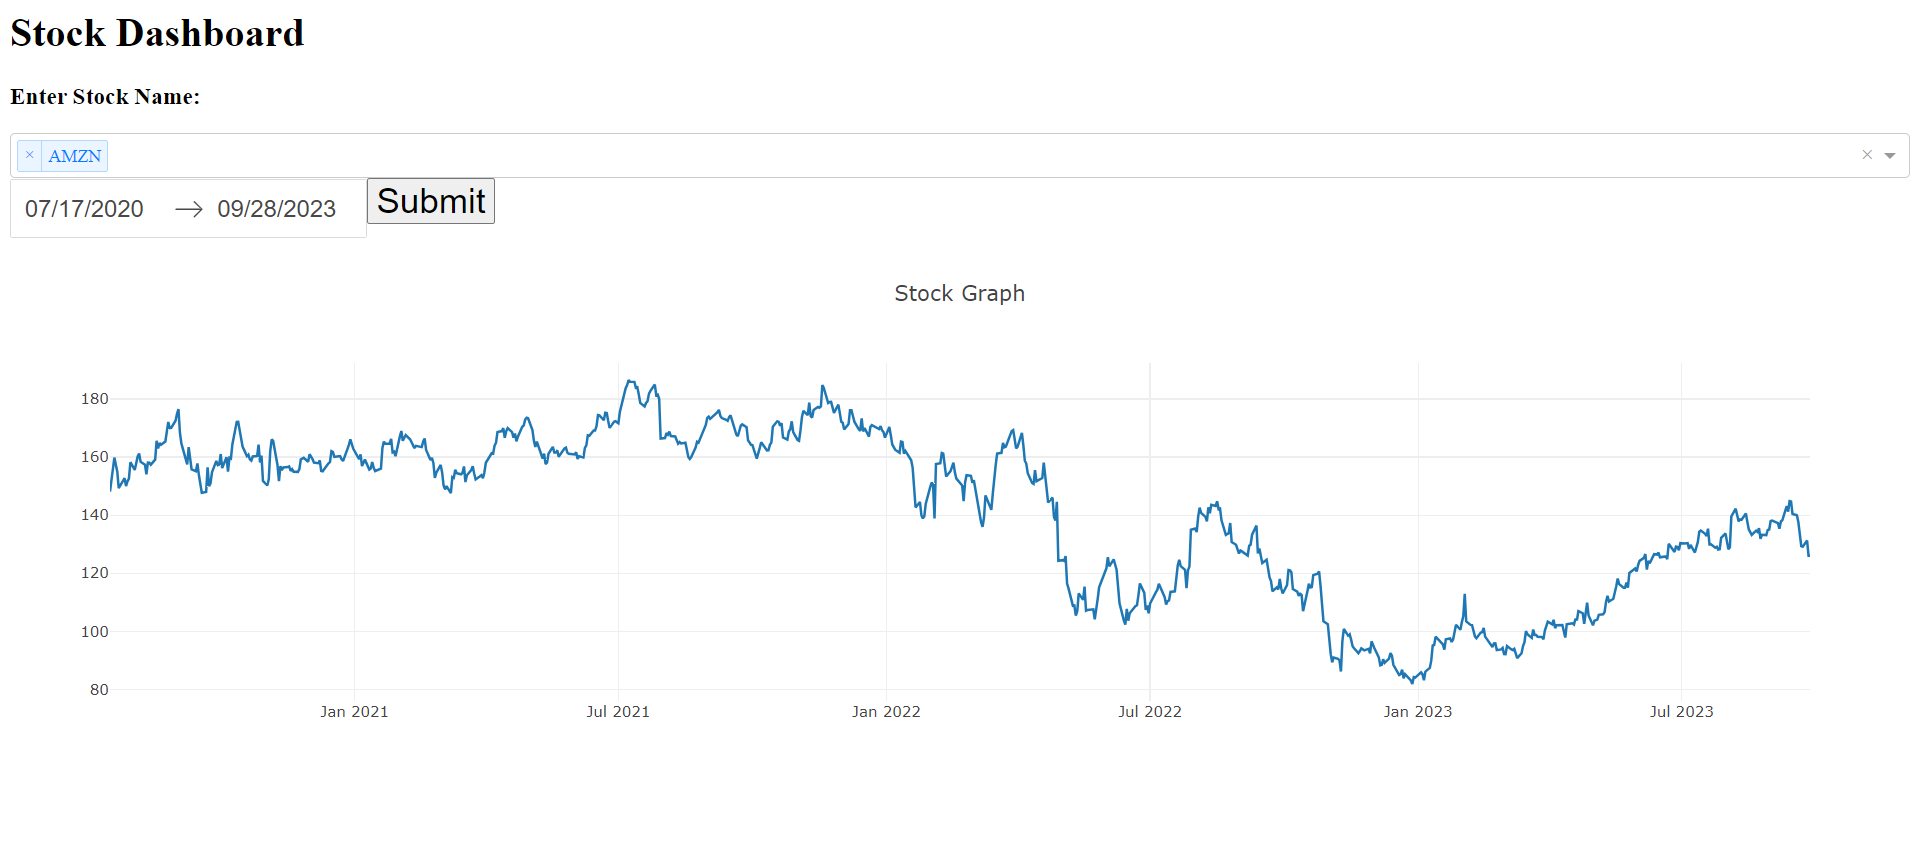
View visualization.
-
-
Comparison Dashboard:
-
Select multiple companies.
-
Choose date range.
-
View comparison.
-


-
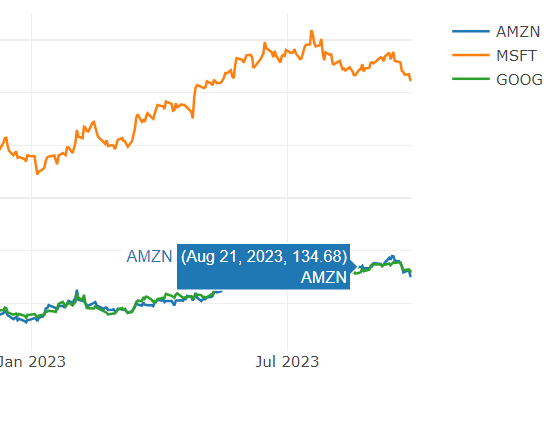
Stock Price, Date, Company Name on Hover
-
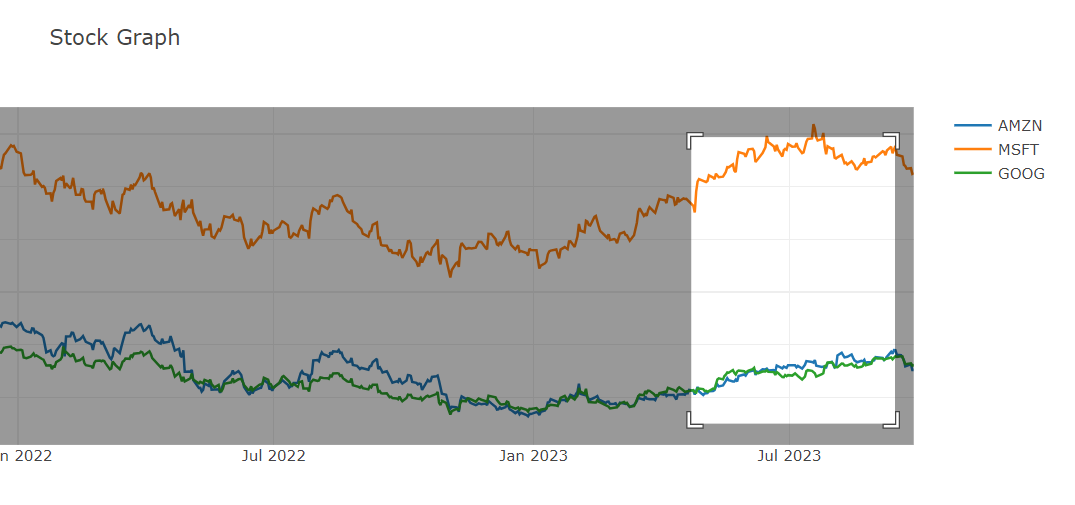
Zoom in feature for better visualization of trends


The Stock Price Dashboard is an invaluable tool for investors and individuals interested in the stock market, providing comprehensive data and analysis options for effective decision making and prediction.