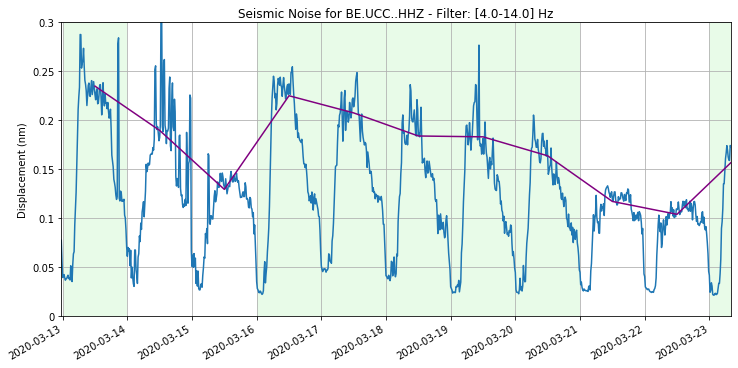
an example simple tutorial for getting seismic data, computing the power spectral densities, extracting the RMS and plotting
Required:
- python
- obspy (and its dependencies)
- pandas
- jupyter
- notebook
this should be easy to set up in a conda env: conda create -c conda-forge -n covid python=3.7 obspy pandas jupyter notebook
Author: Thomas Lecocq @seismotom, Fred Massin @fmassin
Run it interactively on mybinder.org
The following data shows the effect of the Social Distancing measures from the Belgian Government (2020-03-16 at midnight, and 2020-03-18 at midday):
