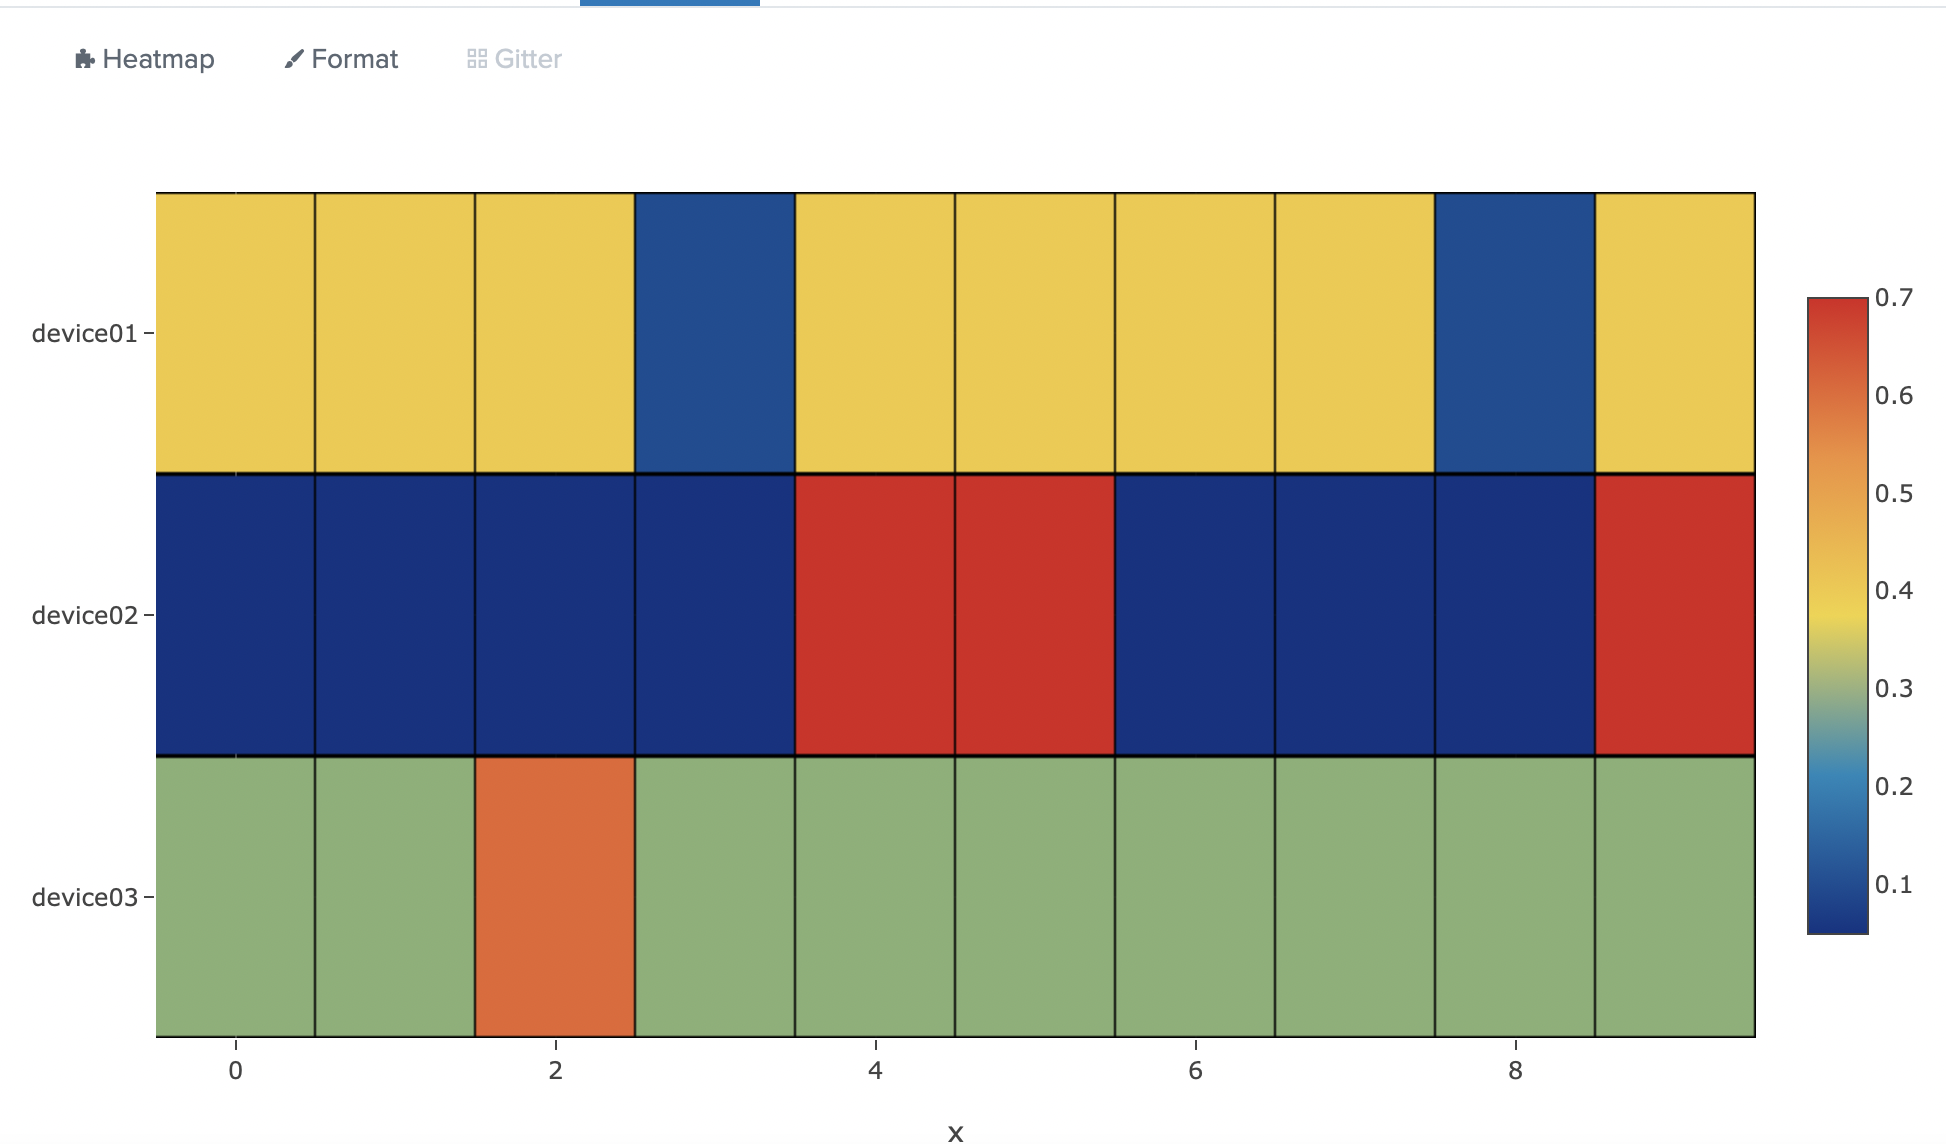
This app has been published on Splunkbase. This is a custom visualization for Splunk which uses the plotly js library together with the Splunk custom visualization API.
This Repo currently contains the following visualizations:
- heatmap
- Download and install Splunk
- Download this repository and unpack it
- copy the folder to your apps directory
$SPLUNK_HOME/etc/apps/of your splunk installation - Restart splunk to apply changes either with
$SPLUNK_HOME/bin/splunk restartor from the UI
- Type your search
- The search should contain the following fields
xValues, and additionals fields that will make up theyValuesaxis names of the heatmap - The
zValuesarray will be taken from all fields except thexValuesfield - Click on tab
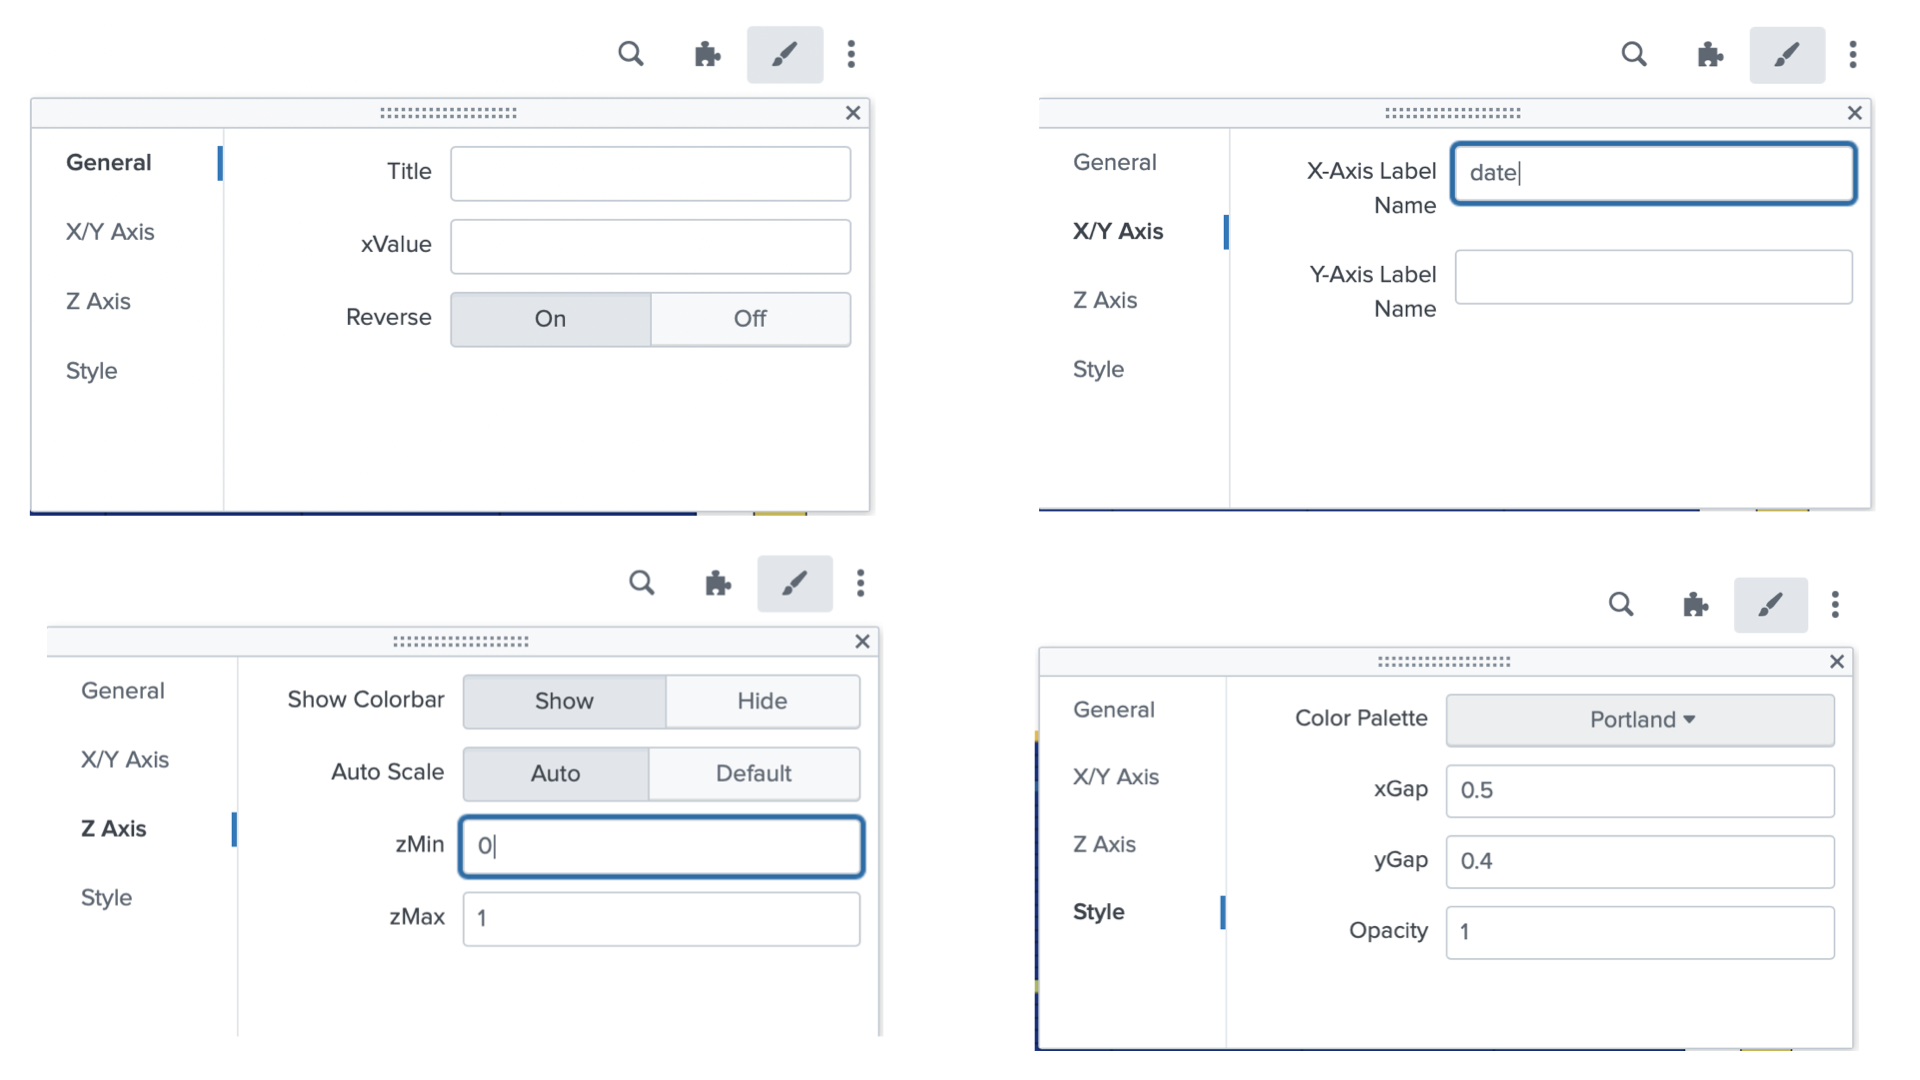
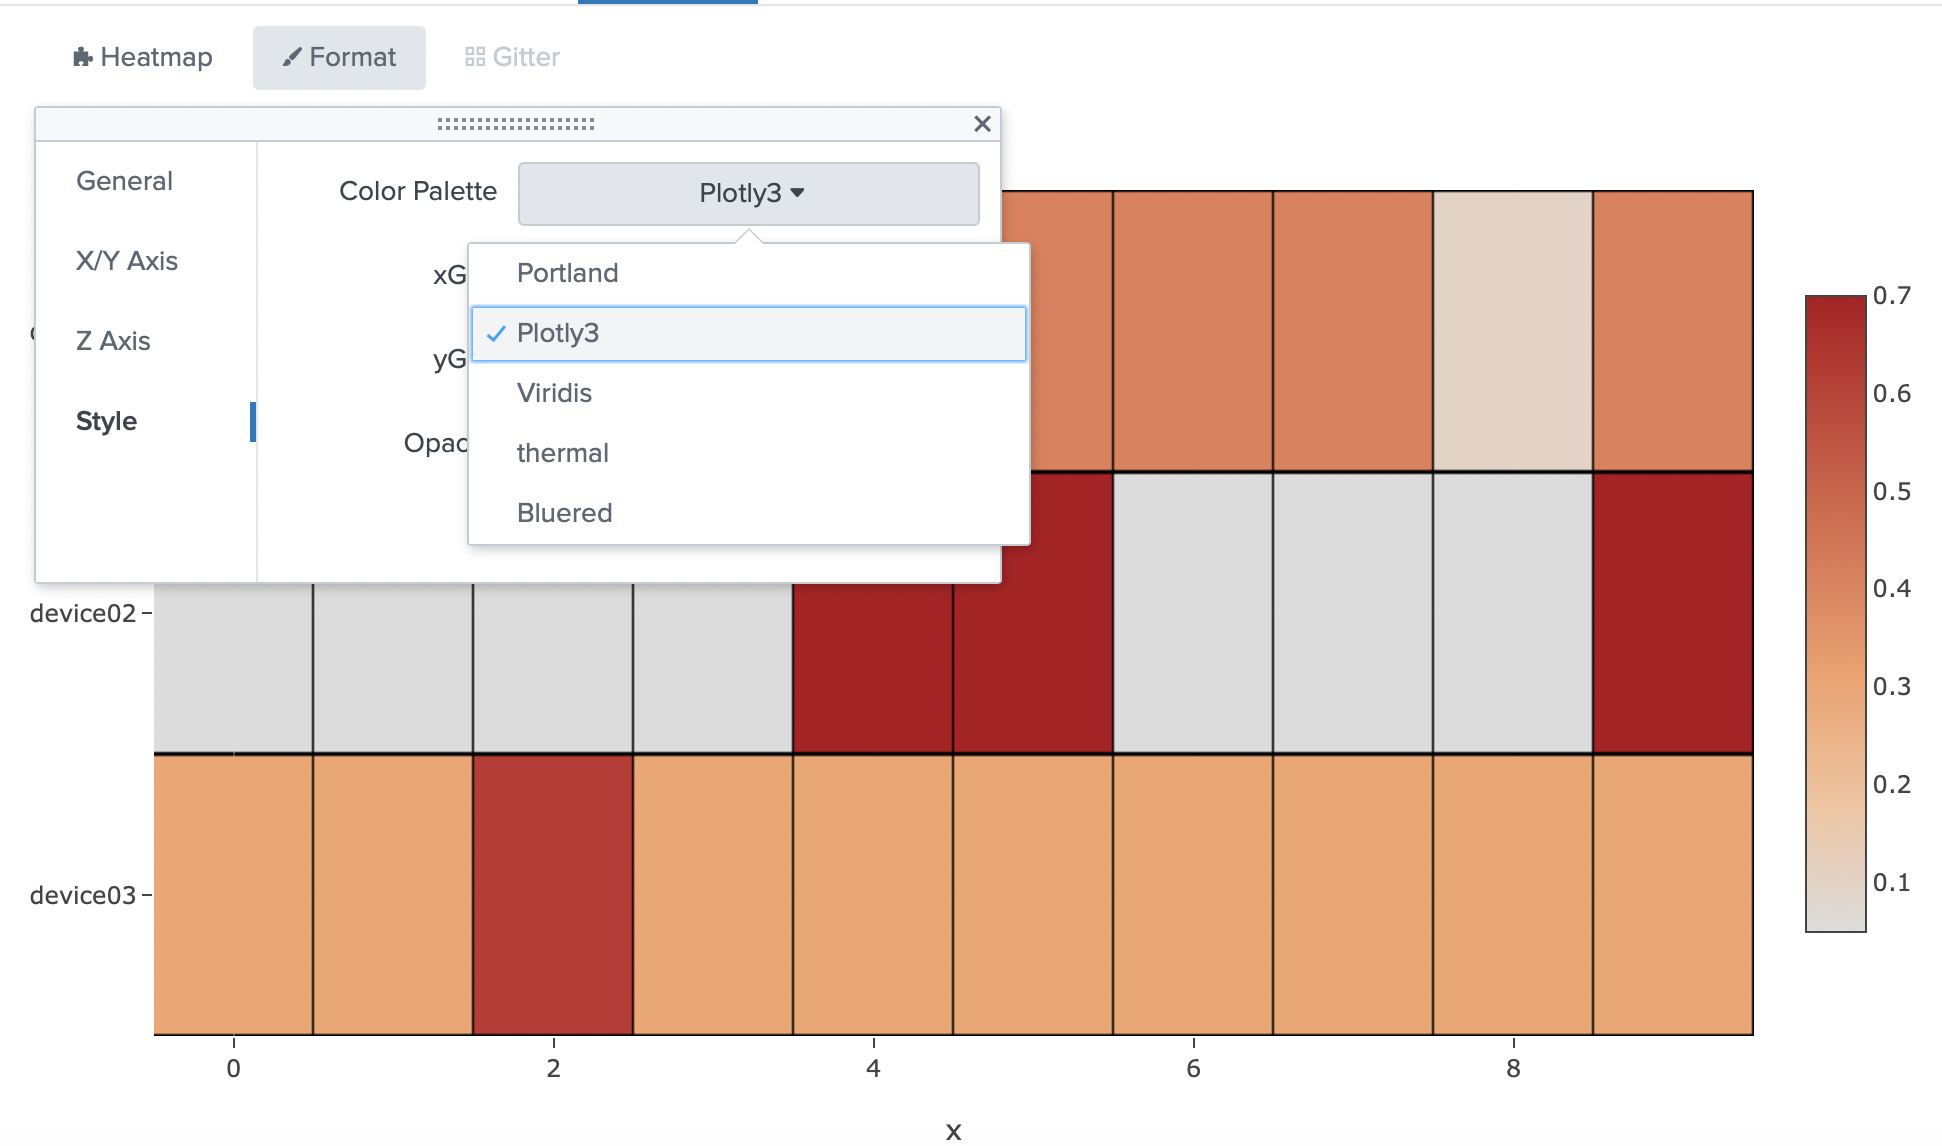
Visualizationand thenHeatmap - Format the visualization as needed
- The field name of xValues can be changed in the formatting menu
The app allows for some custom modifications. Currently the following settings are implemented:


