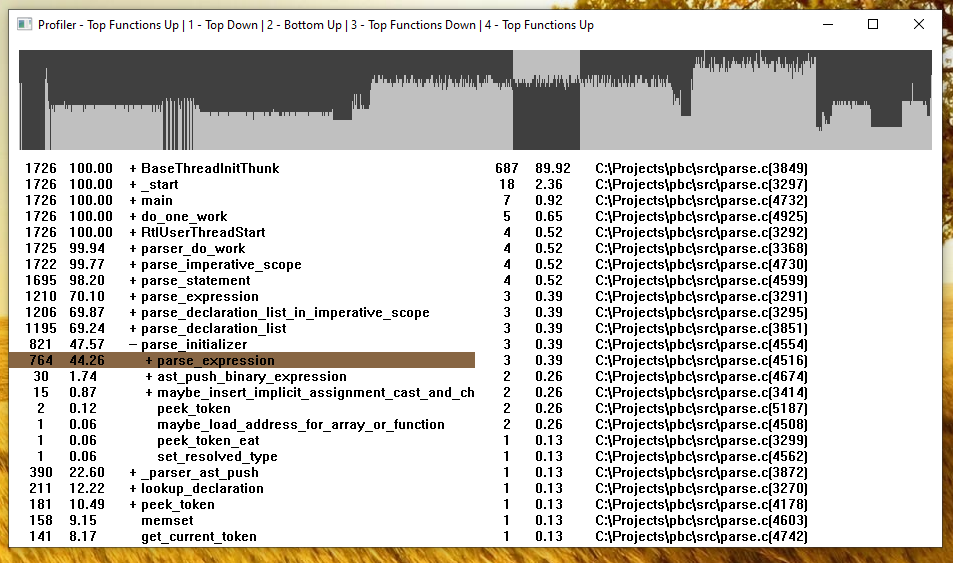
This is a fairly simple sampling profiler based on the Event Tracing for Windows (ETW)
and DbgHelp APIs. The basic idea is to use ETW to generate stack trace samples,
symbolize them using DbgHelp, and use them to build profile trees.
These profile trees are then displayed using the GDI (essentially FillRect + TextOut).
At the top is a timeline, which lets you select the specific part of the profile you are interested in. The left hand side shows the amount of samples raw and in percent, as well as the profiling tree. The right hand side shows the lines hit for the selected function. There are four trees generated:
- Top Down
Stack traces start from the sample location and end at the root (e.gmain()). - Bottom Up
Stack traces start from the root (e.gmain()) and end at the sample location. - Top Functions Down
Stack traces start from every possible location inside the stack trace and end at the root (e.gmain()). - Top Function Up
Stack traces start from every possible location inside the stack trace and end at the sample location.
These might seem somewhat cryptic from their description, but they make sense when you try them.
The code tries to be as flat as possible; not a lot of utility functions, no wrappers, etc. The only "non-required" complication is the use of a background threads to generate the profile trees and the timeline.
The command-line usage is as follows:
profiler <command> <arg1> <arg2>...
(e.g profiler main.exe -argument).
The profiler will get the raw command line and strip everything until the first space.
This means it expects the first parameter (profiler) to not contain a space
(for example to be in your PATH).
The profiler is using ETW. ETW is intended to be used for whole system profiling (including kernel), hence it requires administrator privileges.
The profiler only samples events from the process it initially creates and does not sample any children. This also means the profiler does not work with wrapper batch scripts.
To build simply use cl from a x64 Native Tools Command Prompt, e.g:
cl /O2 profiler.c
Because ETW requires administrator privileges, it can be advantageous to embed a 'requireAdministrator' manifest into the executable. That way it will cause a UAC prompt, when you use it from a user command prompt. The command to accomplish this is:
cl /O2 profiler.c /link /MANIFESTUAC:level='requireAdministrator' /MANIFEST:EMBED
