The Prisma Cloud CLI is a command line interface for Prisma Cloud by Palo Alto Networks.
This template/solution is released under an as-is, best effort, support policy. These scripts should be seen as community supported and Palo Alto Networks will contribute our expertise as and when possible. We do not provide technical support or help in using or troubleshooting the components of the project through our normal support options such as Palo Alto Networks support teams, or ASC (Authorized Support Centers) partners and backline support options. The underlying product used (Prisma Cloud) by the scripts or templates are still supported, but the support is only for the product functionality and not for help in deploying or using the template or script itself.
Unless explicitly tagged, all projects or work posted in our GitHub repository (at https://github.com/PaloAltoNetworks) or sites other than our official Downloads page on https://support.paloaltonetworks.com are provided under the best effort policy.
- Python >= 3.8
- Pip3
pip3 install prismacloud-cliInstallation on Alpine:
sudo pip3 install --upgrade pip && pip3 install --upgrade setuptools
sudo pip3 install prismacloud-cli
Installation on Ubuntu:
sudo apt update
sudo apt install -y python3-venv python3-pip jq
mkdir python_virtual_environments/
cd python_virtual_enviornments/
python3 -m venv prisma_cli_env
source prisma_cli_env/bin/activate
pip3 install prismacloud-cli
Run the pc cli script. If you don't have a config file yet, it will help you to create one.
pc version
This process looks like the screenshot below. the prismacloud-cli asks you for some details, stores it in the credentials file and uses that file when it is already available.
Create an access key from Settings then Access key Get the path to console from Compute tab, System, Utilities
Create a file into home directory .prismacloud/credentials.json with the following structure.
{
  "url":      "__REDACTED__",
  "identity": "__REDACTED__",
  "secret":   "__REDACTED__"
}
You can add additional configurations which you can call by using --config. For example, create a file called ~/.prismacloud/demo.json with the contents above.
Add --config demo to your cli commands.
For example:
pc --config demo -o csv policy
By setting the environment variables:
PC_ACCESS_KEY
PC_SAAS_API_ENDPOINT
PC_SECRET_KEY
And then run pc referring to a configuration called environment:
pc --config environment <command>
See Prisma Cloud CLI in GitHub Actions
See How to enable or disable policies at scale via CSV
pc -o csv policy
pc -o json policy | jq
pc tags
pc stats dashboard
pc -o json stats dashboard
pc cloud name
pc --columns defendersSummary.host stats dashboard
The following global options are available
Options:
  -v, --verbose                   Enables verbose mode.
  -vv, --very_verbose             Enables very verbose mode.
  -o, --output [text|csv|json|html|clipboard|markdown|columns]
  -c, --config TEXT               Select configuration
                                  ~/.prismacloud/[CONFIGURATION].json
  --columns TEXT                  Select columns for output
  --help                          Show this message and exit.
Use -o columns to get a list of columns available for --columns, e.g.:
pc -o columns images
pc --columns hostname,repoTag.repo,osDistro -o csv images -l 1
To overwrite the default output settings, use environment variables MAX_WIDTH (console output), MAX_ROWS, MAX_COLUMNS and MAX_LINES.
- MAX_LINES is used to defined the maximum number of lines within a cell when wrapping the contents.
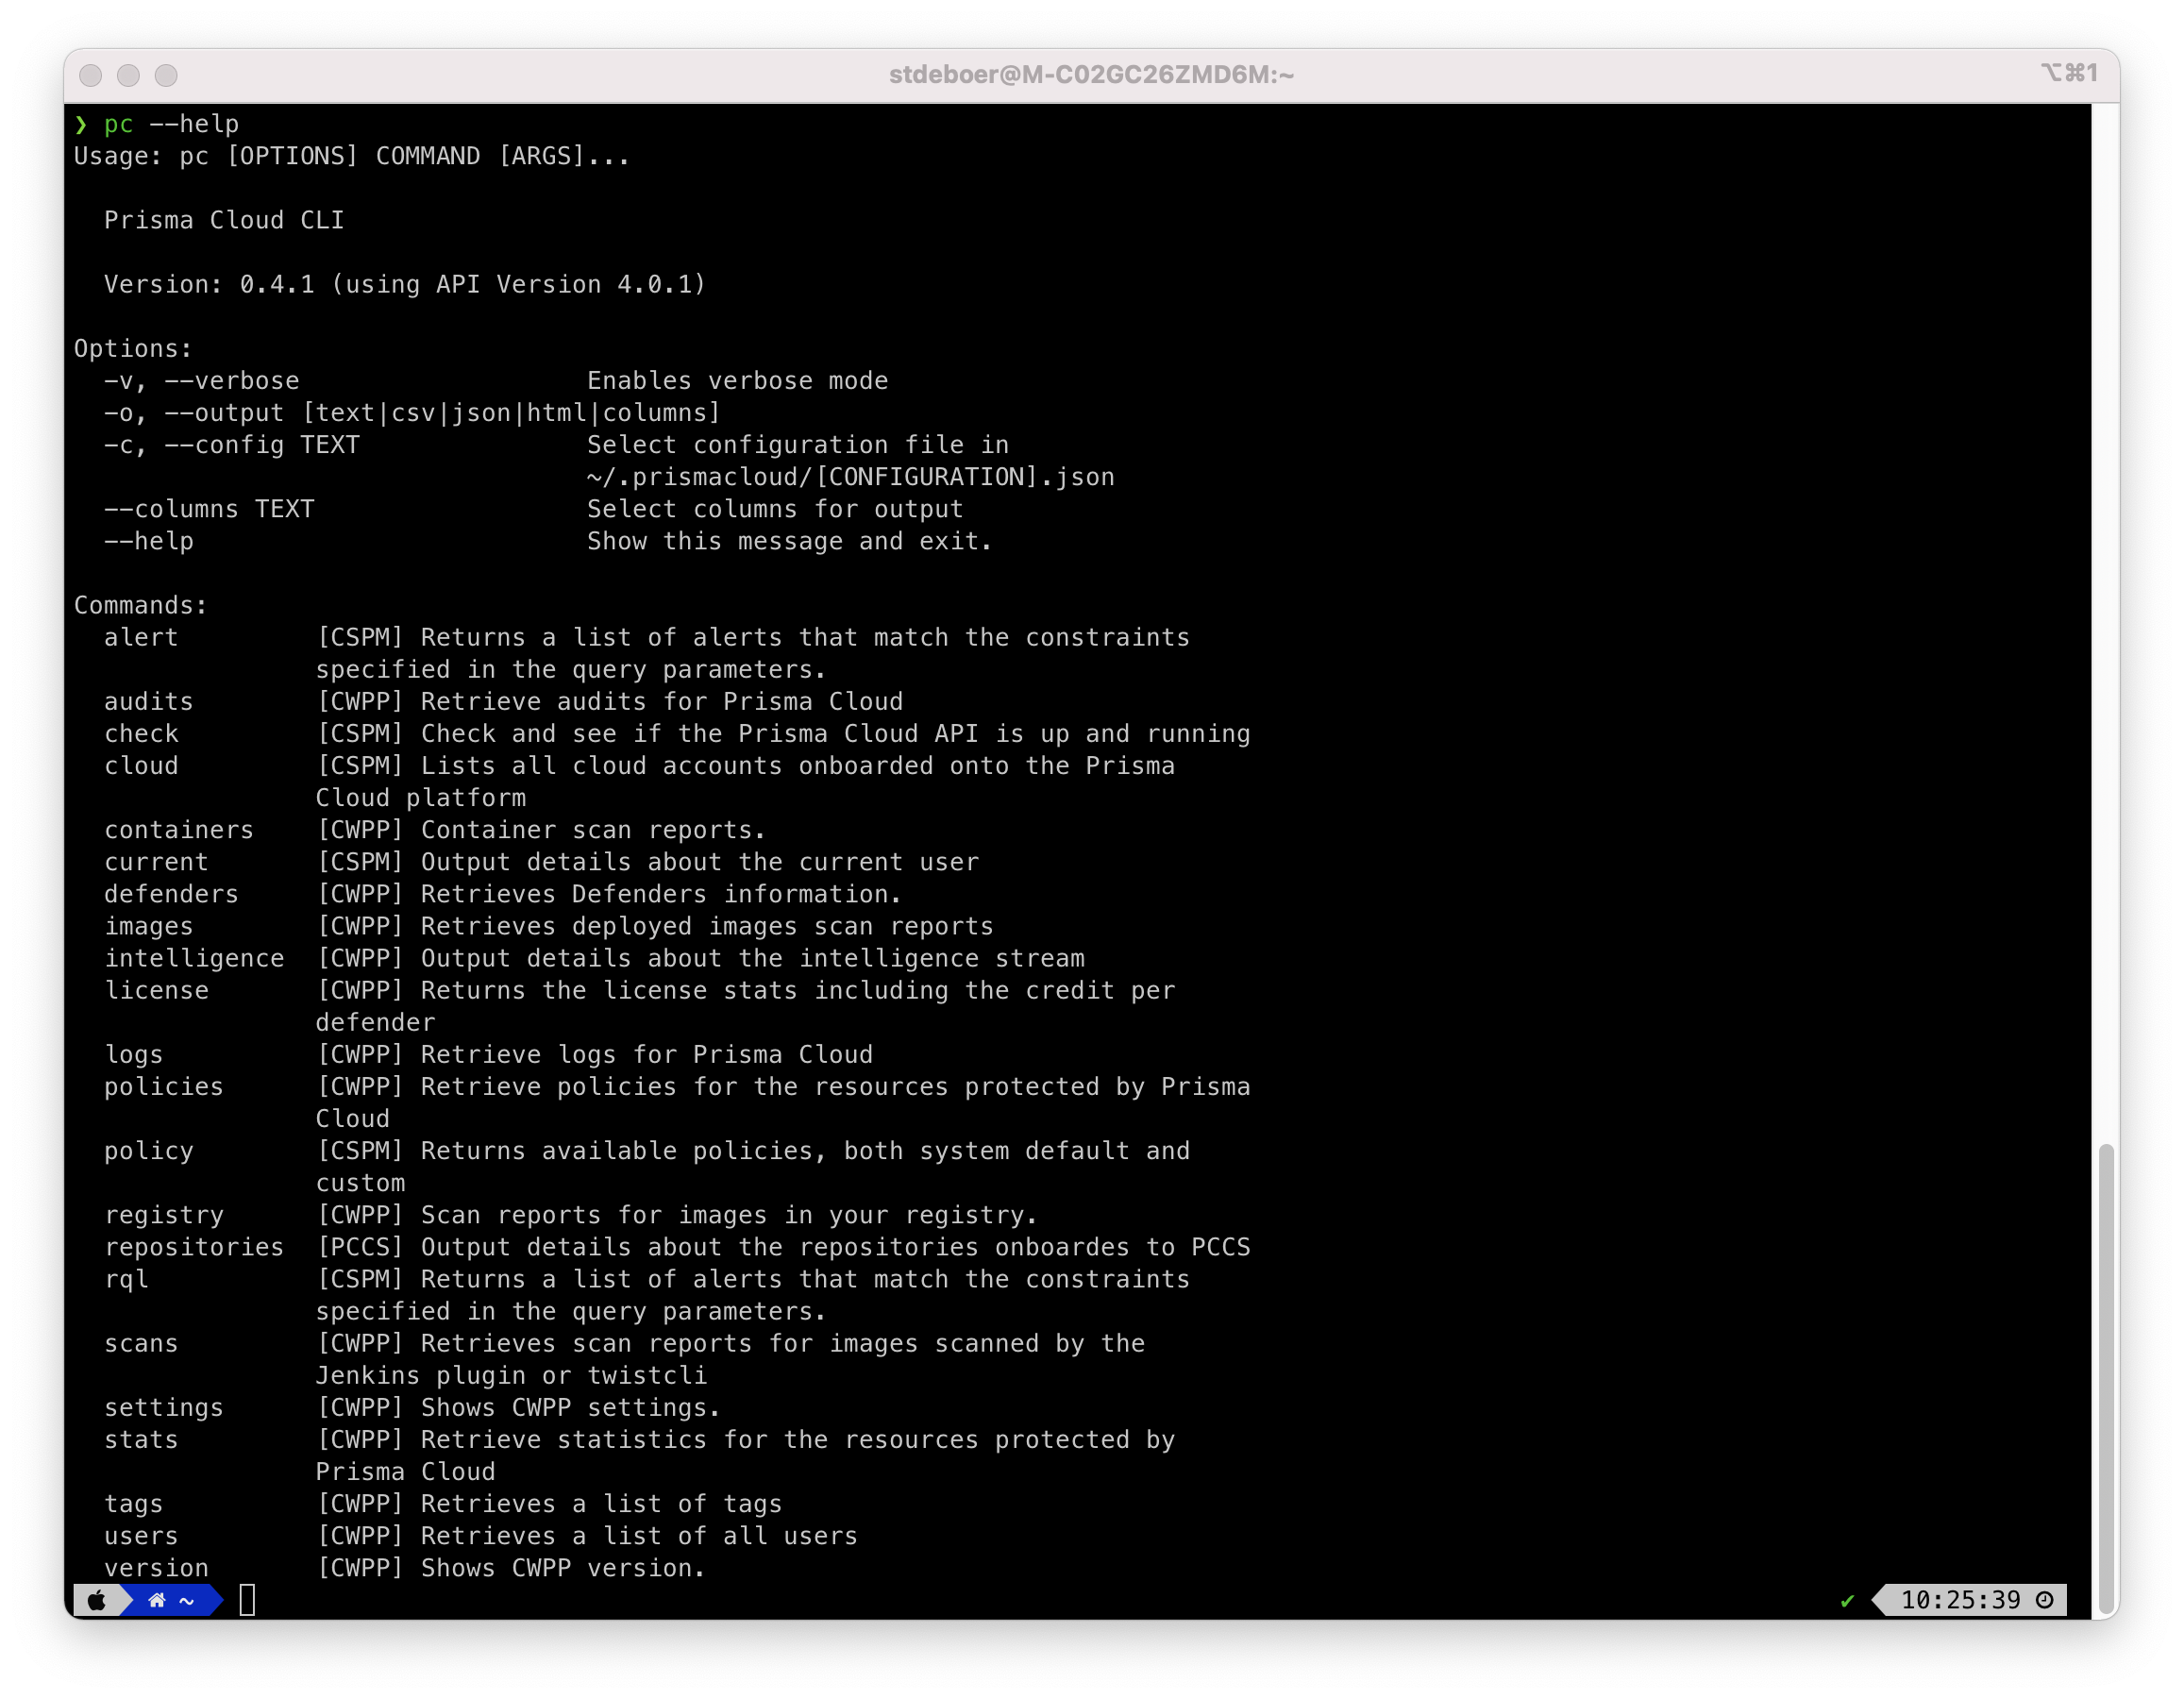
The cli has several commands to work with, see the screenshot below for an example, but use pc --help to see the latest list for your version.
pc -o json stats vulnerabilities --cve CVE-2021-44228 | jq
pc stats vulnerabilities --cve CVE-2021-44228
Use something similar for getting the Spring Shell impacted resources.
pc scans --help
Select only specific columns for the output:
pc --columns entityInfo.repoTag.registry,entityInfo.repoTag.repo,entityInfo.repoTag.tag,entityInfo.vulnerabilitiesCount scans -l 20 -s nginx
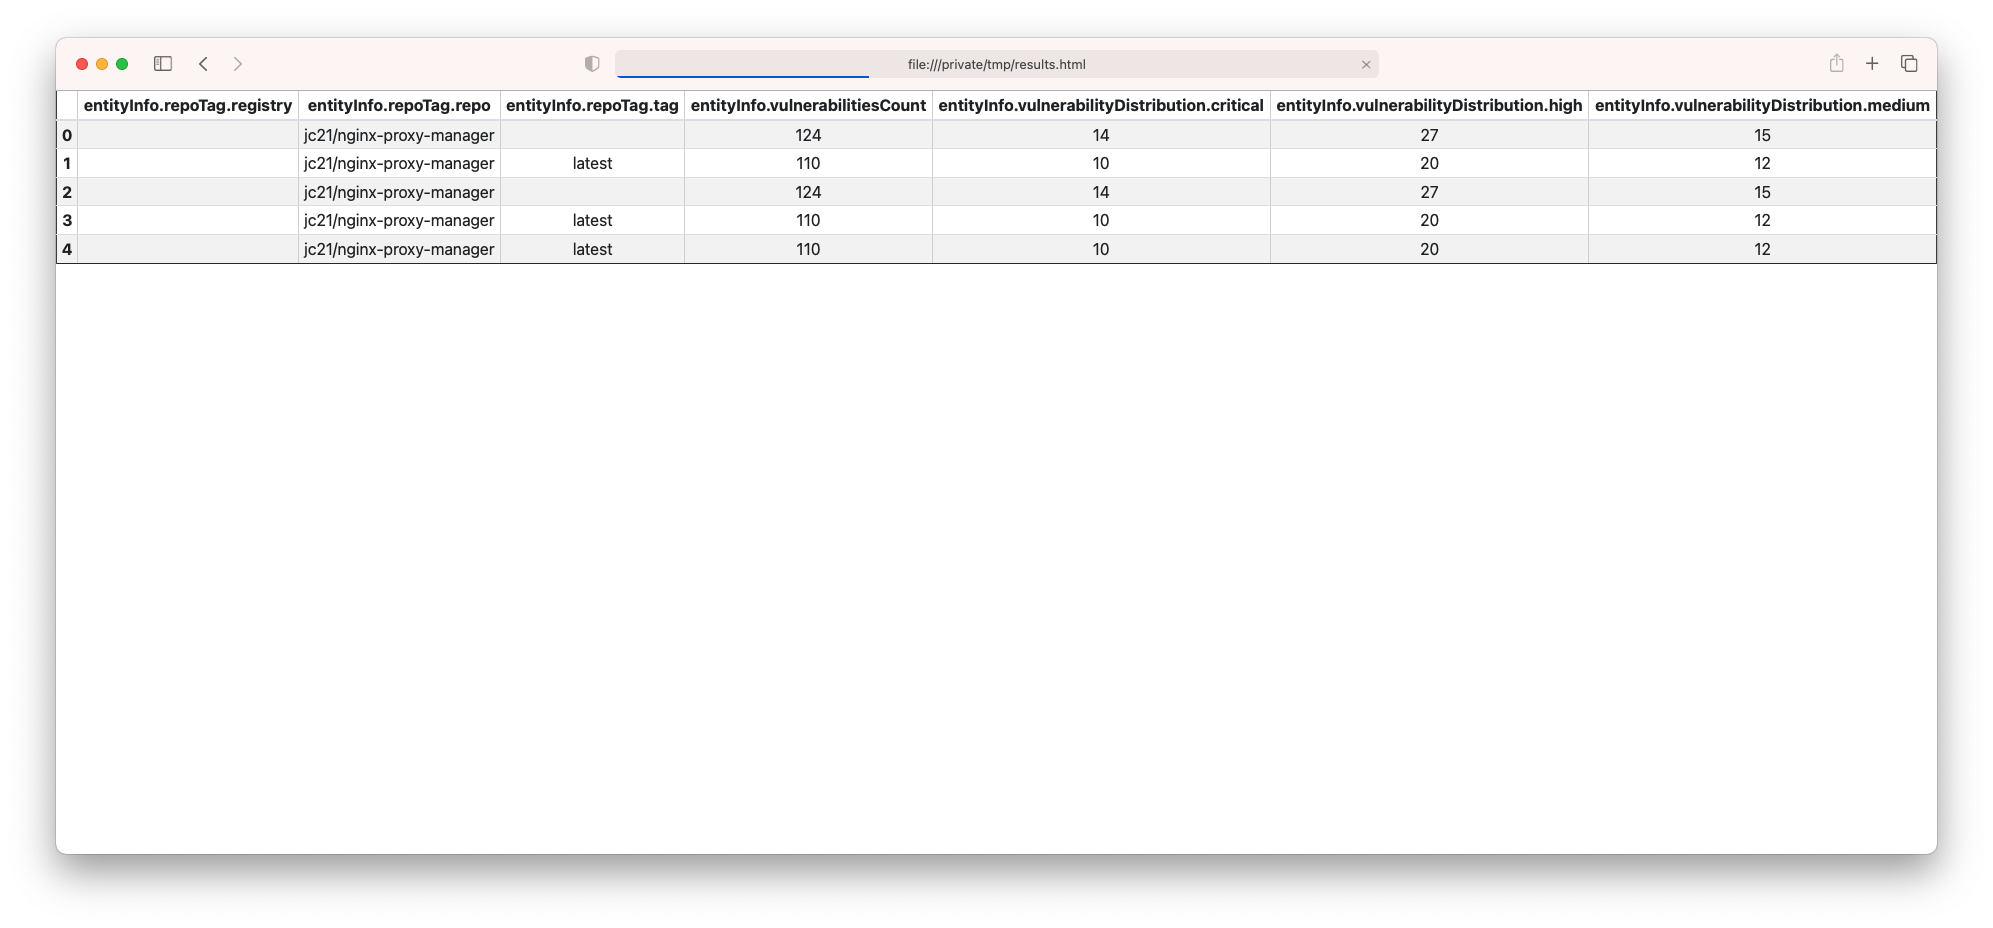
You might also want to add some additional columns and save the output as html:
pc --config local -o html --columns entityInfo.repoTag.registry,entityInfo.repoTag.repo,entityInfo.repoTag.tag,entityInfo.vulnerabilitiesCount,entityInfo.vulnerabilityDistribution.critical,entityInfo.vulnerabilityDistribution.high,entityInfo.vulnerabilityDistribution.medium scans -l 20 -s nginx > /tmp/results.html
Then, open /tmp/results.html:
pc policy set --help
pc -vv policy set --status enable --compliance_standard 'CIS v1.4.0 (AWS)'
pc -vv policy set --status disable --compliance_standard 'CIS v1.4.0 (AWS)'
The below examples are using Github as integration but it works as well with other integration:
- Bitbucket
- Gitlab
- AzureRepos
- Github Enterprise
- Gitlab Enterprise
- Bitbucket Enterprise
Count the number of unique git authors across all Github repositories:
pc -ojson repositories count-git-authors -i Github | jq .
Get the details of all CVE across all Github repositories:
pc -o json repositories search -i Github -c Vulnerabilities -t packageCve --details | jq .
Get all secrets across all Github repositories:
pc -o json repositories search -i Github -c Secrets -t violation | jq .
Get all drift across all Github repositories:
pc repositories search --integration_type Github --categories Drift
To list all container registries:
pc registry listTo trigger scans on all registries:
pc registry scanTo include specific registries or repositories in the scan:
pc registry scan --include "registry_name/repo_name" --i "another_registry"To exclude specific registries or repositories from the scan:
pc registry scan --exclude "registry_name/repo_name" --e "another_registry"

