- A repository of R graphics with their associated code
- FIGURE THEMES
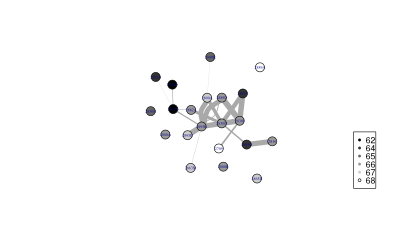
This repository intends to be a catalog of figures made in our group with the associated R code used to produce them. Scroll down to browse the available figures. Clicking on any of them will take you to the source code used to produce it.
CONTRIBUTING
See here for information on how to contribute new figures and code.
OTHER REPOS WITH R CODE TO PRODUCE FIGURES
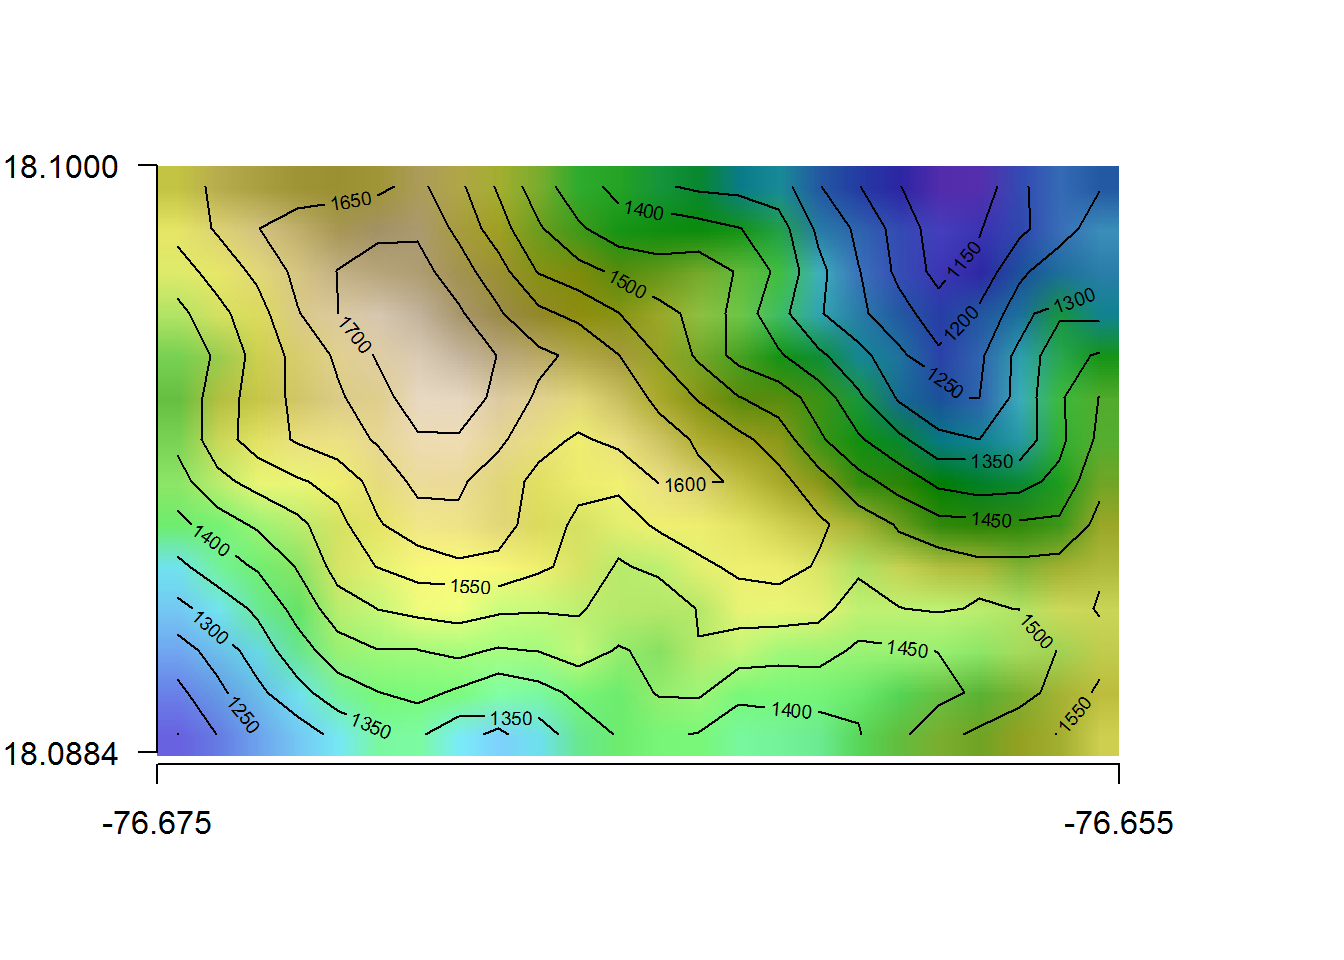
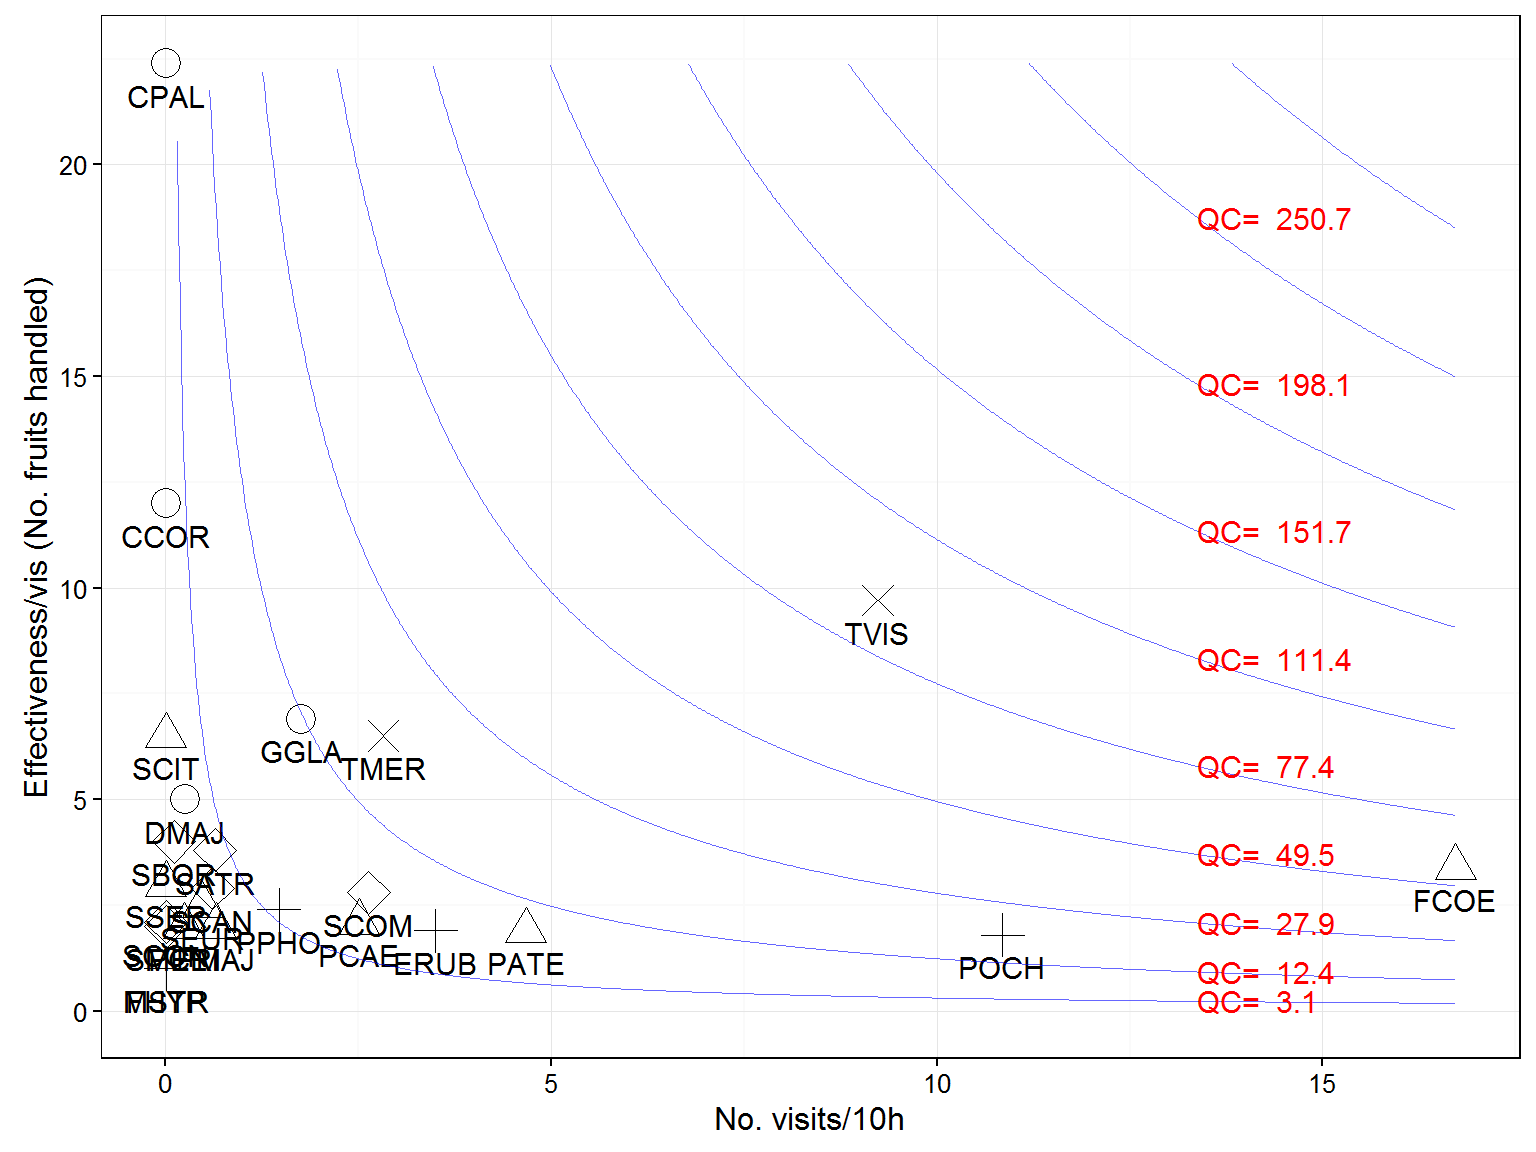
More information on effectiveness landscapes is in [Pedro Jordano Lab Pages @GitHub](http://pedroj.github.io).

Creative Commons License
This work and all other materials under https://github.com/PJordano-Lab/ are licensed under a Creative Commons Attribution 4.0 International License.