Analyze bikes sharing station data from Bordeaux and Lyon Open Data (French cities).
Use the Python 3 programming language in Jupyter notebooks and the following libraries: pandas, numpy, seaborn, matplotlib, scikit-learn, xgboost.
See the requirements.txt file for the dependencies. If you
use conda and the conda environment, you can just do: conda env create -f environment.yml and the source activate bikes.
Highly inspired by the Usage Patterns Of Dublin Bikes Stations article and his great notebook.
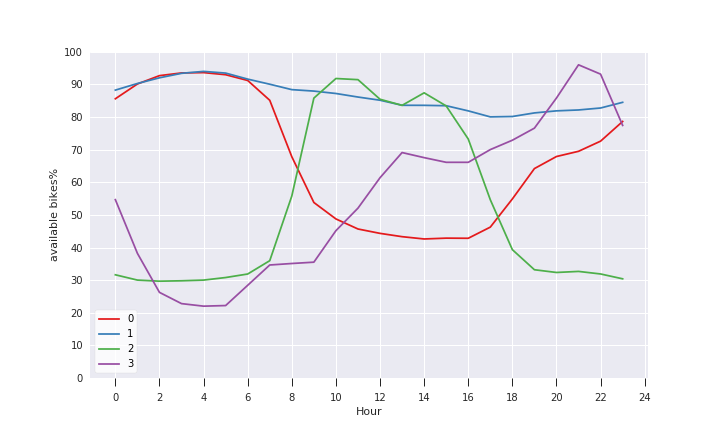
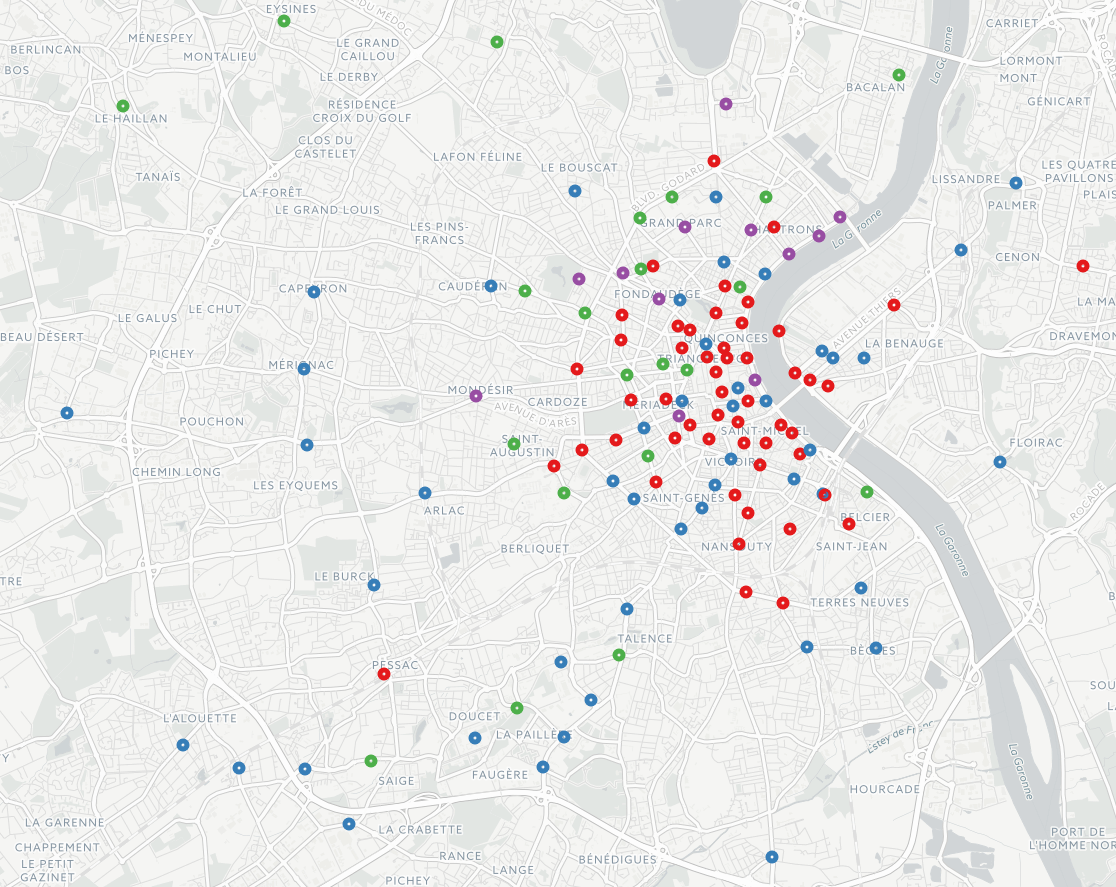
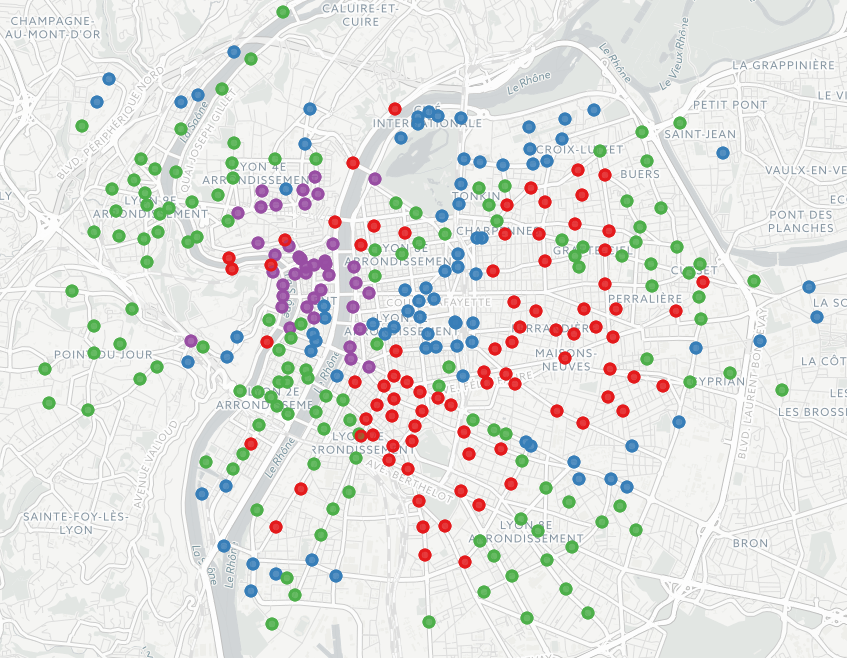
Analyze the daily profile and plot a map with a color for each usage pattern.
You can see the percentage of available bikes for 4 different daily profiles. Note the analysis only keep job days.
- Blue profile: people who take bikes in the morning, roll them into 'green' stations and go back home in the evening.
- Green profile: opposite of the blue profile.
- Orange profile: not very used stations. Sometimes too far from city center. Sometimes very close the tramway stations.
- Red profile: stations where people go in the evening
Play with some different models to predict the number of available bikes (or a kind of availability).
- See the script
prediction.pywhich uses XGBoost to predict the bicycle-station availability - Notebook for prediction in Lyon
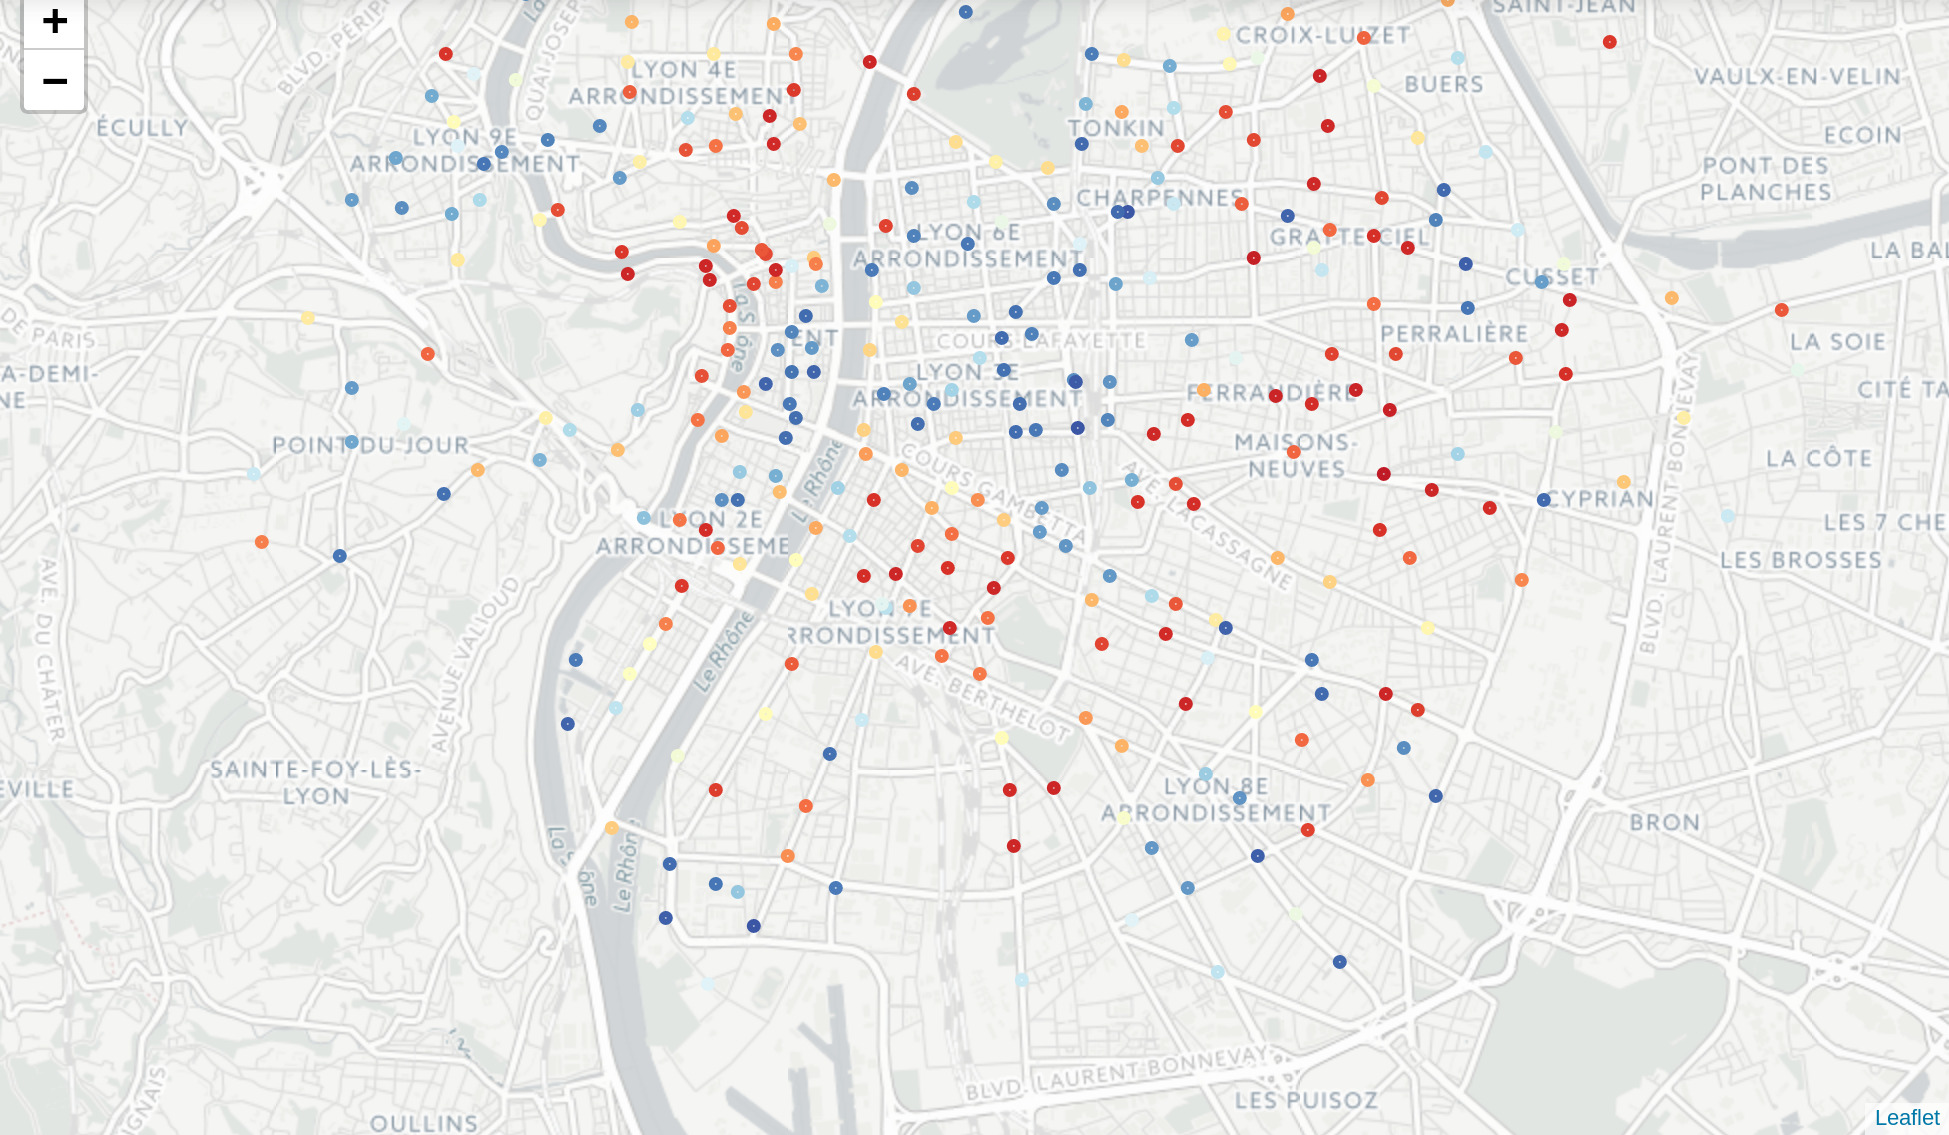
From history data (two weeks), prediction at T+30 minutes for every station in Lyon (France).
- Blue means there are several available bikes
- Red means there are just a few available bikes
See the lyon.tar.gz and bordeaux.tar.gz.


