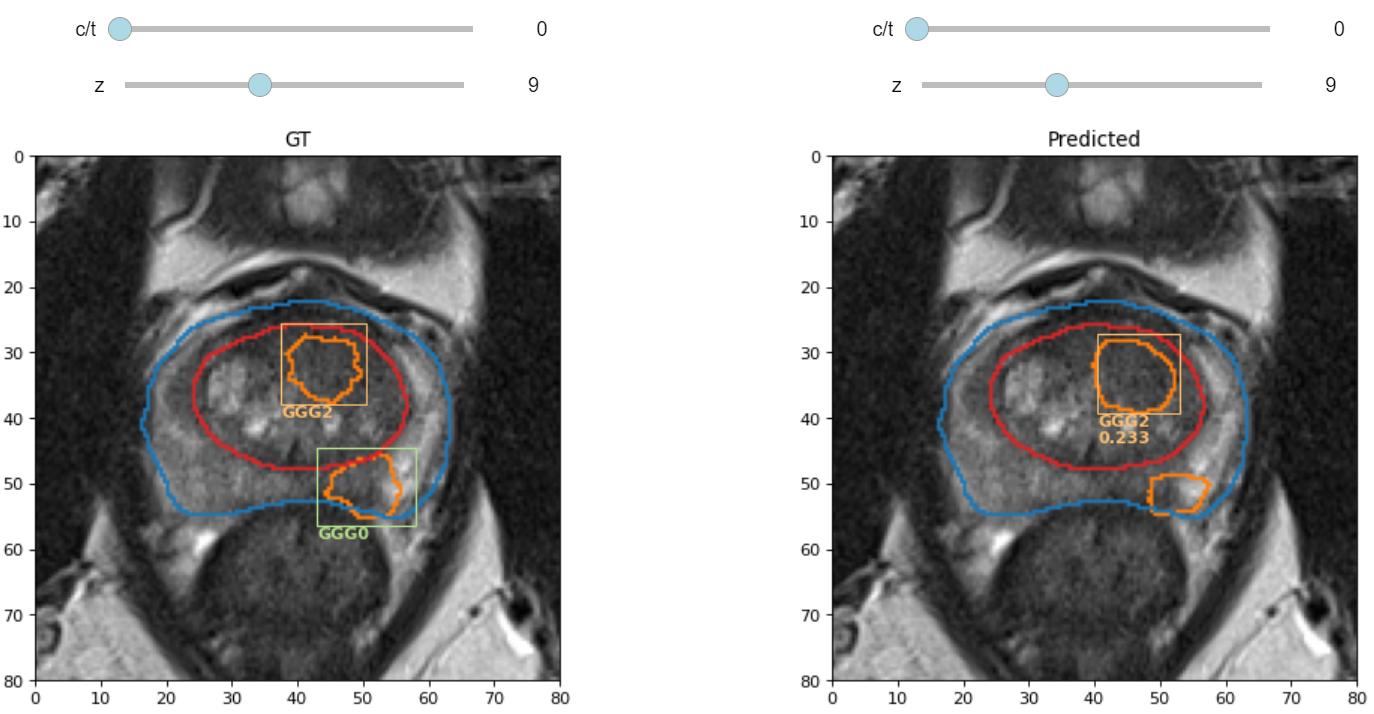
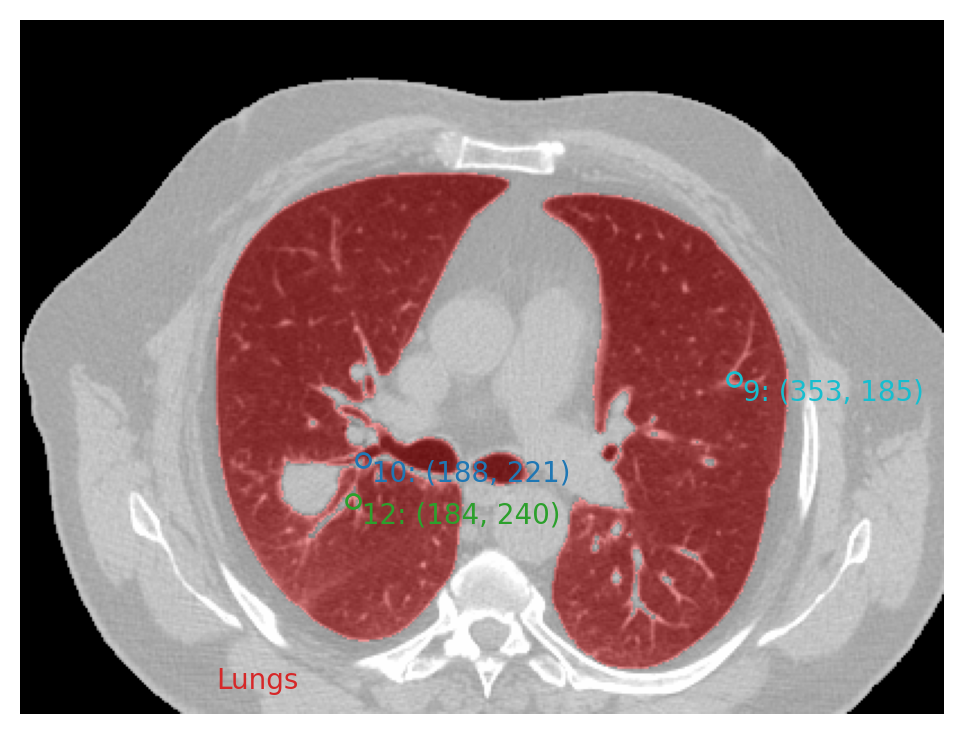
plot_lib is a library for quickly plotting 2D, 3D and 4D interactive images within Jupyter Notebooks with the following goals:
- Simple interface:
plot(image),plot(image, masks=[mask]),plot(path_to_dicom_directory) - Plot 2D, 3D and 4D interactive images with sliders that allow exploration of 3D and 4D images
- Publication-quality plots by default
- Versatile: can easily plot masks, points and boxes along with the image
- Hackable: the code is very simple and any missing functinality can be easily added
It was originally designed as a quick way to explore medical images in the context of semantic segmentation, detection, etc., allowing to plot small interactive visualizations within Jupyter Notebooks.
Please, look at the Notebook: Introduction to plot_lib for further information and examples. Some examples of the kind of output it can generate:
To install and use, please clone this repository and install required packages:
git clone https://github.com/OscarPellicer/plot_lib.git

#Install required libraries using e.g. pip or conda
pip install matplotlib numpy "ipywidgets>=7.6" ipython scipy simpleitk
#conda install matplotlib numpy "ipywidgets>=7.6" ipython scipy
#conda install SimpleITK -c simpleitk

#(Optional) Install packages required by the demo Notebook
pip install pandas urlib
#conda install pandas urlib
The basic usage is the following:
#Within a Jupyter Notebook:
#We need to load the library from wherever it was cloned
#We will asume it is located at the users's home path: ~/plot_lib
from pathlib import Path
import sys, os
sys.path.append(os.path.join(Path.home(), 'plot_lib'))

#Then import any required funtions
from plot_lib import plot
import numpy as np
plot(np.zeros([100]*3))
Note: Since ipywidgets 7.6, plot_lib should run fine both in Jupyter Lab and Jupyter Notebook!
Oscar J. Pellicer-Valero. (2021, March 5). OscarPellicer/plot_lib (Version v0.2). Zenodo. https://doi.org/10.5281/zenodo.4395271

