MFND3R: Multivariate Forecasting Network with Deep Data-Driven Reconstruction for Engineering Application
This is the origin Pytorch implementation of MFND3R in the following paper: [MFND3R: Multivariate Forecasting Network with Deep Data-Driven Reconstruction for Engineering Application](Manuscript submitted to EAAI).

Figure 1. The entire architecture of MFND3R.
- Python 3.8.8
- matplotlib == 3.3.4
- numpy == 1.20.1
- pandas == 1.2.4
- scipy == 1.9.0
- scikit_learn == 0.24.1
- torch == 1.11.0
Dependencies can be installed using the following command:
pip install -r requirements.txtETT, ECL and weather dataset were acquired at: here. Solar and PEMS dataset were acquired at: here. M4 dataset was acquired at: M4. Ship dataset was in ./data/Ship/ and its raw data was in https://coast.noaa.gov/htdata/CMSP/AISDataHandler/2022/index.html.
After you acquire raw data of all datasets, please separately place them in corresponding folders at ./MFND3R/data.
We place ETT in the folder ./ETT-data, ECL in the folder ./electricity and weather in the folder ./weather of here (the folder tree in the link is shown as below) into folder ./data and rename them from ./ETT-data,./electricity and ./weather to ./ETT, ./ECL and./weather respectively. We rename the file of ECL from electricity.csv to ECL.csv and rename its last variable from OT to original MT_321.
|-autoformer
| |-ETT-data
| | |-ETTh1.csv
| | |-ETTh2.csv
| | |-ETTm1.csv
| | |-ETTm2.csv
| |
| |-electricity
| | |-electricity.csv
| |
| |-weather
| | |-weather.csv
We place Solar in the folder ./financial and PEMS in the folder ./PEMS of here (the folder tree in the link is shown as below) into the folder ./data and rename them as ./Solar and ./PEMS respectively.
|-dataset
| |-financial
| | |-solar_AL.txt
| |
| |-PEMS
| | |-PEMS08.npz
As for M4 dataset, we place the folders ./Dataset and ./Point Forecasts of M4 (the folder tree in the link is shown as below) into the folder ./data/M4. Moreover, we unzip the file ./Point Forecasts/submission-Naive2.rar to the current directory.
|-M4-methods
| |-Dataset
| | |-Test
| | | |-Daily-test.csv
| | | |-Hourly-test.csv
| | | |-Monthly-test.csv
| | | |-Quarterly-test.csv
| | | |-Weekly-test.csv
| | | |-Yearly-test.csv
| | |-Train
| | | |-Daily-train.csv
| | | |-Hourly-train.csv
| | | |-Monthly-train.csv
| | | |-Quarterly-train.csv
| | | |-Weekly-train.csv
| | | |-Yearly-train.csv
| | |-M4-info.csv
| |-Point Forecasts
| | |-submission-Naive2.rar
Then you can get the folder tree shown as below:
|-data
| |-ECL
| | |-ECL.csv
| |
| |-ETT
| | |-ETTh1.csv
| | |-ETTh2.csv
| | |-ETTm1.csv
| | |-ETTm2.csv
| |
| |-M4
| | |-Dataset
| | | |-Test
| | | | |-Daily-test.csv
| | | | |-Hourly-test.csv
| | | | |-Monthly-test.csv
| | | | |-Quarterly-test.csv
| | | | |-Weekly-test.csv
| | | | |-Yearly-test.csv
| | | |-Train
| | | | |-Daily-train.csv
| | | | |-Hourly-train.csv
| | | | |-Monthly-train.csv
| | | | |-Quarterly-train.csv
| | | | |-Weekly-train.csv
| | | | |-Yearly-train.csv
| | | |-M4-info.csv
| | |-Point Forecasts
| | | |-submission-Naive2.csv
| |
| |-PEMS
| | |-PEMS08.npz
| |
| |-Ship
| | |-Ship1.csv
| | |-Ship2.csv
| |
| |-Solar
| | |-solar_AL.txt
| |
| |-weather
| | |-weather.csv
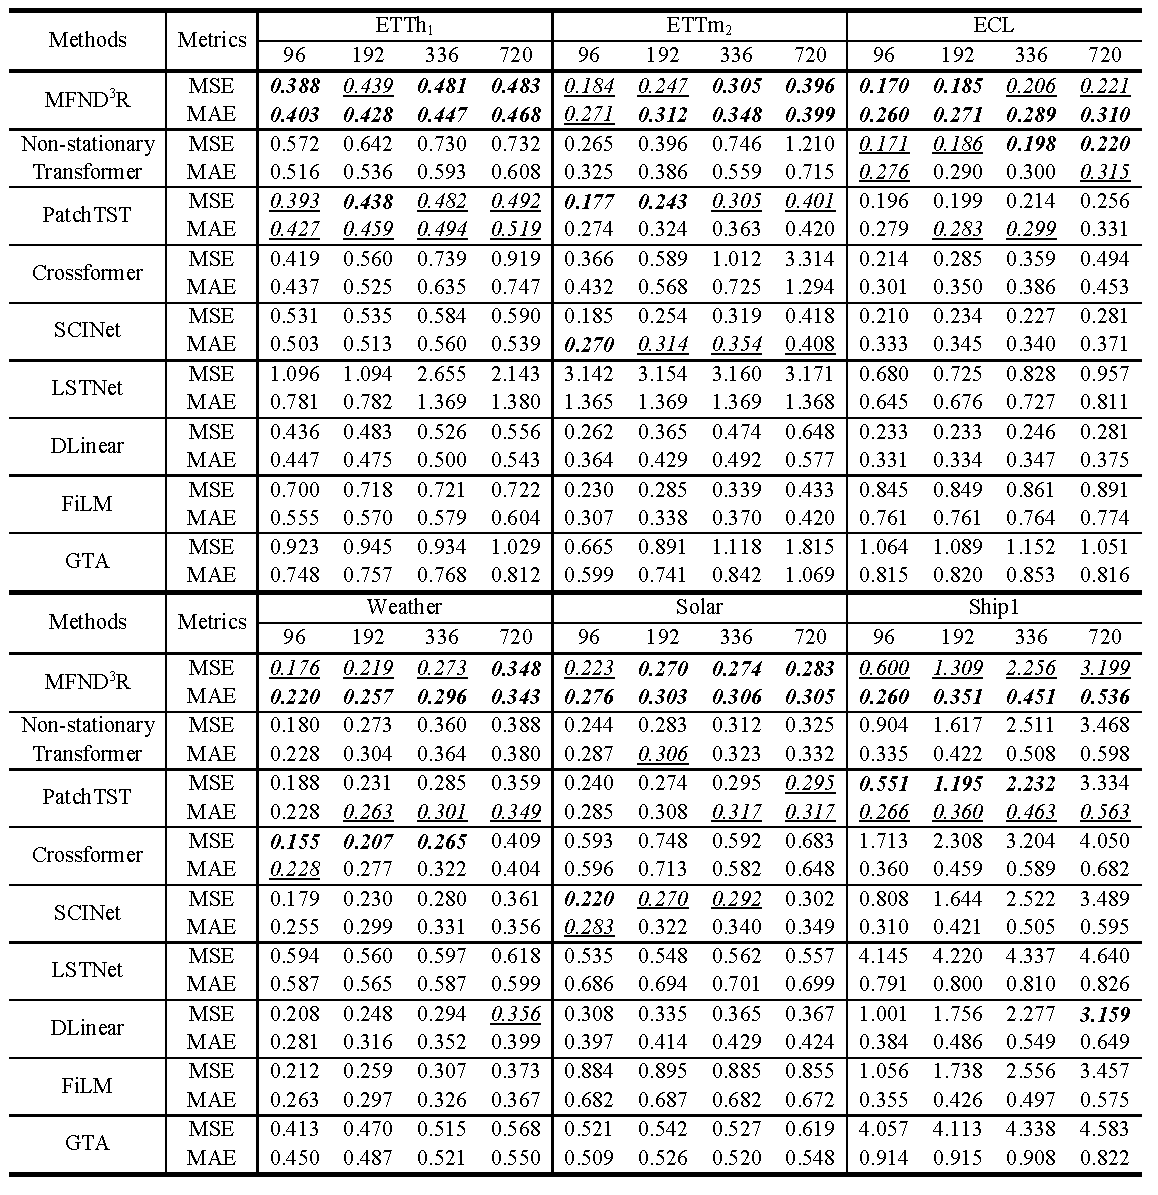
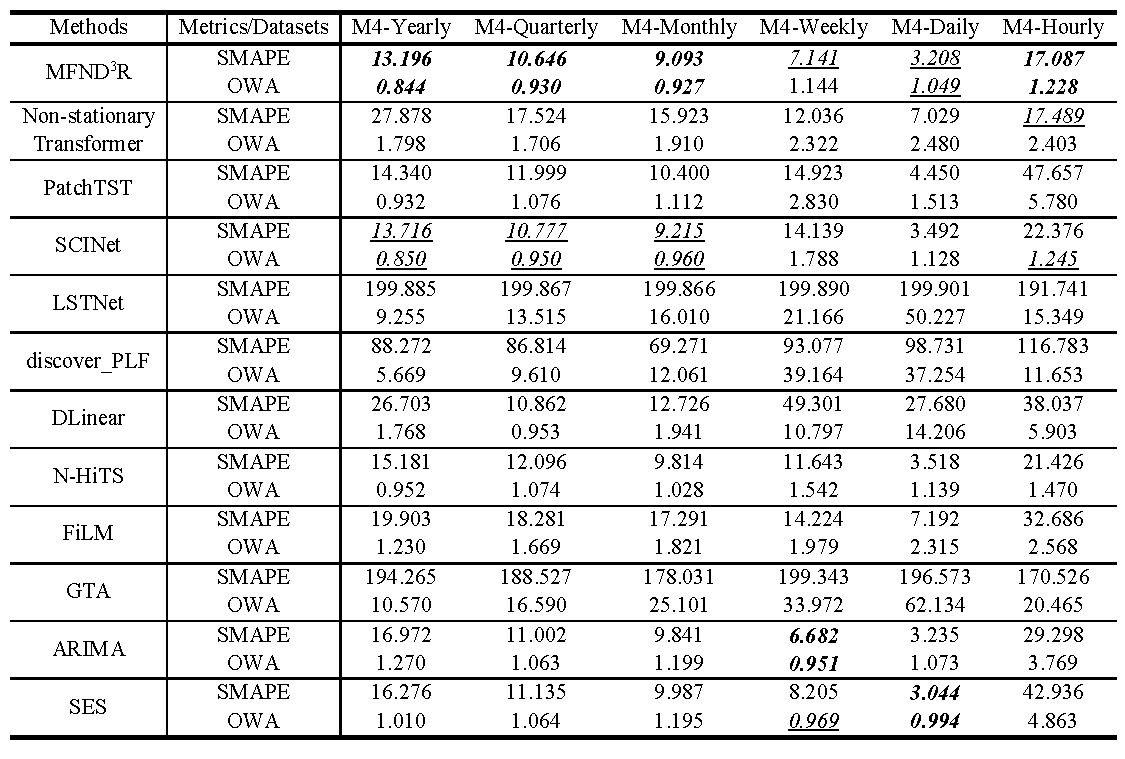
We select eight typical deep time series forecasting models based on CNN (SCINet), RNN (LSTNet), GNN (GTA), Transformer (Non-stationary Transformer, PatchTST, Crossformer) and Perceptron/MLP (DLinear, FiLM) as baselines in multivariate forecasting experiments. Two traditional time series forecasting models {ARIMA, Simple Exponential Smooth (SES)} and two deep forecasting model (N-HiTS, discover_PLF) are chosen as additional baselines only when handling the univariate dataset M4. Their source codes origins are given below:
| Baseline | Source Code |
|---|---|
| Non-stationary Transformer | https://github.com/thuml/Nonstationary_Transformers |
| PatchTST | https://github.com/yuqinie98/PatchTST |
| Crossformer | https://github.com/Thinklab-SJTU/Crossformer |
| SCINet | https://github.com/cure-lab/SCINet |
| LSTNet | https://github.com/laiguokun/LSTNet |
| discover_PLF | https://github.com/houjingyi-ustb/discover_PLF |
| DLinear | https://github.com/cure-lab/LTSF-Linear |
| N-HiTS | https://github.com/cchallu/n-hits |
| FiLM | https://github.com/tianzhou2011/FiLM |
| GTA | https://github.com/ZEKAICHEN/GTA |
Moreover, the default experiment settings/parameters of aforementioned ten baselines are given below respectively:
| Baselines | Settings/Parameters name | Descriptions | Default mechanisms/values |
|---|---|---|---|
| Non-stationary Transformer | d_model | The number of hidden dimensions | 512 |
| d_ff | Dimension of fcn | 2048 | |
| n_heads | The number of heads in multi-head attention mechanism | 8 | |
| e_layers | The number of encoder layers | 2 | |
| d_layers | The number of decoder layers | 1 | |
| p_hidden_dims | Hidden layer dimensions of projector (List) | [128, 128] | |
| p_hidden_layers | The number of hidden layers in projector | 2 | |
| PatchTST | patch_len | Patch length | 16 |
| stride | The stride length | 8 | |
| discover_PLF | hidden_size | The number of hidden dimensions | 128 |
| num_layers | The number of decoder layers | 1 | |
| Crossformer | seq_len | Segment length (L_seq) | 6 |
| d_model | The number of hidden dimensions | 64 | |
| d_ff | Dimension of fcn | 128 | |
| n_heads | The number of heads in multi-head attention mechanism | 2 | |
| e_layers | The number of encoder layers | 2 | |
| SCINet | hidden-size | The number of hidden dimensions | 8 |
| levels | SCINet block levels | 3 | |
| stacks | The number of SCINet blocks | 1 | |
| LSTNet | hidCNN | The number of CNN hidden units | 100 |
| hidRNN | The number of RNN hidden units | 100 | |
| window | Window size | 168 | |
| CNN_kernel | The kernel size of the CNN layers | 6 | |
| hidSkip | The skip-length Recurrent-skip layer | 24 | |
| DLinear | moving_avg | The window size of moving average | 25 |
| N-HiTS | n_pool_kernel_size | Pooling kernel size | [4, 4, 4] |
| n_blocks | The number of blocks in stacks | [1, 1, 1] | |
| n_x_hidden | Coefficients hidden dimensions | 512 | |
| n_freq_downsample | The number of stacks' coefficients | [64, 8, 1] | |
| FiLM | d_model | The number of hidden dimensions | 512 |
| d_ff | Dimension of fcn | 2048 | |
| n_heads | The number of heads in multi-head attention mechanism | 8 | |
| e_layers | The number of encoder layers | 2 | |
| d_layers | The number of decoder layers | 1 | |
| modes1 | The number of Fourier modes to multiply | 32 | |
| GTA | d_model | The number of hidden dimensions | 512 |
| d_ff | Dimension of fcn | 2048 | |
| n_heads | The number of heads in multi-head attention mechanism | 8 | |
| e_layers | The number of encoder layers | 2 | |
| d_layers | The number of decoder layers | 1 |
Commands for training and testing MFND3R of all datasets are in ./scripts/MFND3R.sh.
More parameter information please refer to main.py.
We provide a complete command for training and testing MFND3R:
python -u main.py --model <model> --mode <mode> --data <data> --root_path <root_path> --features <features> --input_len <input_len> --pred_len <pred_len> --ODA_layers <ODA_layers> --VRCA_layers <VRCA_layers> --d_model <d_model> --learning_rate <learning_rate> --dropout <dropout> --batch_size <batch_size> --use_RevIN --train_epochs <train_epochs> --patience <patience> --itr <itr>
Here we provide a more detailed and complete command description for training and testing the model:
| Parameter name | Description of parameter |
|---|---|
| model | The model of experiment. This can be set to MFND3R |
| mode | Forecasting format |
| data | The dataset name |
| root_path | The root path of the data file |
| data_path | The data file name |
| features | The forecasting task. This can be set to M,S (M : multivariate forecasting, S : univariate forecasting |
| target | Target feature in S task |
| checkpoints | Location of model checkpoints |
| input_len | Input sequence length |
| pred_len | Prediction sequence length |
| enc_in | Input size |
| c_out | Output size |
| d_model | Dimension of model |
| representation | Representation dims in the end of the intra-reconstruction phase |
| dropout | Dropout |
| ODA_layers | The number of ODA layers |
| VRCA_layers | The number of VRCA layers |
| alpha | The significant level of Cucconi test |
| itr | Experiments times |
| train_epochs | Train epochs of the second stage |
| batch_size | The batch size of training input data in the second stage |
| patience | Early stopping patience |
| learning_rate | Optimizer learning rate |
| loss | Loss function |
| use_RevIN | Whether to use RevIN |
The experiment parameters of each data set are formated in the MFND3R.sh files in the directory ./scripts/. You can refer to these parameters for experiments, and you can also adjust the parameters to obtain better mse and mae results or draw better prediction figures.

Figure 2. Multivariate forecasting results

Figure 3. Univariate forecasting results
If you have any questions, feel free to contact Li Shen through Email (shenli@buaa.edu.cn) or Github issues. Pull requests are highly welcomed!


